T
HE
I
NFLUENCE OF
S
UPPLY AND
D
EMAND
F
ACTORS ON
A
GGREGATE
H
EALTH
C
ARE
E
XPENDITURE WITH A
S
PECIFIC
F
OCUS ON
A
GE
C
OMPOSITION
E
RIKA
S
CHULZ
ENEPRI
R
ESEARCHR
EPORTN
O.
16
AHEAD
WP6,
P
ARTA:
D
ATAC
OLLECTIONR
ESULTSN
OVEMBER2005ENEPRI Research Reports are designed to make the results of research projects
undertaken within the framework of the European Network of Economic Policy Research Institutes (ENEPRI) publicly available. This paper was prepared as part of the AHEAD project – Ageing, Health Status and the Determinants of Health
Expenditure – which has received financing from the European Commission under
the 6th Research Framework Programme (contract no. SP21-CT-2003-502641). Its findings and conclusions are attributable only to the author/s and not to ENEPRI or any of its member institutions.
ISBN92-9079-603-0
AVAILABLE FOR FREE DOWNLOADING FROM THE ENEPRI WEBSITE (HTTP://WWW.ENEPRI.ORG)
OR THE CEPS WEBSITE (WWW.CEPS.BE)
Aggregate Health Care Expenditure with a
Specific Focus on Age Composition
ENEPRI Research Report No. 16/November 2005
Erika Schultz*
Abstract
Expenditure on medical treatment has tended to increase as a proportion of national income throughout the European Union. Overall there has been a rising trend in the mean as low-spending countries such as the UK have faced political pressure to spend at least the average EU proportion of their national income on the provision of health services, medical treatment and long-term care. A particular concern is that with an ageing population and therefore the prospect of more old people around, the pressures on health care expenditure will increase further. The aim of this 6th work package (WP6) of the AHEAD project is to explain how demand and
supply factors influence aggregate health care expenditure with a specific focus on age composition. Several studies in the past have shown that health care expenditure is not only influenced by demand factors, but also by those on the supply side, particularly technological progress, political decisions and economic framework conditions.
In contrast with other studies (and aside from the focus on age), WP6 emphasises variables describing health care and financing systems. The idea is that the inclusion of these variables affords a better explanation of health care expenditure. This report collects data on demand, supply and utilisation of health care from official statistics and creates additional variables describing the health care and financing systems based on a literature review. In total, 63 variables are included in a basic data set for 28 countries, mostly covering the period 1980-2003. A brief statistical overview shows the development of some of the variables in the countries covered. The expected strong connection between health care expenditure and GDP can be seen in a cross-section analysis for 2003. The relation between health care expenditure and the share of the elderly in the population was also positive, but not as strong as in the case of GDP.
Introduction ... 1
1. Variables... 2
1.1 Dependant variables... 2
1.2 Demand factors ... 3
1.3 Supply factors ... 4
1.4 Framework conditions ... 4
1.5 Indictors classifying the health care systems ... 5
2 Data sources, availability and comparability across countries... 8
2.1 Data sources ... 8
2.2 Data availability ... 8
2.3 Data comparability across countries ... 9
2.4 Basic data set for further analyses... 11
3 Statistical overview ... 20
3.1 Health care expenditure ... 20
3.2 Demography and behaviour... 23
3.3 Physicians and technical equipment ... 30
3.4 Economic situation... 34
3.5 Health care systems... 35
4 Main findings and conclusions ... 37
Bibliography ... 38
List of Tables
1. Ratios of per capita expenditure by age... 32. Percentage of total health expenditure financed by taxes... 6
3. Household out-of-pocket payments*) as a percentage of total health expenditure ... 7
4. Basic data set ... 12
1. Determinants of health care expenditure...2
2. Health care expenditure per capita in 2002 ($US PPP)...20
3. Development of health care expenditure per capita in 1980-2003 in the EU-15 ($US PPP)...21
4. Health care expenditure as a percentage of GDP ...21
5. Total expenditure on health as a percentage of GDP ...22
6. Public health expenditure as a share of total health expenditure (2002) ...23
7. Development of public finance in total health expenditure in the EU-15 ...23
8. Proportion of the elderly in the total population (2001)...24
9. Proportion of the elderly in the total population of the EU-15...25
10. Proportion of persons aged 65-74 in the total population ...26
11. Proportion of persons aged 75+ in the total population...26
12. Changes in life expectancy at age 65 and changes in the share of persons aged 65+ between 1980 and 2003 ...27
13. Health care expenditure per capita and share of persons aged 65+ (2001) ...27
14. Number of cigarettes consumed per person per year (2000)...28
15. Pure alcohol consumption in litres per capita of the population aged 15+ (2002) ...29
16. Proportion of the population in good health (2002) ...29
17. Practising physicians per 1,000 inhabitants (2002) ...30
18. Practising physicians per 1,000 inhabitants in the EU-15 ...31
19. Practising physicians per 1,000 inhabitants in the new member states and the CC-3 ...32
20. Acute care beds per 1,000 inhabitants (2002) ...31
21. Acute care beds per 1,000 inhabitants in the EU-15 ...32
22. Acute care beds per 1,000 inhabitants in the new member states and the CC-3 ...33
23. CT scanners per million of the population (2002)...33
24. GDP per capita in 2002 ($US PPP)...34
25. Health care expenditure and GDP per capita (2002)...34
|1
Aggregate Health Care Expenditure with a
Specific Focus on Age Composition
ENEPRI Research Report No. 16/November 2005
Erika Schultz
Introduction
Expenditure on medical treatment has tended to increase as a proportion of national income throughout the European Union. There has been a rising trend in the mean as low-spending countries such as the UK have faced political pressure to spend at least the average EU proportion of their national income on the provision of health services, medical treatment and long-term care. A particular worry is that with an ageing population and therefore the prospect of more old people around, the pressures on health care expenditure will increase further. This issue is of concern in its own right and because of its fiscal implications. Rising health expenditures in turn put pressure on the targets of the Stability and Growth Pact. They also prompt the question of whether budgetary targets should be tightened ahead of projected growth in public expenditures, so as to ‘save up’ for future spending and to keep expected future tax rates reasonably constant.
The main focus of the public discussion is the impact of an ageing society on health and long-term care expenditure. Cross-sectional data show a strong positive correlation between age and health expenditure (EPC, 2001). In all EU countries the picture is nearly the same: a strong increase with age. Therefore, it is expected that the ageing process could affect the sustainability of health care systems. But health expenditure is not only influenced by demand. In addition to demography, other important factors influence health expenditures, especially medical and technological progress, political decisions and economic framework conditions. A study for Germany showed that health expenditures were mostly influenced by technological progress and not by the ageing process (Breyer, 1999). The same results were observed for health care expenditures in the US (Okunade & Murthy, 2002).
Figure 1. Determinants of health care expenditure
Several earlier studies have shown a positive association between aggregate income per capita and health care expenditures per capita. Newhouse (1977) based his study on data from 13 developed countries and his main findings revealed that 92% of the variation in medical expenditure per capita could be explained by the variation in national income per person. Later studies (Gerdtham et al., 1992) confirm that GDP per capita appears to be the most important statistical factor in the cross-national variation in health care expenditure. This point leads to the question of how much can be explained by other factors, especially the relevance of making forecasts on the basis of demand-side aspects such as demographic changes.
In Part A of the 6th AHEAD work package (WP6) a list of variables influencing health care
expenditure is created based on various earlier empirical studies. Additional, institutional and system variables are included to account for the degree of central control on total health care spending, economic incentives, etc. The analyses are carried out for different groups of countries based on the availability of data. In general, data is collected for all 25 EU countries and the three candidate countries, for the period 1980-2003.
1. Variables
The variables used for the analyses can be classified as dependant variables and explanatory variables: demand factors, supply factors, those factors representing the overall conditions and variables reflecting the health care system and the financing of health care services.
1.1 Dependant
variables
The aim of this part of the AHEAD project is to analyse the extent to which the development of health care expenditure is influenced by certain demand, supply and other factors. Thus total
hospital days
supply
classfica-prices - hospital stays survivors individuals tion of
& with at diagnosis mor- logical
costs - length of hospital least one (ICD 9) bidity progress
stay non- hospital and
inci-health survivors stay dence over
insurance health life span
schemes ex- demographic
pen healthy individuals population determants
di- - size - fertility
tu- - gender - life expectancy
supply re care-giving disability - age-structure - migration
informal at home level I individuals
caregivers prices - informal care-giving in need impair- func-professional & by members of the disability for ments tional
caregivers costs family/friends level II long-term in ADL
- formal care-giving care and IADL disa-
socio-disability bility economic
long-term care in institutions level III
determi-insurance - nursing homes nants
schemes - day care centres healthy individuals
Source: Schulz/Leidl/König 2003.
framework conditions, economic development, policies (health and other), assets
acute health status
health care expenditure can be used as a variable for the entire public and private spending on health care. Total health care expenditure is measured as ‘total health care expenditure per capita in $US PPP’. The discourse about the sustainability of health care finances does not generally focus on total health care expenditure, but on that for public health care alone. Therefore, data on public health care expenditure is collected as well as that associated with private payments. Private payments can be separated into out-of-pocket payments, private insurance distributions and contributions to other private funds.
1.2 Demand
factors
Total health care expenditure depends on the total number of inhabitants and the age structure of the population. A study for the EU-15 showed that in all countries health care expenditure increased with age (EPC, 2001). OECD health data provide the ratio of per capita health expenditure by age. Table 1 shows that the amount of health expenditure for the elderly (aged 65+) in most countries is around three or more times the amount spent on those aged 0-64. Among the elderly health expenditure is higher for persons aged 75+ than for those aged 65-74.
Table 1.Ratios of per capita expenditure by age
Country Year Pop. 65+ / pop. 0-64
Pop. 75+ / pop. 0-64
Pop. 65-74 / pop. 0-64
Czech Republic Finland France Germany Portugal Sweden Switzerland UK
1997 1990 1991 1994 1993 1990 1991 1997
2.80 3.95 2.96 2.68 1.70 2.83 4.00 3.35
2.98 5.52 3.73 3.17 2.14 3.43 5.70 4.62
2.69 2.81 2.20 2.34 1.40 2.30 2.55 2.25
Source: OECD Health Data (2004a).
For the WP6 analyses the population is differentiated into the following age groups: 0-5, 6-19, 20-34, 35-49, 50-64, 65-74, 75-84 and 85+. The ageing of the population is attributed to increasing life expectancies, in particular for older persons, and low fertility rates. Therefore, the development of these variables is also of interest. The variables are the total fertility rate, the life expectancy at birth and life expectancy at age 65 for both men and women. The fertility rate is also an indicator of births among middle-aged women, which leads to an increase in health care expenditures. Additionally, the number of inhabitants is influenced by migration flows. Thus, the net migration per 1,000 inhabitants is included in the list of variables. The health behaviour of migrants is different from that of citizens, and for some groups of migrants – especially asylum seekers – the state covers health care costs and fixes a list of provided and covered services. Perhaps a separate focus on citizens and foreigners may lead to better results. Empirical studies show that health expenditure is more related to nearness to mortality than to age. A crude indicator for the influence of mortality on health care expenditure could be the mortality rate per 1,000 inhabitants. To analyse whether such an indicator influences total health expenditure, the crude mortality rate is included in the data set.
long-term care, and is an important driver of health expenditure (Schulz, 2004). Thus, we wanted to include the share of persons in good health in the analyses.
Health behaviour is another important factor that influences health status as well as the direct demand for health care services. To measure health behaviour two indicators are used: alcohol consumption (litre per capita aged 15+) and tobacco consumption (in grams or in cigarettes per person per year).
Another important variable is education. Individuals with higher levels of education show healthier behaviour, tend to consult a doctor more often – perhaps for prevention – and have fewer hospital admissions (along with a shorter length of hospital stay) (Schulz, 2004). The results of regression analyses based on micro data lead to the inclusion of the education level of a population for analyses on an aggregate level. An indicator can be the share of persons with a low education level – i.e. level 0/1/2 from the ISCED classification.
Two utilisation indicators may also be included in the analyses: the number of physician consultations per 1,000 inhabitants and the occupancy rate of acute hospital beds.
1.3 Supply
factors
Providing health care services and drugs incurs costs. Therefore, several indicators for the volume of services provided are included in the analyses. The indicators are: physicians per 1,000 inhabitants, in-patient care beds for acute care per 1,000 inhabitants, capacity in residential nursing homes/homes for the elderly, MRI scanners per million of the population, CT scanners per million of the population and dialyses per 100,000 inhabitants. The development of modern equipment and components could be an indicator for technological progress, which seems to be an important cost driver.
In some cases – in particular for elective surgeries – the supply is not great enough to meet the demand. As a result waiting lists exist. This variable is also included to indicate the countries in which such restrictions exist.
1.4 Framework
conditions
The overall economic situation in a country determines the private and public spending on health care. A high living standard indicates the prosperity of a society to provide the basis for a broad spectrum of health care services and the application of new technologies. The living standard can be measured by the GDP per capita. In health care systems that are principally financed by taxes as well as those mainly financed by contributions to health care insurance schemes the amount of tax contributions depends on the added value or earnings/income. High economic growth rates assist the financing of public and private health care costs.
Another indicator of the economic situation is the unemployment rate. In most health care insurance systems the amount of the contribution depends on the individual income of the insured person and therefore the contributions of unemployed persons with low incomes are less than those of employed persons. Thus, high unemployment rates lead to lower revenues for health care insurance schemes and restrict the financial scope. In addition to this direct influence on the premium income of health care insurers, a long period of unemployment and the absence of prospects for obtaining a job in the near future could lead to an adverse impact on health behaviour. For example, long periods of unemployment could go in line with depression and higher levels of alcohol consumption. Therefore, unemployment could influence the demand for health care services.
among inactive persons than their active counterparts (Schulz, 2004). It can be expected that a high level of women’s labour force participation reduces the possibilities for informal care-giving and in these cases long-term care has to be provided by professional care givers at home or in institutions. This consequence may have an increasing effect on this kind of health care expenditure.
1.5 Indictors
classifying
the health care systems
The way in which health systems are financed affects the degree of government control over health spending. Most EU countries have some form of publicly financed or administered health insurance schemes, but in some countries tax-financed systems have been introduced to cover the benefit package. Private health insurance is used to fill in the gaps in the benefit package or to absorb out-of-pocket payments.
Health care systems can be classified by the degree to which health care financing and delivery systems are publicly controlled or administered. The OECD uses three models to classify the systems (Docteur & Oxley, 2003):
• The public integrated model combines on-budget financing of health care provision with hospital providers that are part of the government sector. These systems are organised and operated like any government department. Staff are mostly public-sector employees and salaried. Ambulatory doctors can be either public employees or private contractors.
• In the public contract model, public payers contract with private health care providers. The payers can be either state agency or social security funds. In many public contract systems, private hospitals are run on a non-profit basis. Independent private contractors generally supply ambulatory care.
• The private insurance/private provider model uses private insurance combined with private providers. Insurance coverage can be compulsory or voluntary. Payment methods have traditionally been activity-based.
A pure form of the private insurance/private provider model is not common in EU countries. In most countries a mix of public and private insurance and private providers exists. Private insurance is mostly complementary, supplementary or duplicate. Only in some countries does a public integrated model exist.
In EU countries a mix of sources for health care revenues are common. Countries with systems that are mainly financed by taxes are Denmark, Finland, Ireland, Italy, Spain, Sweden, the UK, Latvia and Malta. Countries with systems that are predominantly funded by insurance contributions are France, Germany, Luxembourg and the Netherlands, along with new EU member states such as the Czech Republic, Estonia, Hungary, Poland, Slovakia and Slovenia. For the most part the health care revenues in Austria stem from insurance contributions, but also from taxation and user charges/out-of-pocket payments. Therefore, the health care system is basically a contract system, although it has mixed financing. A mixed system also exists in Belgium, Greece, Portugal, Bulgaria, Lithuania, Romania and Turkey. Cyprus has a dual system with a public health system financed by taxation and a private health system with user charges and out-of-pocket contributions.
Table 2. Percentage of total health expenditure financed by taxes
In order to classify the health care systems some additional indicators are used. One indicator describes whether a ‘gatekeeper’ system exists. Gatekeepers are mostly general practitioners (GPs) or family doctors who refer the patient for secondary and/or tertiary care (to specialists and hospitals). It is expected that a gatekeeper system is more efficient, because the patient is attended by one doctor before and after secondary and tertiary care. But this scheme works only if the patient is obliged to visit the same primary care physician after treatment by a specialist or in a hospital and if the GP receives the needed information about the conducted medical treatments. A gatekeeper system has the aim of reducing the treatment costs by avoiding duplicate tests.
Another indicator focuses on the co-payments and user charges involved in visiting a primary care doctor, a specialist or a dentist, or for an in-patient hospital stay or pharmaceuticals. User charges and co-payments are the main components of out-of-pocket payments, which along with private insurance contributions make up the majority of private health expenditure. User charges have been advocated as a source of additional revenue to slow down the necessary increase of taxation or contributions to fund health care services. Further, it is expected that user charges cap excessive demand, which can put added pressure on already escalating expenditures for covered health services. But on the other hand, user charges disproportionately affect lower income groups through changes in their utilisation of services. In Germany, for example,
No Countries 1980 1985 1987 1989 1990 1991 1992 1993 1994 1995 1996 1997 1998 1999 2000 2001 2002
1 Austria 13,5 12,6 13,2 13,7 13,8 13,9
2 Belgium 39 38
3 Denmark 86,5 85 83,4 82,8 82,3 82
4 Finland 67,1 70,3 62,2 61,9 61,9 61,5 60,8
5 France1) 4,3 3,6 2,3 2,2 2,1 2,1 2,3 2,4 2,4 2,5 2,5 2,5 2,6 2,7 2,4
6 Germany 13 12,9 10,8 8,1 8 7,9 7,8 7,8
7 Greece 40 30
8 Ireland1) 71,1 72,2 70,6 72,3 71 70,7 70,5 73,8 75,7 72 72,4 74,9 74,6
9 Italy 80,5 77,2 78,1 67,7 67,8 68 68 67
10 Luxembourg 20,9 14,7 15,4 14,8
11 Netherlands 9 11 10 4,8 5,2 5,6
12 Portugal 65,5 62,8 59,6 63 63,4 61,7 64,8 67,9 68,5 69
13 Spain 70 98
14 Sweden 77,7
15 UK 80,1 77,5 78,8 81,8 82 82,4 82,1 81,5
16 Cyprus no information
17 Czech Republic 96,8 95,4 19,1 16,5 16,5 12,5 11,8 10,9 11,1 10,5 9,5 10,2
18 Estonia 100 10,9 10,8 10,7
19 Hungary 16,1 18,6 16,8 14 13,1 12,7 12,2
20 Latvia 78,9 78,9
21 Lithuania 7,4
22 Malta dual system, no infromation about the share of taxed based financing on total health expenditure
23 Poland 100 94 70 76 73
24 Slovakia 34,0 31,3 24,5 5,2 5,0 4,4 3,2
25 Slovenia 98,5 2,6 2,8 3,4 3,4 3,3
26 Bulgaria 100 98 100 100 69,2
27 Romania 100 100 100 100 100 100 100 100 36,2 21,6
28 Turkey 46,1 46,7 46 43,1 43,1 43,4 40,4
Sources: HIT reports
increased user charges and co-payments for pharmaceuticals and medical aids have led to a reduction in doctor visits, especially by low-income patients (elderly persons and those with chronic diseases) although the total yearly co-payments are limited (2% and 1% respectively of the yearly income). Therefore, it could be that high user charges slows down the increase in total health care expenditure.
[image:11.595.89.507.238.571.2]Table 3 shows the proportion of out-of-pocket payments in total health expenditure. Countries that have systems with a high share of out-of-pocket payments are Spain, Hungary, Poland and Turkey.
Table 3. Household out-of-pocket payments*) as a percentage of total health expenditure
In many EU countries there is a supplementary or complementary private health-insurance system. Reductions in the statutory health benefits package in these systems tend to lead to an increase in supplementary, voluntary health-insurance contributions to cover the non-statutory services (for example co-payments for prostheses). Contributions to private insurance schemes are, along with out-of-pocket payments, another large part of private health expenditure.
The reimbursement systems of physicians and hospitals are also used to characterise the health care system. The way in which hospitals are remunerated sets different incentives for their financial management. A prospective global budget based on past performance for hospitals could be a tool for cost containment, if the global budget is fixed (with a ceiling on hospitals).
Countries 1980 1985 1990 1995 1996 1997 1998 1999 2000 2001 2002 2003 1 Austria 14,9 15,6 17,6 17,9 18,2 18,6 18,2 17,5 2 Belgium
3 Denmark 11,4 13,6 16,0 16,3 16,2 16,3 16,6 16,1 15,9 15,8 15,8 15,8 4 Finland 18,4 18,3 15,5 20,5 20,3 19,7 19,4 20,3 20,4 20,2 20,0 19,0 5 France 12,8 14,4 11,4 10,8 10,5 10,3 10,3 10,3 10,5 10,2 9,8 10,0 6 Germany 10,3 11,2 11,1 10,0 10,1 10,8 11,2 10,9 10,5 10,6 10,4 10,4
7 Greece 44,9 43,6 46,0 46,5
8 Ireland -9 14,4 16,5 15,5 14,6 13,5 10,7 14,0 13,5 11,9 13,2 9 Italy -9 -9 15,3 24,4 24,2 24,1 24,5 24,1 22,8 20,3 20,4 20,7 10 Luxembourg 7,2 9,2 5,5 6,2 7,2 7,5 7,6 7,4 7,5 7,5 11,9 11 Netherlands 8,4 9,0 9,0 8,7 8,0 7,8 12 Portugal
13 Spain 23,5 23,2 23,1 23,2 23,3 23,7 23,8 23,6 23,7 14 Sweden
15 United Kingdom 8,6 -9 10,6 10,9 11,0 16 Cyprus
17 Czech Republic 2,6 7,3 7,5 8,3 8,1 8,5 8,6 8,6 8,4 8,4 18 Estonia
19 Hungary 16,0 18,4 18,7 22,3 24,9 26,3 27,7 26,3 20 Latvia
21 Lithuania 22 Malta
23 Poland 8,3 27,1 26,6 28,0 34,6 28,9 30,0 28,1 27,6 24 Slovakia 8,3 8,4 10,4 10,6 10,7 10,9 11,7 25 Slovenai
26 Bulgaria 27 Romania
28 Turkey 29,7 30,8 29,1 27,6
*) Household out-of-pocket expenditure comprise cost-sharing, self-medication and other expenditure paid directly by private households, irrespective of whether the contact with the health care
But the incentives for cost control are limited if the budget is retrospectively calculated on a full-cost basis. Critics claim that a global budget system is inflexible – that it does not reward more efficient departments and sets no incentives for better organisation within a hospital or more effective treatments. Remuneration on a per diem basis encourages increases in the hospital stays of patients. The most effective remuneration seems to be a diagnosis-related group (DRG) payment system. More and more countries are changing their hospital reimbursement system to a DRG-based method.
Other variables describing the health care system are the free choice of physicians and hospitals and the existence of waiting lists for specialist treatments or elective surgeries in hospitals. A free choice of physicians and hospitals is associated with two contrasting effects. One argument is that free choice stimulates competition among physicians and hospitals and will therefore have a slowing-down effect on health expenditure. Another argument is that free choice leads to more doctor visits and duplicate treatments because patients change physicians more often if they have the opportunity.
Waiting times for elective surgery are a main health policy concern in approximately half of the OECD countries (Hurst & Sicilliani, 2003). Mean waiting times for elective surgeries are above three months in several countries and maximum waiting times can stretch into years. Waiting times can lead to deterioration in health, loss of utility and extra costs. Waiting lists are mostly found in countries that combine public health insurance, low or no patient cost-sharing and constraints on surgical capacity. In these cases waiting lists are used as non-price rationing. But they generate high dissatisfaction among patients. Many countries take steps to reduce long waiting lists for elective surgery. Some have increased the capacity for surgery while others have combined maximum waiting-time targets with additional activity and changed incentives. In many cases improvements in the efficiency of surgical units could be implemented. Nevertheless, at present waiting lists exist in Denmark, England, Finland, Ireland, Italy, the Netherlands, Portugal, Spain, Sweden, Hungary, Malta and Slovenia.
2
Data sources, availability and comparability across countries
2.1 Data
sources
Data have been collected for all 25 EU member states and the 3 candidate countries for (where possible) the period 1980-2003. The main data source for the health care expenditure, demand and supply factors has been the OECD’s Health Data 2004. For those countries with no
information in this database the WHO’s European Health for All Database has been used. In some cases missing data in the OECD time series between 1980 and 2003 have been filled in with WHO data, if this has seemed to fit in the time series. Population data stem from EUROSTAT. The indicators describing health care and the financing systems are author-created variables based on a review of the literature. The Health Care Systems in Transition reports
from the European Observatory on Health Systems and Politics have provided the main information for individual countries; additional relevant literature has also been used, such as the MISSOC, MISSCEEC and other papers from the European Commission, along with OECD data and reports.
2.2 Data
availability
The OECD Health Data 2004 covers 19 EU countries: the EU-15 and the Czech Republic,
supply of health care services (physicians per 1,000 inhabitants, physicians per 100 hospital beds, acute-care beds per 1,000 inhabitants, MRI scanners per million inhabitants, CT scanners per million inhabitants and dialyses per 100,000 inhabitants), the acute-care occupancy rate, the population covered by the public health care system, GDP per capita in $US PPP and women’s labour force participation rates. Where it has seemed possible, the OECD data have been combined with information from the WHO European Health for All Database for the non-OECD EU member states. Additionally, the WHO database has been used for life expectancies at birth and at age 65, as well as for the crude mortality rate, the health behaviour (alcohol and tobacco consumption) and for nursing and elderly home beds per 100,000 inhabitants. Population data stem from Eurostat. For the EU-15 information is mostly available for period 1980 to 2002-03. Data for the new member states are generally available from the beginning of the 1990s, but population and supply data are often available for longer periods (1980 or 1985 to 2002-03). OECD health data have also provided information about the share of the population in good health, but only for some countries and for certain years (different per individual country). Therefore, it has not been possible to integrate this variable into the data set. Another problem has been the lack of sufficient data for Cyprus and Malta.
2.3 Data comparability across countries
The OECD has the responsibility of ensuring that the data presented in the Health Data 2004
report are as comparable as possible across countries and over time. To improve the quality of international comparisons, the System of Health Accounts (SHA) was published in May 2000
with guidelines for reporting health expenditure. Total expenditure on health in the SHA is defined as the sum of expenditures on activities that have the goal of:
• promoting health and preventing disease;
• curing illness and reducing premature mortality;
• caring for persons affected by chronic illness who require nursing care;
• caring for persons with health-related impairments, disabilities and handicaps who require nursing care;
• assisting patients to die with dignity;
• providing and administering public health; and
• providing and administering health programmes, health insurance and other funding arrangements.
Therefore, the SHA includes:
• services of curative care (HC.1);
• services of rehabilitative care (HC.2);
• services of long-term nursing care (HC.3);
• ancillary services to health care (HC.4);
• medical goods dispensed to out-patients (HC.5); = total expenditure on personal health (HC.1-HC.5);
• services of prevention and public health (HC.6);
• health administration and health insurance (HC.7); = total expenditure on collective health (HC.6+HC.7); = total current expenditure (HC.1-HC.7);
• investment in health (HC.R.1);
OECD member countries are at varying stages of reporting total health expenditure according to the definition of the SHA. In general the data fall into four groups:
The first group of countries closely follows the SHA definition just described. These are:
Denmark, France, Germany, Hungary, the Netherlands, the UK, Spain and Turkey.
The second group has locally produced health accounts, which are similar to the SHA: Finland
and Poland.
The third group has national accounts with numerous problems for international comparisons,
such as:
• the level of detail is often minimal;
• certain elements of health care expenditure are reported as social services (which leads to underestimations of overall health expenditure) and most occupational health care is not reported in national accounts;
• the national accounts are not precise in defining what is included in health care;
• the availability of data on private health care expenditure is limited; and
• details on data sources and estimation methods are usually not published.
This third group of countries comprises Austria, the Czech Republic, Greece, Ireland, Italy, Luxembourg, Portugal, the Slovak Republic and Sweden.
Finally, Belgium comprises a fourth group, for which estimates are made by the OECD
Secretariat based on the OECD National Account database.
In most countries there are breaks in the time series owing to changes in the reporting system, i.e. changes from national accounts (NA) or National Accounts Estimates (NAE) to SHA accounts, as follows for the country groups discussed above:
Group I – Germany 1970-90 (NA), 1992-2002 (SHA); Hungary 1991-97 (NA), 1998-2002 (SHA); the Netherlands 1972-1998 (NA), 1998-2001 (SHA); the UK 1960-96 (NAE), 1997-2002 (SHA); Spain 1960-98 public expenditure (NA) and private expenditure (NAE), 1999-2002 (SHA); and Turkey 1970-97 (OECD estimates), 1998 (NA), 1999-2000 (SHA).
Group III – Greece 1970, 1980 (OECD estimates), 1987-2002 (NAE); Portugal 1970-94 (OECD estimates), 1995-2002 (NAE).
The data on total health expenditure for the remaining countries (Cyprus, Estonia, Latvia, Lithuania, Malta, Slovenia, Bulgaria and Romania) stem from the WHO database. These countries reported the data directly. Health expenditure in some of these countries, particularly in the Eastern European ones, is likely to be underestimated, owing to the exclusion of the private sector and out-of-pocket payments (WHO, 2003, p. 98). But in the remaining new member states and candidate countries, for the most part some information about private health care expenditures is available as outlined below:
• Romania – private expenditure is only available for 1996 (4.1% of total health expenditure or THE);
• Slovenia – there is information about voluntary health insurance (11.6% of THE in 1998), but there is no data about direct payments;
• Latvia – different estimations about the level of out-of-pocket payment exist (e.g. estimated as 39% in 2000 by the WHO, 7-10% by the Ministry of Welfare and 21% for the period 1998-99);
• Bulgaria – only WHO estimates are available for out-of-pocket payments (18% in 2000);
• Estonia – information about out-of-pocket payments and private health insurance exists starting from 1999 (private health insurance in 2002 was around 24% of THE);
• Cyprus – a study offers information about out-of-pocket payments (around 4% of median household income in 2002); and
• Malta – while no co-payments are required for public health care, for private care out-of-pocket and private insurance payments do occur, but no exact data are available.
Health expenditure and financing data are the most important aspects in the data set, and use of the OECD health data ensures the most comparable data in this field. Data about population and age structure seem to be fully comparable and in any case Eurostat did not report any problems. Nor did the OECD report any problems for the other supply and demand factors.
The author-generated variables classifying the health care systems stem mainly from the Health Care Systems in Transition (HiT) reports from the European Observatory on Health Systems
and Politics. The Observatory is a partnership among the WHO Regional Office for Europe, the governments of Belgium, Finland, Greece, Norway, Spain and Sweden, the Veneto Region of Italy, the European Investment Bank, the Open Society Institute, the World Bank, CRP-Santé Luxembourg, the London School of Economics and Political Science (LSE) and the London School of Hygiene & Tropical Medicine (LSHTM). The HiT profiles are produced by country experts in collaboration with the research directors and staff of the Observatory. In order to maximise comparability among countries, a standard template and questionnaire have been used. These provide the detailed guidelines and specific questions, definitions and examples needed to compile the HiT. Notes about the methodology used by the Observatory are reported on its website homepage as follows:
Compiling the HiT profiles poses a number of methodological problems. In many countries, there is relatively little information available on the health care system and the impact of reforms. Most of the information in the HiTs is based on material submitted by experts in the respective countries, which is then reviewed by independent experts. Nonetheless, some statements and judgements may be coloured by personal interpretation. In addition, the absence of a single agreed terminology to cover the wide diversity of systems in the European Region means that variations in understanding and interpretation may occur. A set of common definitions has been developed in an attempt to overcome this, but some discrepancies may persist. These problems are inherent in any attempt to study health care systems on a comparative basis. (Retrieved from www.euro.who.int/observatory/Hits.)
Nevertheless, using the information from these reports seems to provide the most comparable analyses of the health care systems in the member states.
2.4 Basic data set for further analyses
Table 4. Basic data set
Countries
Variable HEALTH CARE EXPENDITURE
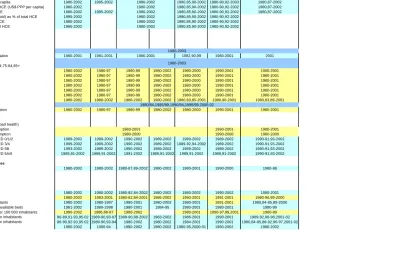
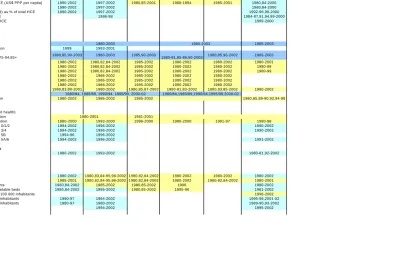
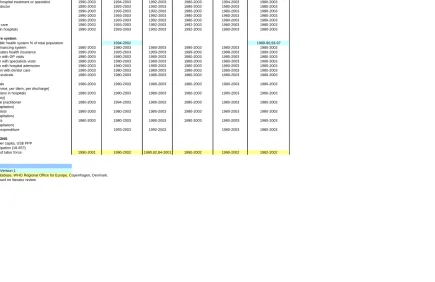
HCE US$ PPP (in million) 1980,85,90-2002 1980-90,92-2002 1980,87-2002 HCE US$ PPP per capita 1980,85,90-2002 1980-90,92-2002 1980,87-2002 Public expenditure US$ PPP (in million) 1980-2002 1995-2002 1980,85,90-2002 1980-90,92-2003 1980,87-2003 Public expenditure US$ PPP per capita 1980-2002 1995-2002 1980,85,90-2002 1980-90,92-2003 1980,87-2002 Public expenditure as % of total HCE (US$ PPP per capita) 1980-2002 1980,85,90-2002 1980-90,92-2002 1980,87-2002 Private payment as % of total HCE 1980-2002 1995-2002 1980,85,90-2002 1980-90,92-2002 1980,87-2002 Out-of-pocket payments (household) as % of total HCE 1995-2002 1980,85,90-2002 1980-90,92-2002
Private insurance as % of total HCE 1980-2002 1980,85,90-2002 1980-90,92-2002 All other privat funds as % of total HCE 1995-2002 1980,85,90-2002 1980-90,92-2002 DEMAND FACTORS
Population
total population at 1. January
foreigners as share of total population 1980-2001 1981-2001 1982,90,99 1980-2001 2001 age-composition as share of total
0-5,6-19,20-34,35-49,50-64,65-74,75-84,85+
life expectancy at birth 1980-2002 1980-97 1980-99 1980-2002 1980-2000 1990-2001 1980-2001 male 1980-2002 1980-97 1980-99 1980-2002 1980-2000 1990-2001 1980-2001 female 1980-2002 1980-97 1980-99 1980-2002 1980-2000 1990-2001 1980-2001 life expectancy at 65 1980-2002 1980-97 1980-99 1980-2002 1980-2000 1990-2001 1980-2001 male 1980-2002 1980-97 1980-99 1980-2002 1980-2000 1990-2001 1980-2001 female 1980-2002 1980-97 1980-99 1980-2002 1980-2000 1990-2001 1980-2001 total fertility rate 1980-2002 1980-2002 1980-2002 1980-2002 1980,83,85-2001 1980,90-2001 1980,83,89-2001 migration per 1000 inhabitants
crude death rate per 1000 population 1980-2002 1980-97 1980-99 1980-2002 1980-2000 1990-2001 1980-2001
Other demand factors
health status (share of people in bad health)
health behaviour: alcohol consumption 1990-2001 1980-2001
health behaviour: tobacco consumption 1990-2000 1980-2000
education level - attainment ISCED 0/1/2 1989-2002 1989-2002 1990-2002 1989-2002 1989-2002 1989-2002 1990-91,93-2002 education level - attainment ISCED 3/4 1989-2002 1989-2002 1990-2002 1989-2002 1989-92,94-2002 1989-2002 1990-91,93-2002 education level - attainment ISCED 5B 1993-2002 1989-2002 1990-2002 1989-2002 1989-2002 1989-2002 1990-91,93-2002 education level - attainment ISCED 5A/6 1989,91-2002 1989,91-2002 1991-2002 1989,91-2002 1989,91-2002 1989,91-2002 1990-91,93-2002
Utilisation of health care services
doctor's consultation per capita 1980-2002 1980-2002 1980-87,89-2002 1980-2002 1980-2001 1990-2000 1980-98
SUPPLY FACTORS
Supply of health care services
physicians per 1 000 inhabitants 1980-2002 1980-2002 1980-82,84-2002 1980-2002 1980-2002 1990-2002 1980-2001 physicians per 100 hospital beds 1980-2002 1983-2001 1980-82,84-2001 1986-2002 1990-2001 1991-2001 1980-96,99-2000 acute care beds per 1 000 inhabitants 1980-2002 1980-1997 1980-2001 1980-2003 1980-2001 1991-2001 1980,84-85,89-2000 acute care occupancy rate % of available beds 1981-2002 1980-1998 1980-2001 1984-95 1980-2001 1980-2001 1980-99 nursing and elderly home beds per 100 000 inhabitants 1990-2002 1986,88-97 1980-2002 1980-2001 1990-97,99,2001 1980-89 MRI (and CT scanners) per million inhabitants 86-89,91-93,95-02 1989-90,93-97 1989-90,98-2002 1983-2002 1986-2001 1990-2001 1989-92,96-98,2001-02 (MRI and) CT scanners per million inhabitants 86-90,92-93,95-02 1989-90,93-94 1980-2002 1980-2002 1984-2001 1990-2001 1980,84-85,89-92,96-97,2001-02 dialyses per 100 000 inhabitants 1980-2002 1980-94 1980-2002 1980-2002 1980-95,2000-01 1980-2002 1980-2002
France Greece
1980-2001
1980-2000
Germany
1980/84,1985/89,1990/94,1995/99,2000-02 1980-2003
1980-2001
1980-2003 Austria Belgium Denmark Finland
1980-2002 1980-2002 1980-2002
1980-2002
Table 4. Continued
Countries
Variable HEALTH CARE EXPENDITURE
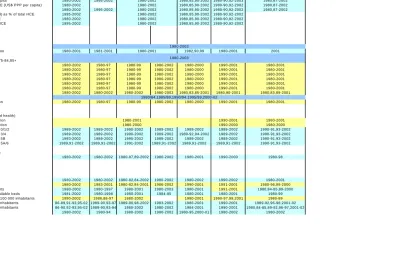
HCE US$ PPP (in m illion) 1980,85,90-2002 1980-90,92-2002 1980,87-2002 HCE US$ PPP per capita 1980,85,90-2002 1980-90,92-2002 1980,87-2002 Public expenditure US$ PPP (in m illion) 1980-2002 1995-2002 1980,85,90-2002 1980-90,92-2003 1980,87-2003 Public expenditure US$ PPP per capita 1980-2002 1995-2002 1980,85,90-2002 1980-90,92-2003 1980,87-2002 Public expenditure as % of total HCE (US$ PPP per capita) 1980-2002 1980,85,90-2002 1980-90,92-2002 1980,87-2002 Private paym ent as % of total HCE 1980-2002 1995-2002 1980,85,90-2002 1980-90,92-2002 1980,87-2002 Out-of-pocket paym ents (household) as % of total HCE 1995-2002 1980,85,90-2002 1980-90,92-2002
Private insurance as % of total HCE 1980-2002 1980,85,90-2002 1980-90,92-2002 All other privat funds as % of total HCE 1995-2002 1980,85,90-2002 1980-90,92-2002 DEM AND FACTORS
Population
total population at 1. January
foreigners as share of total population 1980-2001 1981-2001 1982,90,99 1980-2001 2001 age-com position as share of total
0-5,6-19,20-34,35-49,50-64,65-74,75-84,85+
life expectancy at birth 1980-2002 1980-97 1980-99 1980-2002 1980-2000 1990-2001 1980-2001 m ale 1980-2002 1980-97 1980-99 1980-2002 1980-2000 1990-2001 1980-2001 fem ale 1980-2002 1980-97 1980-99 1980-2002 1980-2000 1990-2001 1980-2001 life expectancy at 65 1980-2002 1980-97 1980-99 1980-2002 1980-2000 1990-2001 1980-2001 m ale 1980-2002 1980-97 1980-99 1980-2002 1980-2000 1990-2001 1980-2001 fem ale 1980-2002 1980-97 1980-99 1980-2002 1980-2000 1990-2001 1980-2001 total fertility rate 1980-2002 1980-2002 1980-2002 1980-2002 1980,83,85-2001 1980,90-2001 1980,83,89-2001 m igration per 1000 inhabitants
crude death rate per 1000 population 1980-2002 1980-97 1980-99 1980-2002 1980-2000 1990-2001 1980-2001 Other dem and factors
health status (share of people in bad health)
health behaviour: alcohol consum ption 1990-2001 1980-2001
health behaviour: tobacco consum ption 1990-2000 1980-2000
education level - attainm ent ISCED 0/1/2 1989-2002 1989-2002 1990-2002 1989-2002 1989-2002 1989-2002 1990-91,93-2002 education level - attainm ent ISCED 3/4 1989-2002 1989-2002 1990-2002 1989-2002 1989-92,94-2002 1989-2002 1990-91,93-2002 education level - attainm ent ISCED 5B 1993-2002 1989-2002 1990-2002 1989-2002 1989-2002 1989-2002 1990-91,93-2002 education level - attainm ent ISCED 5A/6 1989,91-2002 1989,91-2002 1991-2002 1989,91-2002 1989,91-2002 1989,91-2002 1990-91,93-2002 Utilisation of health care services
doctor's consultation per capita 1980-2002 1980-2002 1980-87,89-2002 1980-2002 1980-2001 1990-2000 1980-98 SUPPLY FACTORS
Supply of health care services
physicians per 1 000 inhabitants 1980-2002 1980-2002 1980-82,84-2002 1980-2002 1980-2002 1990-2002 1980-2001 physicians per 100 hospital beds 1980-2002 1983-2001 1980-82,84-2001 1986-2002 1990-2001 1991-2001 1980-96,99-2000 acute care beds per 1 000 inhabitants 1980-2002 1980-1997 1980-2001 1980-2003 1980-2001 1991-2001 1980,84-85,89-2000 acute care occupancy rate % of available beds 1981-2002 1980-1998 1980-2001 1984-95 1980-2001 1980-2001 1980-99 nursing and elderly hom e beds per 100 000 inhabitants 1990-2002 1986,88-97 1980-2002 1980-2001 1990-97,99,2001 1980-89 M RI (and CT scanners) per m illion inhabitants 86-89,91-93,95-02 1989-90,93-97 1989-90,98-2002 1983-2002 1986-2001 1990-2001 1989-92,96-98,2001-02 (MRI and) CT scanners per m illion inhabitants 86-90,92-93,95-02 1989-90,93-94 1980-2002 1980-2002 1984-2001 1990-2001 1980,84-85,89-92,96-97,2001-02 dialyses per 100 000 inhabitants 1980-2002 1980-94 1980-2002 1980-2002 1980-95,2000-01 1980-2002 1980-2002
France Greece
1980-2001
1980-2000
Germ any
1980/84,1985/89,1990/94,1995/99,2000-02 1980-2003
1980-2001
1980-2003 Austria Belgium Denm ark Finland
1980-2002 1980-2002 1980-2002
1980-2002
Table 4. Continued
Countries Variable
HEALTH CARE EXPENDITURE
HCE US$ PPP (in million) 1980-2002 1988-2003 HCE US$ PPP per capita 1980-2002 1988-2002
Public expenditure US$ PPP (in million) 1980-2002 1988-2003 1980-2002 1980-97 Public expenditure US$ PPP per capita 1980-2002 1988-2002 1980-2002 1980-97 Public expenditure as % of total HCE (US$ PPP per capita) 1980-2002 1988-2003 1980-2002 1980-97 Private payment as % of total HCE 1980-2002 1988-2003 1980-2002 1980-97
Out-of-pocket payments (household) as % of total HCE 1983-2002 1988-2003 1980-2002 1998-2002 1991-2002 1980,90-96 Private insurance as % of total HCE 1989-2002 1990-2003 1999-2002 1998-2002 1981-97 1980-2002 1980-96 All other privat funds as % of total HCE 1989-2002 1988-2003 1999-2002 1999-2002 1995-99 1991-2002 1990-96 DEMAND FACTORS
Population
total population at 1. January 1980-2003 1980-2001 1980-2001
foreigners as share of total population 1986-2001 1988-2001 1986-2001 1980-2001 1984-2001 age-composition as share of total
0-5,6-19,20-34,35-49,50-64,65-74,75-84,85+
life expectancy at birth 1980-2001 1980-2001 1980-2002 1980-2000 1980-2002 1980-2001 1980-2001 1980-2002 male 1980-2001 1980-2001 1980-2002 1980-2000 1980-2002 1980-2001 1980-2001 1980-2002 female 1980-2001 1980-2001 1980-2002 1980-2000 1980-2002 1980-2001 1980-2001 1980-2002 life expectancy at 65 1980-2001 1980-2001 1980-2002 1980-2000 1980-2002 1980-2001 1980-2001 1980-2002 male 1980-2001 1980-2001 1980-2002 1980-2000 1980-2002 1980-2001 1980-2001 1980-2002 female 1980-2001 1980-2001 1980-2002 1980-2000 1980-2002 1980-2001 1980-2001 1980-2002 total fertility rate 1980-2002 1980-2001 1980-2002 1980,83,89-2002 1980-81,83,85-2001 1980,83,89-95,97-2001 1980-2002 1980-2001 migration per 1000 inhabitants
crude death rate per 1000 population 1980-2002 1980-2000 1980-2002 1980-2002 Other demand factors
health status (share of people in bad health)
health behaviour: alcohol consumption 1980-1996
health behaviour: tobacco consumption 1981-2000
education level - attainment ISCED 0/1/2 1989-2003 1989-2002 1994-96,98-2002 1989-2002 1989-91,93-2002 1989-2002 1989-2002 1989-2002 education level - attainment ISCED 3/4 1989-2003 1989-2002 1994-96,98-2002 1989-2002 1989-91,93-2002 1989-2002 1989-2002 1989-2002 education level - attainment ISCED 5B 1989-2003 1998-2002 1989-91,98-2002 1989-91,93-2002 1991-2002 1989-96,99-2002 1989-2002 education level - attainment ISCED 5A/6 1989,91-2003 1989,91-2002 1994-96,98-2002 1989-96,98-2002 1989-91,93-2002 1989,91-2002 1989,91-2002 1989,91-2002 Utilisation of health care services
doctor's consultation per capita 1980-88,90-91,93-94,98-2000 1995-2002 1980-2002 1980-2001 1986-87,92-97,2000-01 1980-2001 1980-2000 SUPPLY FACTORS
Supply of health care services
physicians per 1 000 inhabitants 1991-2002 1980,83-2001 1980-2002 1980-91,97-02 1980-2002 1998-2002 1980-2000 1980-99,2001-02 physicians per 100 hospital beds 1980-81,83-2001 1984,86-88,90-2001 1983-2001 1983-91,98-2001 1980-2001 1989-98,2000 1980-97 1980-81,85-93 acute care beds per 1 000 inhabitants 1980-2002 1980-2001 1980,84-02 1980-2001 1980-2001 1995-2002 1980-2000 1980-2002 acute care occupancy rate % of available beds 1980-2002 1980-2001 1980,84-85,87-94,98-2002 1980-2001 1984-2001 1983-2000 1980-96 1980-86,94-2001 nursing and elderly home beds per 100 000 inhabitants 1980-90,94-98,2000-02 1986-97 1990-2001 1980,85-98 1980-99 1980-99 MRI(and CT scanners) per million inhabitants 1989-2002 1989-2002 1985-95 1989-90,96-97 1983-84,87-88,91-2002 1983-95,98-99 1985-95,98-2002 (MRI and) CTscanners per million inhabitants 1985-86,89-90 1989-2002 1989-90,93-2002 1980-81,83-84,89-93 1989-90,96-97 1983-94,87-88,91-2002 1980-93,98-99 1985-90,92-93,97-2002 dialyses per 100 000 inhabitants 1980-95 1980-95 1993-2002 1980-96 1980-91,96-2002 1980-99 1980-95 1980-91,94-95,97-98,2000-02
Ireland
1980-2003 1980-2001
UK Italy Luxembourg Netherlands Portugal
1980-2003
Spain Sweden
1980-2000 1980-2000 1980-2000
1980-2001 1980-2001
1980-2002 1980-2002
1980-2001 1980-2001
1980-2001 1986-2003
Table 4. Continued
Countries
Variable
HEALTH CARE SYSTEM
Organisational structure
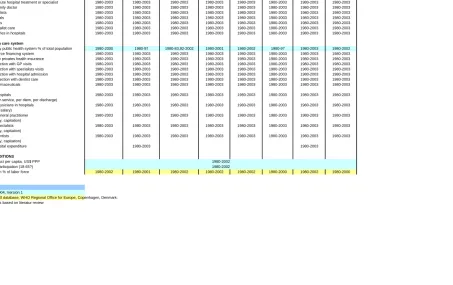
Health care system (public contract, public integrated, mixed) 1980-2003 1980-2003 1980-2003 1980-2003 1980-2003 1980-2003 1980-2003 1980-2003 Gatekeeper to non-acute hospital treatment or specialist 1980-2003 1980-2003 1980-2003 1980-2003 1980-2003 1980-2003 1980-2003 1980-2003
Free choice GP or family doctor 1980-2003 1980-2003 1980-2003 1980-2003 1980-2003 1980-2003 1980-2003 1980-2003
Free choice of specialists 1980-2003 1980-2003 1980-2003 1980-2003 1980-2003 1980-2003 1980-2003 1980-2003
Free choice of hospitals 1980-2003 1980-2003 1980-2003 1980-2003 1980-2003 1980-2003 1980-2003 1980-2003
Free choice of dentists 1980-2003 1980-2003 1980-2003 1980-2003 1980-2003 1980-2003 1980-2003 1980-2003
Waiting lists for specialist care 1980-2003 1980-2003 1980-2003 1980-2003 1980-2003 1980-2003 1980-2003 1980-2003
waiting lists for surgeries in hospitals 1980-2003 1980-2003 1980-2003 1980-2003 1980-2003 1980-2003 1980-2003 1980-2003
Financing the health care system
Population covered by public health system % of total population 1980-2000 1980-97 1980-83,92-2002 1980-2001 1980-2002 1980-97 1980-2003 1980-2002
Multiple or single source financing system 1980-2003 1980-2003 1980-2003 1980-2003 1980-2003 1980-2003 1980-2003 1980-2003
population covered by privates health insurance 1980-2003 1980-2003 1980-2003 1980-2003 1980-2003 1980-2003 1980-2003 1980-2003
Co-payment in connection with GP visits 1980-2003 1980-2003 1980-2003 1980-2003 1980-2003 1980-2003 1980-2003 1980-2003
Co-payment in connection with specialists visits 1980-2003 1980-2003 1980-2003 1980-2003 1980-2003 1980-2003 1980-2003 1980-2003
Co-payment in connection with hospital admission 1980-2003 1980-2003 1980-2003 1980-2003 1980-2003 1980-2003 1980-2003 1980-2003
Co-payments in connection with dentist care 1980-2003 1980-2003 1980-2003 1980-2003 1980-2003 1980-2003 1980-2003 1980-2003
Co.payments for pharmaceuticals 1980-2003 1980-2003 1980-2003 1980-2003 1980-2003 1980-2003 1980-2003 1980-2003
Reimbursement of hospitals 1980-2003 1980-2003 1980-2003 1980-2003 1980-2003 1980-2003 1980-2003 1980-2003
(global budget, fee-for-service, per diem, per discharge)
Reimbursement of physicians in hospitals 1980-2003 1980-2003 1980-2003 1980-2003 1980-2003 1980-2003 1980-2003 1980-2003
(fee-for-service, fixed salary)
Reimbursement of general practitioner 1980-2003 1980-2003 1980-2003 1980-2003 1980-2003 1980-2003 1980-2003 1980-2003
(fee-for-service, salary, capitation)
Reimbursement of specialists 1980-2003 1980-2003 1980-2003 1980-2003 1980-2003 1980-2003 1980-2003 1980-2003
(fee-for-service, salary, capitation)
Reimbursement of dentists 1980-2003 1980-2003 1980-2003 1980-2003 1980-2003 1980-2003 1980-2003 1980-2003
(fee-for-service, salary, capitation)
Overall ceiling of hospital expenditure 1980-2003 1980-2003
FRAMEWORK CONDITIONS
Gross domestic product per capita, US$ PPP female labour force participation (18-65?)
unemployment rate in % of labor force 1980-2002 1980-2001 1980-2002 1980-2002 1980-2002 1980-2000 1980-2002 1980-2000
Sources: EUROSTAT
OECD health Data 2004, Version 1
European health for all database, WHO Regional Office for Europe, Copenhagen, Denmark. Own created variables based on literatur review
1980-2002
UK
Italy Luxembourg Netherlands Portugal Spain Sweden
Ireland
Table 4. Continued
Countries
Variable HEALTH CARE EXPENDITURE
HCE US$ PPP (in million) 2001 1990-2002 1992-95,98-2001 1991-2002 1999-2001 HCE US$ PPP per capita 2001 1990-2002 1992-95,98-2001 1991-2002 1999-2001 Public expenditure US$ PPP (in million) 2001 1990-2002 1998-2001 1991-2002 1999-2001 Public expenditure US$ PPP per capita 2001 1990-2002 1998-2001 1991-2002 1999-2001 Public expenditure as % of total HCE (US$ PPP per capita) 1980-2001 1980,85,89-2002 1996-2002 1991-2002 1990-2002 1987-2002 1999-2002 Private payment as % of total HCE 1980,85,89-2002 1991-2002
Out-of-pocket payments (household) as % of total HCE 1990-2002 1991-2002 Private insurance as % of total HCE 1998-2002 All other privat funds as % of total HCE 1998-2002 DEMAND FACTORS
Population
total population at 1. January 1980-2002
foreigners as share of total population 1992-2001 1994-97,99-2001 age-composition as share of total
0-5,6-19,20-34,35-49,50-64,65-74,75-84,85+
life expectancy at birth 1999-2001 1980-84.86-2002 1981-82,85-2002 1980-2002 1980-2002 1980-2002 1980-2002 male 1999-2001 1980-84.86-2002 1981-82,85-2002 1980-2002 1980-2002 1980-2002 1980-2002 female 1999-2001 1980-84.86-2002 1981-82,85-2002 1980-2002 1980-2002 1980-2002 1980-2002 life expectancy at 65 1999-2001 1986-2002 1981-82,85-2002 1980-2002 1980-2002 1980-2002 1980-2002 male 1999-2001 1986-2002 1981-82,85-2002 1980-2002 1980-2002 1980-2002 1980-2002 female 1999-2001 1986-2002 1981-82,85-2002 1980-2002 1980-2002 1980-2002 1980-2002 total fertility rate 1980-2001 1980-2002 1980-2002 1980,83,89-2002 1980,85-2002 1980-2002 1985-2002 migration per 1000 inhabitants
crude death rate per 1000 population 1999-2001 1980-84,86-2002 1981-82,85-2002 1981-2002 1980-2002 Other demand factors
health status (share of people in bad health)
health behaviour: alcohol consumption 1992-2001 1984-90,92,95-2001 1988-2001 health behaviour: tobacco consumption 1993-98 1995-96 1980-97,99-2000 1995-2000 1980-83 education level - attainment ISCED 0/1/2 1993-2002 1995-2002
education level - attainment ISCED 3/4 1993-2002 1995-2002 education level - attainment ISCED 5B 1999-2002 education level - attainment ISCED 5A/6 1993-2002 1995-2002 Utilisation of health care services
doctor's consultation per capita 1980-2002 1993-2002 SUPPLY FACTORS
Supply of health care services
physicians per 1 000 inhabitants 1980-2001 1994-2002 1980,85-2002 1980-2002 1980,85-2002 1980-2002 1981-82,84,87-93,97-2000,02 physicians per 100 hospital beds 1980-2001 1980-2002 1980,85-2002 1981-83,85-99,2002 1980,1985-2002 1980-2002 1984,87-89,93,97-2000,02 acute care beds per 1 000 inhabitants 1980-2001 1984-2000 1980,85-2002 1980-2002 1998-2002 1992-2002 1997-2002 acute care occupancy rate % of available beds 1980-2001 1980-2002 1980,85-2002 1980-2002 1992-2002 1997-2002 nursing and elderly home beds per 100 000 inhabitants 1980-2002 1996-2002 1980-94,96-2002 1990-2002 2002 MRI (and CT scanners) per million inhabitants 1990-2002 1984-2002
(MRI and) CT scanners per million inhabitants 1990-2002 1980-2002 dialyses per 100 000 inhabitants 1980-95 1980-96
1990-95,97-2001 1990-95,97-2001 1990-95,97-2001
1980,85,89-2003 1980,85,90-2003
1980,85,90-2003
1990-95,97-2001
1980-2001
1980-2002
1980-2001 1989,2000-03
1980,85,90-2003 2000-2002
Estonia Hungary
1980/84,1985/89,1990/94,1995/99,2000-02
Latvia Lithuania Malta Cyprus Czech Republic
1980-2003
Table 4. Continued
Countries
Variable
HEALTH CARE SYSTEM
Organisational structure
Health care system (public contract, public integrated, mixed) 1980-2003 1980-2003 1980-2003 1980-2003 1980-2003 1980-2003 1980-2003 Gatekeeper to non-acute hospital treatment or specialist 1980-2003 1980-2003 1998-2003 1992-2003 1992-2003 1990-2003 1980-2003
Free choice GP or family doctor 1980-2003 1993-2003 1992-2003 1992-2003 1980-2003 1991-2003 1980-2003
Free choice of specialists 1980-2003 1993-2003 1992-2003 1992-2003 1980-2003 1991-2003 1980-2003
Free choice of hospitals 1980-2003 1993-2003 1992-2003 1992-2003 1992-2003 1991-2003 1980-2003
Free choice of dentists 1980-2003 1993-2003 1992-2003 1992-2003 1991-2003 1991-2003 1980-2003
Waiting lists for specialist care 1980-2003 1980-2003 1992-2003 1991-2003 1991-2003 1991-2003 1980-2003
waiting lists for surgeries in hospitals 1980-2003 1980-2003 1992-2003 1990-2003 1991-2003 1991-2003 1980-2003
Financing the health care system
Population covered by public health system % of total population 1980-2002 1980-2002
Multiple or single source financing system 1980-2003 1980-2003 1980-2003 1980-2003 1980-2003 1980-2003 1980-2003 population covered by privates health insurance 1980-2003 1993-2003 1993-2003 1992-2003 n.a. 1991-2003 n.a. Co-payment in connection with GP visits 1980-2003 1980-2003 1980-2003 1980-2003 1980-2003 1980-2003 1980-2003 Co-payment in connection with specialists visits 1980-2003 1980-2003 1980-2003 1980-2003 1980-2003 1980-2003 1980-2003 Co-payment in connection with hospital admission 1980-2003 1980-2003 1980-2003 1980-2003 1980-2003 1980-2003 1980-2003 Co-payments in connection with dentist care 1980-2003 1980-2003 1980-2003 1980-2003 1980-2003 1980-2003 1980-2003
Co.payments for pharmaceuticals 1980-2003 1980-2003 1980-2003 1980-2003 1980-2003 1980-2003 1980-2003
Reimbursement of hospitals 1980-2003 1980-2003 1980-2003 1980-2003 1980-2003 1980-2003 1980-2003
(global budget, fee-for-service, per diem, per discharge)
Reimbursement of physicians in hospitals 1980-2003 1980-2003 1980-2003 1980-2003 1980-2003 1980-2003 1980-2003 (fee-for-service, fixed salary)
Reimbursement of general practitioner 1980-2003 1993-2003 1992-2003 1980-2003 1980-2003 1980-2003 1980-2003
(fee-for-service, salary, capitation)
Reimbursement of specialists 1980-2003 1993-2003 1992-2003 1980-2003 1980-2003 1980-2003 1980-2003
(fee-for-service, salary, capitation)
Reimbursement of dentists 1980-2003 1993-2003 1992-2003 1980-2003 1980-2003 1991-2003 1980-2003
(fee-for-service, salary, capitation)
Overall ceiling of hospital expenditure 1992-2003 1990-2003 1991-2003 1980-2003
FRAMEWORK CONDITIONS
Gross domestic product per capita, US$ PPP female labour force participation (18-65?)
unemployment rate in % of labor force 1980-2001 1990-2002 1989-2002 1990-2002 1992-2002 1991-2002 1983,85-2002
Sources: EUROSTAT
OECD health Data 2004, Version 1
European health for all database, WHO Regional Office for Europe, Copenhagen, Denmark. Own created variables based on literatur review
Table 4. Continued
Countries
Variable HEALTH CARE EXPENDITURE
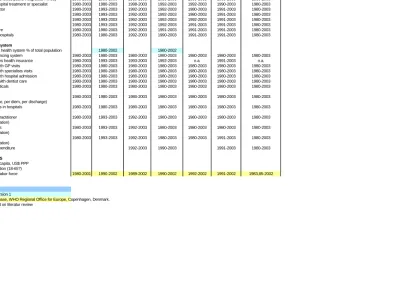
HCE US$ PPP (in m illion) 1990-2002 1997-2002 1989-2001 1988-1994 1988-90,92-2001 1980-2000 HCE US$ PPP per capita 1990-2002 1997-2002 1989-2001 1988-1994 1988-90,92-2001 1980-2000 Public expenditure US$ PPP (in m illion) 1990-2002 1997-2002 1989-2001 1988-1994 1988-90,92-2001 1980,84-2000 Public expenditure US$ PPP per capita 1990-2002 1997-2002 1989-2001 1988-1994 1988-90,92-2001 1980,84-2000 Public expenditure as % of total HCE (US$ PPP per capita) 1990-2002 1997-2002 1980,85-2001 1988-1994 1985-2001 1980,84-2000 Private paym ent as % of total HCE 1990-2002 1997-2002 1980,84-2000 Out-of-pocket payments (household) as % of total HCE 1990-2002 1997-2002 1992-96,99-2000 Private insurance as % of total HCE 1996-98 1984-87,91,94,99-2000
All other privat funds as % of total HCE 1999-2000
DEMAND FACTORS
Population
total population at 1. January 1985-2003
foreigners as share of total population 1999 1993-2001 age-composition as share of total
0-5,6-19,20-34,35-49,50-64,65-74,75-84,85+
life expectancy at birth 1980-2002 1980,82,84-2002 1985-2002 1980-2002 1980-2002 1980-2001 male 1980-2002 1980,82,84-2002 1985-2002 1980-2002 1980-2002 1980-99 female 1980-2002 1980,82,84-2002 1985-2002 1980-2002 1980-2002 1980-99 life expectancy at 65 1980-2002 1986-2002 1985-2002 1980-2002 1980-2002
male 1980-2002 1986-2002 1985-2002 1980-2002 1980-2002 female 1980-2002 1986-2002 1985-2002 1980-2002 1980-2002
total fertility rate 1980,83,89-2001 1980-2002 1980,85,87-2002 1980-81,83-2002 1980,83,85-2002 1980-2002 migration per 1000 inhabitants
crude death rate per 1000 population 1980-2002 1986-2002 1985-2002 1980,85,89-90,92,94-98 Other demand factors
health status (share of people in bad health)
health behaviour: alcohol consumption 1981-2001
health behaviour: tobacco consumption 1980-2000 1993-2000 1996-2000 1980-2000 1991-97 1980-98 education level - attainment ISCED 0/1/2 1994-2002 1996-2002 1990-2002 education level - attainment ISCED 3/4 1994-2002 1996-2002 1990-2002 education level - attainment ISCED 5B 1994-96 1996-2002
education level - attainment ISCED 5A/6 1994-2002 1996-2002 1991-2002 Utilisation of health care services
doctor's consultation per capita 1980-2002 1993-2002 1980-81,92-2002 SUPPLY FACTORS
Supply of health care services
physicians per 1 000 inhabitants 1980-2002 1980,83,84-95,98-2002 1980,82,84-2002 1980-2002 1980-2002 1980-2002 physicians per 100 hospital beds 1985-2001 1980,82,84-95,98-2002 1980,82,84-2002 1980-2002 1980-82,84-2002 1980-2001 acute care beds per 1 000 inhabitants 1980,84-2002 1985-2002 1980,85-2002 1996 1980-2002 acute care occupancy rate % of available beds 1980,84-2002 1995-2002 1980,85-2002 1995-96 1981-2002 nursing and elderly home beds per 100 000 inhabitants 1996-2002 MRI (and CT scanners) per million inhabitants 1990-97 1994-2002 1995-96,2001-02 (MRI and) CT scanners per m illion inhabitants 1980-97 1980-2002 1989-90,93-2002
dialyses per 100 000 inhabitants 1994-2002 1995-2002
Bulgaria Turkey
Poland
1980-2003
1980/84, 1985/89, 1990/94, 1995/99, 2000-02 1980,85,90-2003
1980-2003
Romania
1980-81,85-86,90-2003 Slovakia Slovenia
1985-2003
1980/84,1985/89,1990/94,1995/99,2000-02
1980-2001
1980,85,90-2002 1985,90-2003
Table 4. Continued
Countries
Variable HEALTH CARE SYSTEM
Organisational structure
Health care system (public contract, public integrated, mixed) 1980-2003 1980-2003 1980-2003 1980-2003 1980-2003 1980-2003 Gatekeeper to non-acute hospital treatment or specialist 1990-2003 1994-2003 1992-2003 1980-2003 1994-2003 1980-2003 Free choice GP or family doctor 1990-2003 1993-2003 1992-2003 1980-2003 1980-2003 1980-2003 Free choice of specialists 1990-2003 1993-2003 1992-2003 1980-2003 1980-2003 1980-2003 Free choice of hospitals 1990-2003 1993-2003 1992-2003 1980-2003 1980-2003 1980-2003 Free choice of dentists 1990-2003 1993-2003 1992-2003 1980-2003 1980-2003 1980-2003 Waiting lists for specialist care 1980-2003 1993-2003 1992-2003 1992-2003 1980-2003 1980-2003 waiting lists for surgeries in hospitals 1980-2003 1993-2003 1992-2003 1992-2003 1980-2003 1980-2003 Financing the health care system
Population covered by public health system % of total population 1994-2002 1980-90,93-97 Multiple or single source financing system 1980-2003 1980-2003 1980-2003 1980-2003 1980-2003 1980-2003 population covered by privates health insurance 1990-2003 1993-2003 1993-2003 1999-2003 1998-2003 1980-2003 Co-payment in connection with GP visits 1980-2003 1980-2003 1980-2003 1980-2003 1980-2003 1980-2003 Co-payment in connection with specialists visits 1980-2003 1980-2003 1980-2003 1980-2003 1980-2003 1980-2003 Co-payment in connection with hospital admission 1980-2003 1980-2003 1980-2003 1980-2003 1980-2003 1980-2003 Co-payments in connection with dentist care 1980-2003 1980-2003 1980-2003 1980-2003 1980-2003 1980-2003 Co.payments for pharmaceuticals 1980-2003 1980-2003 1980-2003 1980-2003 1980-2003 1980-2003 Reimbursement of hospitals 1980-2003 1980-2003 1980-2003 1980-2003 1980-2003 1980-2003 (global budget, fee-for-service, per diem, per discharge)
Reimbursement of physicians in hospitals 1980-2003 1980-2003 1980-2003 1980-2003 1980-2003 1980-2003 (fee-for-service, fixed salary)
Reimbursement of general practitioner 1980-2003 1994-2003 1980-2003 1980-2003 1980-2003 1980-2003 (fee-for-service, salary, capitation)
Reimbursement of specialists 1980-2003 1980-2003 1980-2003 1980-2003 1980-2003 1980-2003 (fee-for-service, salary, capitation)
Reimbursement of dentists 1980-2003 1980-2003 1980-2003 1980-2003 1980-2003 1980-2003 (fee-for-service, salary, capitation)
Overall ceiling of hospital expenditure 1993-2003 1992-2003 1980-2003 1980-2003 FRAMEWORK CONDITIONS
Gross domestic product per capita, US$ PPP female labour force participation (18-65?)
unemployment rate in % of labor force 1990-2001 1990-2002 1980,82,84-2001 1990-2002 1990-2002 1982-2002 Sources:
EUROSTAT
OECD health Data 2004, Version 1
European health for all database, WHO Regional Office for Europe, Copenhagen, Denmark. Own created variables based on literatur review
3 Statistical
overview
3.1 Health care expenditure
In $US PPP, the EU-15 member states have spent on average $2,400 for health care per capita in 2002, while the new member states have spent only $800 (Figure 2). Across the countries the range of health care expenditure is high. Luxembourg showed the highest amount of health care expenditure per capita (around $3,100), followed by Germany with $2,800, while the candidate countries Turkey and Romania with $450 and $275 respectively showed the lowest expenditure on health care per capita. Thus, the health expenditure per capita in Germany was 10 times that of Romania.
Figure 2. Health care expenditure per capita in 2002 ($US PPP)
Throughout the EU-15 health care expenditure per capita has increased, but the higher end of it has always been realised by Germany and the lower end by Portugal (Figure 3). But in the last four years Luxembourg has overtaken Germany. Health care expenditure increased 6.4 times in Portugal and 3 times in Sweden between 1980 and 2002. The bandwidth across the countries has expanded in the last two decades. In 1980 the health care expenditure per capita in Germany was $560 higher than in Portugal; in 2002 the difference was $1100. Nevertheless, in 1980 Germany spent more than three times the amount on health care as Portugal, but in 2002 this figure had reduced to only 1.6 times.
Germany also spent the highest share of national income (GDP) on health care expenditure – 10.9% in 2002 – while Romania only spent 4.2% (Figure 4). The EU-15 spent on average 9% of GDP on health care in 2002, while the new member states spent 6.4%. The proportion of GDP spent on health care has on average increased in the last decade in the EU-15 (+0.7 percentage points) as well as in the new member states (+0.6 percentage points). The proportion of GDP spent on health care increased in all countries with the exceptions of Finland, Luxembourg, Poland and Lithuania. Finland experienced the greatest decline, of around 2 percentage points between 1992 and 2002. In the 1980s an increase in the share of GDP spent on health care could also be observed in the EU-15 on average, but to a more moderate degree (Figure 5). Since the beginning of the 1990s the development has accelerated. The growth rate in the 1990s was 1.5
0 500 1000 1500 2000 2500 3000 3500 Lux embou rg Germ any Fran ce Neth erla nds Denm ark Swed
en Belgi
um Irelan
d EU 15Aust
ria Italy
Unit ed K
ingd om Finla nd Gree ce Por tuga l Mal ta Spain Slo veni a Cypr us Czec h Re pub lic Hunga ry NM S 1
times higher than in the 1980s. A strong dynamic can also be observed in the new member states at the beginning of the 1990s, but between 1994 and 2000 the proportion of GDP spent on health care was more or less the same, and in the last two years the share of GDP spent on health care has again increased.
Figure 3. Development of health care expenditure per capita in 1980-2003 in the EU-15 ($US
PPP)
Figure 4. Health care expenditure as a percentage of GDP
0 500 1000 1500 2000 2500 3000 3500
1980 1981 1982 1983 1984 1985 1986 1987 1988 1989 1990 1991 1992 1993 1994 1995 1996 1997 1998 1999 2000 2001 2002
Austria Belgium Denmark Finland France
Germany Greece Ireland Italy Luxembourg
Netherlands Portugal Spain Sweden United Kingdom
0 2 4 6 8 10 12 Germ any Gree ce Fran ce Mal ta Neth erlan ds Por tuga l
Swed en
Belgiu m
EU 1 5
Denm ark Italy
Slov enia Hung ary Hung ary Uni ted K
ingd om Aus tria Spai n Irelan d Cze ch R
epub lic Finla nd Turk ey NMS Cypru s Luxe mbour g
Polan d
Slov ak R