0022-538X/06/$08.00⫹0 doi:10.1128/JVI.00554-06
Copyright © 2006, American Society for Microbiology. All Rights Reserved.
Suppression of the Interferon-Mediated Innate Immune Response
by Pseudorabies Virus
Alla Brukman and L. W. Enquist*
Department of Molecular Biology, Princeton University, Princeton, New Jersey 08544
Received 16 March 2006/Accepted 11 April 2006
Pseudorabies virus (PRV) is an alphaherpesvirus related to the human pathogens herpes simplex virus type 1 (HSV-1) and varicella-zoster virus. PRV is capable of infecting and killing a wide variety of mammals. How it avoids innate immune defenses in so many hosts is not understood. While the anti-interferon (IFN) strategies of HSV-1 have been studied, little is known about how PRV evades the IFN-mediated immune response. In this study, we determined if wild-type PRV infection can overcome the establishment of a beta interferon
(IFN-)-induced antiviral state in primary rat fibroblasts. Using microarray technology, we found that the expres-sion of a subset of genes normally induced by IFN- in these cells was not induced when the cells were simultaneously infected with a wild-type PRV strain. Expression of transcripts associated with major histo-compatibility complex class I antigen presentation and NK cell activation was reduced, while transcripts associated with inflammation either were unaffected or were induced by viral infection. This suppression of IFN-stimulated gene expression occurred because IFN signal transduction, in particular the phosphorylation of STAT1, became less effective in PRV-infected cells. At least one virion-associated protein is involved in inhibition of STAT1 tyrosine phosphorylation. This ability to disarm the IFN-response offers an explanation for the uniform lethality of virulent PRV infection of nonnatural hosts.
Pseudorabies virus (PRV) is a swine alphaherpesvirus re-lated to the human pathogens herpes simplex virus type 1 (HSV-1) and HSV-2 and varicella-zoster virus (30). PRV has a broad host range, infecting most mammals except higher-order primates. Wild-type PRV infection causes primarily respira-tory and reproductive disease with low mortality in its natural host, the adult pig. Infection of nonnatural hosts leads to neu-rological symptoms and is invariably fatal. Two explanations for the high mortality of nonnatural hosts have been proposed: either the immune system fails to control the infection and viral replication destroys cells and tissues or the immune sys-tem responds too strongly and a syssys-temic inflammatory re-sponse overwhelms the host (2). The interferon (IFN)-medi-ated innate immune system is the front line of host defense against viral infections (34, 35). The IFNs are a family of secreted cytokines involved in establishing an antiviral state in cells. Type I (alpha and beta) IFNs (IFN-␣ and IFN-) are produced by cells as a direct response to viral infection. After secretion, type I IFN binds to its cognate receptor on the cell surface, and in response to this binding, JAK1 and TYK2 kinases associated with the cytoplasmic portion of the receptor become activated and phosphorylated. The activated kinases, in turn, phosphorylate signal transducer and activator of tran-scription 1 (STAT1) and STAT2 trantran-scription factors. Phos-phorylated STATs form a complex and translocate to the nu-cleus, where they induce the transcription of genes containing IFN response elements in their upstream regulatory se-quences. Many IFN-stimulated gene (ISG) products have di-rect effects on viral transcription and translation, while others
modulate additional facets of the innate and adaptive immune responses.
Because IFNs have potent antiviral properties, viruses have evolved gene products to interfere with all components of the IFN system, including production of IFN, IFN signaling, and the functioning of ISG products (13, 15). HSV-1 interaction with the IFN response has been well studied (21). The HSV-1 proteins␥34.5 and Us11 block the action of double-stranded RNA (dsRNA)-dependent protein kinase (PKR), one of the IFN-induced antiviral enzymes (3, 11, 31). HSV-1 ICP0 pre-vents the transcriptional induction of ISGs (6), and the ICP0 RING domain blocks activated IFN regulatory factor 3 (IRF-3) and IRF-7 (17). JAK and STAT phosphorylation are also inhibited by HSV-1 infection (39). Although PRV and HSV-1 are members of the same virus family, they are distantly related to each other at the sequence level (19). For example, the PRV genome lacks homologs to either ␥34.5 or Us11. Furthermore, while PRV EP0 is considered a homolog of HSV-1 ICP0 by virtue of its location in the genome and its activation of gene expression, crucial differences exist between the two genes in terms of temporal expression and sequence similarity (27, 30). Thus, the precise mechanism by which PRV circumvents the IFN response remains unknown. It is likely that PRV somehow evades the IFN response, since it can establish a productive infection in an immunocompetent host. PRV does not carry the same anti-IFN genes as HSV-1, and thus, studying PRV may uncover novel methods of blocking the antiviral response. These mechanisms are likely to be shared by varicella-zoster virus, a human pathogen whose ge-nome is more similar to that of PRV than HSV-1 (20).
The objective of this study was to determine the effects of PRV infection on the establishment of an IFN-induced anti-viral state in rodent cells. The results show that the expression of a subset of genes induced by IFN-is reduced when wild-* Corresponding author. Mailing address: Department of Molecular
Biology, Princeton University, Princeton, NJ 08544. Phone: (609) 258-2415. Fax: (609) 258-1035. E-mail: lenquist@princeton.edu.
6345
on November 8, 2019 by guest
http://jvi.asm.org/
type PRV infects the cells at the same time. Wild-type PRV infection also blocks the IFN-induced phosphorylation of STAT1, and it appears that one or more virion-associated proteins are responsible for this inhibition.
MATERIALS AND METHODS
Cells, viruses, and reagents.PK15 (porcine kidney) cells and rat embryonic fibroblast (REF) cells were maintained in Dulbecco’s modified Eagle medium supplemented with 10% fetal bovine serum. REF cells were isolated as described previously (33). Viral infections were carried out in Dulbecco’s modified Eagle medium supplemented with 2% fetal bovine serum unless otherwise specified. PRV Becker (PRV Be) is a virulent laboratory strain (29), and PRV Bartha (PRV Ba) is an attenuated vaccine strain (18). PRV EP0-1 was constructed by C. Paulus (University of Regensburg, Regensburg, Germany) and carries an ampi-cillin resistance gene in place of the EP0 open reading frame. Rat IFN-
(rIFN-) (PBL Biomedical Laboratories) was used at a final concentration of 1,000 U/ml. Cycloheximide (CHX) (Sigma) and phosphonoacetic acid (PAA) (Sigma) were added to the cells at final concentrations of 100g/ml and 400
g/ml, respectively. The cells were treated with CHX or PAA for 30 min prior to infection. The chemicals were maintained in the medium both during and after the viral-inoculum adsorption.
Microarray experiments.Passage 12 REF cells were grown to confluence and then growth arrested by maintaining them in the same (spent) medium for 10 days. All subsequent infections and treatments were carried out in spent me-dium. Growth-arrested fibroblasts were used to increase the reproducibility of the microarray results among replicate samples (33). PRV Be virions were purified as described previously (33). Cells were infected at a multiplicity of infection (MOI) of 5 PFU/cell. Mock-infected cells were treated with an equiv-alent volume of phosphate-buffered saline (PBS) with 2 mg/ml aprotinin and 1 mM EDTA. After 1 h of adsorption, the viral inocula were replaced with warm spent medium. IFN-was maintained in the medium both during and after the viral adsorption period. Mock-IFN-treated cells were treated with an equivalent volume of 0.1% bovine serum albumin (BSA) in PBS. At specified time points, the medium was removed and the cells were lysed with TRIzol (Invitrogen). Each condition was replicated in triplicate for each time point.
Total RNA was isolated from TRIzol according to the manufacturer’s instruc-tions, and cDNA was synthesized according to the Affymetrix GeneChip Expres-sion Analysis technical manual. cDNA was used as a template for the synthesis of biotin-labeled cRNA. The cRNA targets were hybridized to Affymetrix RGU34A microarrays. Subsequent staining and washing was done in GeneChip fluidics stations using the EukGE-WS2 v4 protocol defined in Microarray Suite 5.0 (Affymetrix). Finally, the microarrays were scanned with a GeneChip scanner system (Agilent).
The expression data were initially subjected to global scaling in Microarray Suite 5.0 with a target intensity of 150. The metrics files were then imported into GeneSpring (Silicon Genetics). The values for the experimental conditions were normalized to the average values for the mock-infected and mock-treated values for the matched time point. The data were then filtered to retain only the probe sets that were present or marginal under all conditions and those whose values varied from the average mock value with a maximumttestPvalue of 0.05 for at least one experimental condition. Any genes represented by more than one probe set on the microarray were removed during the subsequent classification of genes, and only the highest value is presented. All primary data can be accessed via the Princeton University MicroArray database (http://puma .princeton.edu/).
Real-time PCR.cDNAs prepared for microarray analysis were used as tem-plates for real-time PCRs. Primers were designed with PrimerExpress 2.0 soft-ware (ABI). The 18S rRNA transcript in each sample was used as a reference gene for each gene measured. Primers (100 nM final concentration) and 10-fold dilutions of templates were combined with SYBR Green PCR master mix (ABI). SYBR Green fluorescence was monitored over 40 cycles of PCR with a PRISM 7900HT sequence detection system (ABI). Relative expression levels for each gene were quantified using the standard-curve method described in ABI user bulletin 2 (http://docs.appliedbiosystems.com/pebiodocs/04303859.pdf).
Western blot analysis.REF cells confluent for at least 3 days were either mock infected or infected at a high MOI (⬎10). At the time points indicated, rIFN- was added to the medium, and 30 min later, the cells were washed and harvested in PBS. The cells were then resuspended and lysed by boiling them in denaturing buffer (1% sodium dodecyl sulfate, 50 mM Tris-Cl, pH 7.4, 5 mM EDTA, 1 mM dithiothreitol). The lysates were then diluted 1:1 with nondenaturing buffer (1% Triton X-100, 50 mM Tris-Cl, pH 7.4, 5 mM EDTA, 300 mM NaCl, 1 U/ml
DNase I supplemented with protease inhibitors [Roche] and phosphatase inhib-itors [Calbiochem]). Protein concentrations were measured with a bicinchoninic acid protein assay kit (Pierce). Equivalent amounts for each sample were sepa-rated by sodium dodecyl sulfate-polyacrylamide gel electrophoresis (12.5% gel). Proteins were electrotransferred to nitrocellulose membranes and blocked in Tris-buffered saline (TBS) with 0.1% Tween 20 and 5% milk for 1 h. Primary antibodies were diluted in TBS with 0.1% Tween 20 and 5% BSA and added to the membranes overnight at 4°C. Antibodies to the following proteins were used at these dilutions: actin, 1:5,000 (A5441; Sigma); STAT1, 1:1,000 (sc-346; Santa Cruz Biotechnology); and pSTAT1, 1:500 (971; Cell Signaling Technology). Peroxidase-labeled secondary antibodies (KPL) were used at a dilution of 1:10,000. All washes were done in TBS with 0.1% Tween 20. Proteins were visualized with the ECL Plus Western blotting detection system (GE Healthcare) and quantitated with a Molecular Dynamics Storm 860 phosphorimager and ImageQuant TL software (GE Healthcare). STAT1 and pSTAT1 protein levels were normalized to actin levels for each sample.
Indirect immunofluorescence.REF cells were grown on glass coverslips and fixed/permeabilized with 100% methanol (⫺20°C) for 10 min. The cells were quenched with TBS with 0.1% sodium borohydride for 5 min and treated with primary antibodies diluted in TBS with 1% BSA overnight at 4°C. The antibodies were used at the following dilutions: anti-pSTAT1, 1:150; anti-gE, 1:250 (1/14 [7]) and anti-gB, 1:800 (M2 [9]). The cells were incubated with secondary Alexa fluorophores diluted 1:500 and Hoechst stain (Molecular Probes) in TBS with 0.1% BSA. All washes were done with TBS. The coverslips were mounted with Aqua PolyMount (Polysciences, Inc.) and visualized with a Zeiss LSM 510 confocal microscope.
RESULTS
[image:2.585.313.531.68.214.2]The antiviral effects of IFN-depend on the timing of IFN addition relative to infection.We determined if PRV infection could overcome the establishment of an antiviral state when IFN and the virus were added to cells concurrently. Thus, rIFN- was added to REF cell monolayers at various times pre- and postinfection with PRV Be. Viral yields 24 h postin-fection (p.i.) were measured on PK15 cells and compared to those from untreated cells (Fig. 1). IFN-was chosen for these assays because HSV-1 has been shown to be more sensitive to IFN- than to most IFN-␣s (10, 37). Viral yields decreased about 1,000-fold when cells were pretreated with rIFN- for 24 h prior to infection. The reduction in yield decreased to FIG. 1. The effect of rIFN-on PRV Be replication depends on the timing of IFN addition relative to viral infection. REF cells were treated with rat IFN-(1,000 U/ml) 24 h prior to the addition of the viral inoculum, 6 h prior to the addition of the viral inoculum, or 1 h after the addition of the viral inoculum, or the cells were left untreated and infected at 1 PFU/cell. In all cases, virus was collected 24 h p.i., and the viral yield was determined by plaque assay. Each titer measure-ment was an average obtained from three independent experimeasure-ments, with the error bars representing the standard deviations.
on November 8, 2019 by guest
http://jvi.asm.org/
about 10-fold when cells were pretreated for only 6 h (Fig. 1). When IFN- was added an hour after infection, there was minimal reduction in the viral titer. These data suggest that PRV Be replication modulates the induction of an antiviral state by exogenous IFN-.
Wild-type PRV infection suppresses the expression of IFN-stimulated genes.Affymetrix RG-U34A microarrays were used to analyze cellular genes whose expression levels changed dur-ing PRV Be infection and IFN treatment of REF cells. Growth-arrested REF cells were either (i) mock treated and mock infected, (ii) treated with rIFN-, (iii) infected with PRV Be purified virions, or (iv) simultaneously treated with IFN and infected with PRV Be. Total RNA was isolated at 3 and 12 h p.i. and processed for hybridization to the microarrays. The expression data were imported into and analyzed with Gene-Spring software.
As we were interested in the effect of PRV infection on the expression of IFN--stimulated genes, we analyzed mRNAs whose levels were increased threefold or more relative to mock samples by IFN-treatment and by simultaneous IFN- treat-ment and PRV Be infection. At the 3-h time point, the mRNA levels of 52 unique genes were increased by IFN-treatment, and the levels of 42 of those 52 mRNAs were also increased in the IFN--treated and PRV-infected cells (Fig. 2A). At the 12-h time point, the number of genes regulated by IFN- treatment remained steady, with the mRNA levels of 58 genes being increased three fold or more (Fig. 2B). The levels of only 22 of these mRNAs, however, were also increased in the
IFN--treated and PRV-infected cells.
To summarize, 81% of genes induced by IFN-were also induced in infected cells at an early time point, and that num-ber decreased to 38% of genes at a late time point. The levels of gene expression that remained above the threefold cutoff under IFN--treated and PRV-infected conditions often were markedly reduced compared to their levels under IFN- -treated conditions (Tables 1 and 2). We conclude that PRV infection suppresses IFN--stimulated gene expression late in the viral replication cycle. It is also interesting to note that the
levels of most ISGs were not stimulated in the cells that were infected with PRV Be and not treated with IFN- (Tables 1 and 2), as has been shown previously (33).
To validate the microarray analysis, PKR and Mx1, two well-known ISGs, were selected for testing with quantitative real-time reverse transcription (RT)-PCR. The mRNA levels of these genes were tested for various conditions and time points and represented a wide range of expression changes. Of the 11 microarray data points tested using RT-PCR, 8 were confirmed (73%) and 3 were discordant (Table 3). Data points were considered confirmed if both methods of measurement indicated that the transcript level of the gene in question in-creased relative to its level in the mock sample. As has been noted previously (28), RT-PCR data tended to show even larger increases for genes whose transcript levels were highly increased by microarray analysis.
Gene classes and pathways affected by IFN-treatment and PRV infection.Many of the genes activated by IFN-in REF cells at both early and late time points are involved in major histocompatibility complex (MHC) class I antigen presenta-tion. These genes include the MHC class I molecules, protea-some subunits, antigen peptide transporters (Tap1/2), and2
-microglobulin (Table 4). At the 3-h time point, 15 out of the 16 genes associated with the MHC class I system were induced threefold or more in the IFN-treated and PRV-infected cells (Table 4). By the 12-h time point, only 8 out of 21 MHC class I genes remained induced in the IFN-treated and PRV-in-fected cells (Table 4). Many of the genes whose expression levels remained above the threefold cutoff were substantially decreased in expression compared to their levels in IFN- -treated cells. For example, Tap1 levels were induced 27.8-fold in IFN--treated cells and 6.8-fold in IFN-treated and PRV-infected cells (Table 4). None of the MHC class I genes showed increased transcript levels in PRV-infected cells at either time point, suggesting that PRV infection alone does not activate this portion of the immune system.
Genes involved in the complement system were regulated at the late time point. The transcript levels of serine proteases homologous to C1s and C1r precursors were increased only by IFN- treatment, but not under any conditions where PRV replication was present (Table 4). The C1q component, on the other hand, was increased by PRV infection, but not by IFN- treatment.
Best5/viperin and CXC10 are two genes whose expression was induced considerably by IFN-treatment at both early and late time points (Table 4). Their levels remained high in the IFN--treated and PRV-infected samples, and they were also induced in the PRV-infected samples. Both genes are associ-ated with the inflammatory response (24, 26). Other proinflam-matory genes and immunomodulatory genes, such as those encoding interleukin-1 (IL-1) receptor accessory protein, T-cell receptor alpha chain, monocyte differentiation antigen CD14 precursor, and fractalkine precursor, are induced by PRV infection regardless of the presence or absence of IFN- (Table 4).
[image:3.585.70.255.72.252.2]The expression of two IFN regulatory factors (IRFs) is in-duced by IFN- treatment (Table 4). IRF-7 mRNA levels increased at the late time point under all three experimental conditions tested and were not reduced by the presence of PRV Be infection in the IFN--treated and PRV Be-infected FIG. 2. Venn diagrams showing the distribution of probe sets with
levels increased threefold 3 h (A) or 12 h (B) after IFN treatment or concurrent IFN treatment and PRV Be infection.
on November 8, 2019 by guest
http://jvi.asm.org/
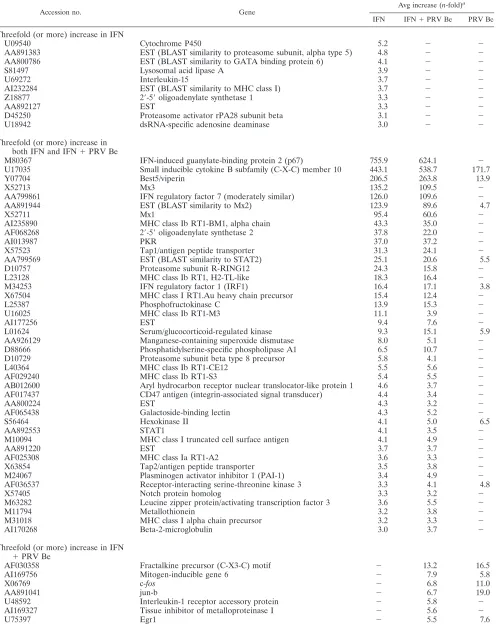
TABLE 1. Host genes induced threefold or more 3 h postinfection with PRV Be and/or treatment with IFN-
Accession no. Gene
Avg increase (n-fold)a IFN IFN⫹PRV Be PRV Be
Threefold (or more) increase in IFN
U09540 Cytochrome P450 5.2 ⫺ ⫺
AA891383 EST (BLAST similarity to proteasome subunit, alpha type 5) 4.8 ⫺ ⫺
AA800786 EST (BLAST similarity to GATA binding protein 6) 4.1 ⫺ ⫺
S81497 Lysosomal acid lipase A 3.9 ⫺ ⫺
U69272 Interleukin-15 3.7 ⫺ ⫺
AI232284 EST (BLAST similarity to MHC class I) 3.7 ⫺ ⫺
Z18877 2⬘-5⬘oligoadenylate synthetase 1 3.3 ⫺ ⫺
AA892127 EST 3.3 ⫺ ⫺
D45250 Proteasome activator rPA28 subunit beta 3.1 ⫺ ⫺
U18942 dsRNA-specific adenosine deaminase 3.0 ⫺ ⫺
Threefold (or more) increase in both IFN and IFN⫹PRV Be
M80367 IFN-induced guanylate-binding protein 2 (p67) 755.9 624.1 ⫺
U17035 Small inducible cytokine B subfamily (C-X-C) member 10 443.1 538.7 171.7
Y07704 Best5/viperin 206.5 263.8 13.9
X52713 Mx3 135.2 109.5 ⫺
AA799861 IFN regulatory factor 7 (moderately similar) 126.0 109.6 ⫺
AA891944 EST (BLAST similarity to Mx2) 123.9 89.6 4.7
X52711 Mx1 95.4 60.6 ⫺
AI235890 MHC class Ib RT1-BM1, alpha chain 43.3 35.0 ⫺
AF068268 2⬘-5⬘oligoadenylate synthetase 2 37.8 22.0 ⫺
AI013987 PKR 37.0 37.2 ⫺
X57523 Tap1/antigen peptide transporter 31.3 24.1 ⫺
AA799569 EST (BLAST similarity to STAT2) 25.1 20.6 5.5
D10757 Proteasome subunit R-RING12 24.3 15.8 ⫺
L23128 MHC class Ib RT1, H2-TL-like 18.3 16.4 ⫺
M34253 IFN regulatory factor 1 (IRF1) 16.4 17.1 3.8
X67504 MHC class I RT1.Au heavy chain precursor 15.4 12.4 ⫺
L25387 Phosphofructokinase C 13.9 15.3 ⫺
U16025 MHC class Ib RT1-M3 11.1 3.9 ⫺
AI177256 EST 9.4 7.6 ⫺
L01624 Serum/glucocorticoid-regulated kinase 9.3 15.1 5.9
AA926129 Manganese-containing superoxide dismutase 8.0 5.1 ⫺
D88666 Phosphatidylserine-specific phospholipase A1 6.5 10.7 ⫺
D10729 Proteasome subunit beta type 8 precursor 5.8 4.1 ⫺
L40364 MHC class Ib RT1-CE12 5.5 5.6 ⫺
AF029240 MHC class Ib RT1-S3 5.4 5.5 ⫺
AB012600 Aryl hydrocarbon receptor nuclear translocator-like protein 1 4.6 3.7 ⫺
AF017437 CD47 antigen (integrin-associated signal transducer) 4.4 3.4 ⫺
AA800224 EST 4.3 3.2 ⫺
AF065438 Galactoside-binding lectin 4.3 5.2 ⫺
S56464 Hexokinase II 4.1 5.0 6.5
AA892553 STAT1 4.1 3.5 ⫺
M10094 MHC class I truncated cell surface antigen 4.1 4.9 ⫺
AA891220 EST 3.7 3.7 ⫺
AF025308 MHC class Ia RT1-A2 3.6 3.3 ⫺
X63854 Tap2/antigen peptide transporter 3.5 3.8 ⫺
M24067 Plasminogen activator inhibitor 1 (PAI-1) 3.4 4.9 ⫺
AF036537 Receptor-interacting serine-threonine kinase 3 3.3 4.1 4.8
X57405 Notch protein homolog 3.3 3.2 ⫺
M63282 Leucine zipper protein/activating transcription factor 3 3.6 5.5 ⫺
M11794 Metallothionein 3.2 3.8 ⫺
M31018 MHC class I alpha chain precursor 3.2 3.3 ⫺
AI170268 Beta-2-microglobulin 3.0 3.7 ⫺
Threefold (or more) increase in IFN
⫹PRV Be
AF030358 Fractalkine precursor (C-X3-C) motif ⫺ 13.2 16.5
AI169756 Mitogen-inducible gene 6 ⫺ 7.9 5.8
X06769 c-fos ⫺ 6.8 11.0
AA891041 jun-b ⫺ 6.7 19.0
U48592 Interleukin-1 receptor accessory protein ⫺ 5.8 ⫺
AI169327 Tissue inhibitor of metalloproteinase I ⫺ 5.6 ⫺
U75397 Egr1 ⫺ 5.5 7.6
Continued on following page
on November 8, 2019 by guest
http://jvi.asm.org/
sample. IRF-1 expression, on the other hand, was more abun-dant at the early time point and was reduced in the presence of PRV Be infection only at the late time point.
The expression of classic antiviral ISGs, such as those en-coding PKR, Mx1/3, and Oas1/2, was strongly induced by IFN-treatment (Table 4). With the exception of PKR, which was induced 3.5-fold at 12 h p.i., none of these transcripts were induced in PRV Be-infected cells at either time point. Tran-script levels for all of the antiviral genes were reduced in cells which were simultaneously IFN- treated and PRV Be in-fected compared to their levels in cells which were only treated with IFN-.
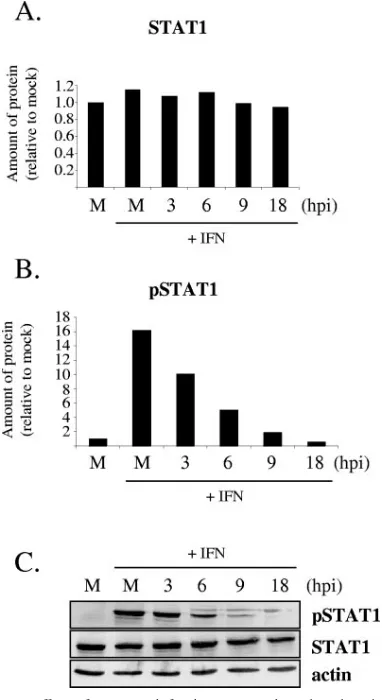
PRV infection suppresses IFN--induced STAT1 tyrosine phosphorylation.One mechanism by which PRV infection can inhibit the expression of a set of ISGs is by modulating the IFN signaling pathway. Therefore, the effect of wild-type PRV in-fection on tyrosine phosphorylation of STAT1 in response to a burst of IFN treatment was analyzed by immunoblotting and immunofluorescence. Monolayers of REF cells were mock in-fected or inin-fected with PRV Be at a high MOI for immuno-blotting or at a low MOI for immunofluorescence. At 3, 6, 9, and 18 h p.i., the cells were treated with rIFN-for 30 min. The cells were subsequently prepared either for immunoblotting or for immunofluorescence for STAT1 and Tyr701-phosphory-lated STAT1 (pSTAT1). As can be seen from protein band quantification and a sample Western blot in Fig. 3A and C, total STAT1 levels did not vary either after IFN treatment of mock-infected cells or through the time course of PRV infec-tion. The levels of pSTAT1 increased after IFN-treatment of mock-infected cells, as expected, but the cells became less responsive to IFN-treatment as PRV replication progressed (Fig. 3B and C). In fact, cells treated with IFN- at 18 h p.i. had lower levels of pSTAT1 than mock-infected cells not treated with IFN- (Fig. 3B). These results were confirmed with immunofluorescence studies. While at 6 h p.i., some in-fected cells (indicated by positive gE staining) still exhibited nuclear pSTAT1, by 9 and 18 h p.i., almost all infected cells did not exhibit positive pSTAT1 staining (Fig. 4). As the infection progressed, the nuclei (Fig. 4, inset) lost green pSTAT1 stain-ing, and the blue Hoechst staining became more obvious.
Classification of the viral gene(s) responsible for suppres-sion of STAT1 phosphorylation.We next determined the tem-poral class of the viral gene(s) necessary for suppression of
IFN-induced STAT1 phosphorylation. CHX, which blocks im-mediate-early, early, and late viral-protein expression, and PAA, which blocks DNA replication and late gene expression, were used in immunofluorescence studies of pSTAT1 localiza-tion. REF cells were infected with PRV Be at a high MOI for 9 h and then treated with IFN- for 30 min. Either CHX or PAA was maintained in the medium before and throughout the infection and IFN treatment. The normal phosphorylation and nuclear translocation of STAT1 in response to IFN treat-ment is unaffected by either CHX or PAA alone (Fig. 5A). Staining for gB was used as a marker for viral infection, be-cause one of the mutant viruses tested (PRV Ba) lacks the gE gene. As expected, CHX treatment prevented gB synthesis in PRV-Be-infected cells (Fig. 5A). PRV Be infection suppressed STAT1 phosphorylation in the presence of CHX, suggesting that de novo protein synthesis is not necessary for this process. PAA treatment of infected cells partially restored the respon-siveness of cells to IFN-treatment, as some nuclear pSTAT1 could be seen, although not at the levels of uninfected cells. This result suggests that the presence of PRV immediate-early and/or early transcripts or proteins increases the phosphoryla-tion of STAT1.
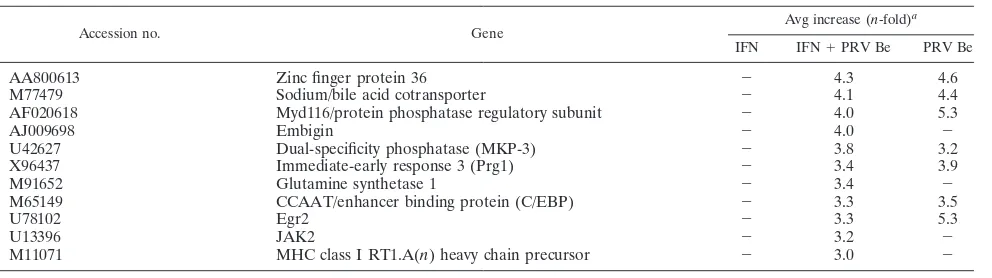
[image:5.585.46.542.77.216.2]An EP0-null mutant (PRV EP0-1) and the attenuated vac-cine strain PRV Ba were tested in this assay to determine if the mutant alleles known for these strains are involved in suppres-sion of STAT1 phosphorylation. The EP0 deletion mutant was selected because the HSV-1 homolog of EP0 (ICP0) has been shown to inhibit the induction of ISGs after viral infection (6). Cells infected with the EP0 deletion mutant for 9 h were unresponsive to IFN-treatment, suggesting that this protein is not required for the inhibition of STAT1 phosphorylation (Fig. 5B). PRV Ba was tested, because rats infected with this strain showed increased expression of IFN-stimulated and proinflammatory gene transcripts in their brains just before death (28). Cells infected with PRV Ba and treated with IFN contained phosphorylated STAT1, but at much lower levels than mock-infected cells (Fig. 5B). In PRV Ba-infected cells, pSTAT1 staining was more diffuse and cytoplasmic than in mock-infected cells, where it was completely nuclear. This re-sult raises the intriguing possibility that the wild-type PRV genome contains several genes that modulate STAT1 signal-ing, with one of them mutated in the PRV Ba genome. TABLE 1—Continued
Accession no. Gene
Avg increase (n-fold)a IFN IFN⫹PRV Be PRV Be
AA800613 Zinc finger protein 36 ⫺ 4.3 4.6
M77479 Sodium/bile acid cotransporter ⫺ 4.1 4.4
AF020618 Myd116/protein phosphatase regulatory subunit ⫺ 4.0 5.3
AJ009698 Embigin ⫺ 4.0 ⫺
U42627 Dual-specificity phosphatase (MKP-3) ⫺ 3.8 3.2
X96437 Immediate-early response 3 (Prg1) ⫺ 3.4 3.9
M91652 Glutamine synthetase 1 ⫺ 3.4 ⫺
M65149 CCAAT/enhancer binding protein (C/EBP) ⫺ 3.3 3.5
U78102 Egr2 ⫺ 3.3 5.3
U13396 JAK2 ⫺ 3.2 ⫺
M11071 MHC class I RT1.A(n) heavy chain precursor ⫺ 3.0 ⫺
aThe average increase compared to mock-treated cells is indicated for each experimental condition.⫺, not significantly different or absent.
on November 8, 2019 by guest
http://jvi.asm.org/
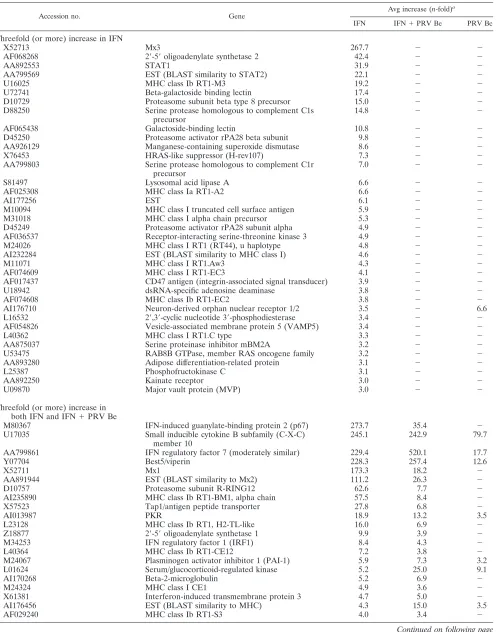
TABLE 2. Host genes induced threefold or more 12 h postinfection with PRV Be and/or treatment with IFNa
Accession no. Gene
Avg increase (n-fold)a
IFN IFN⫹PRV Be PRV Be
Threefold (or more) increase in IFN
X52713 Mx3 267.7 ⫺ ⫺
AF068268 2⬘-5⬘oligoadenylate synthetase 2 42.4 ⫺ ⫺
AA892553 STAT1 31.9 ⫺ ⫺
AA799569 EST (BLAST similarity to STAT2) 22.1 ⫺ ⫺
U16025 MHC class Ib RT1-M3 19.2 ⫺ ⫺
U72741 Beta-galactoside binding lectin 17.4 ⫺ ⫺
D10729 Proteasome subunit beta type 8 precursor 15.0 ⫺ ⫺
D88250 Serine protease homologous to complement C1s precursor
14.8 ⫺ ⫺
AF065438 Galactoside-binding lectin 10.8 ⫺ ⫺
D45250 Proteasome activator rPA28 beta subunit 9.8 ⫺ ⫺
AA926129 Manganese-containing superoxide dismutase 8.6 ⫺ ⫺
X76453 HRAS-like suppressor (H-rev107) 7.3 ⫺ ⫺
AA799803 Serine protease homologous to complement C1r precursor
7.0 ⫺ ⫺
S81497 Lysosomal acid lipase A 6.6 ⫺ ⫺
AF025308 MHC class Ia RT1-A2 6.6 ⫺ ⫺
AI177256 EST 6.1 ⫺ ⫺
M10094 MHC class I truncated cell surface antigen 5.9 ⫺ ⫺
M31018 MHC class I alpha chain precursor 5.3 ⫺ ⫺
D45249 Proteasome activator rPA28 subunit alpha 4.9 ⫺ ⫺
AF036537 Receptor-interacting serine-threonine kinase 3 4.9 ⫺ ⫺
M24026 MHC class I RT1 (RT44), u haplotype 4.8 ⫺ ⫺
AI232284 EST (BLAST similarity to MHC class I) 4.6 ⫺ ⫺
M11071 MHC class I RT1.Aw3 4.3 ⫺ ⫺
AF074609 MHC class I RT1-EC3 4.1 ⫺ ⫺
AF017437 CD47 antigen (integrin-associated signal transducer) 3.9 ⫺ ⫺
U18942 dsRNA-specific adenosine deaminase 3.8 ⫺ ⫺
AF074608 MHC class Ib RT1-EC2 3.8 ⫺ ⫺
AI176710 Neuron-derived orphan nuclear receptor 1/2 3.5 ⫺ 6.6
L16532 2⬘,3⬘-cyclic nucleotide 3⬘-phosphodiesterase 3.4 ⫺ ⫺
AF054826 Vesicle-associated membrane protein 5 (VAMP5) 3.4 ⫺ ⫺
L40362 MHC class I RT1.C type 3.3 ⫺ ⫺
AA875037 Serine proteinase inhibitor mBM2A 3.2 ⫺ ⫺
U53475 RAB8B GTPase, member RAS oncogene family 3.2 ⫺ ⫺
AA893280 Adipose differentiation-related protein 3.1 ⫺ ⫺
L25387 Phosphofructokinase C 3.1 ⫺ ⫺
AA892250 Kainate receptor 3.0 ⫺ ⫺
U09870 Major vault protein (MVP) 3.0 ⫺ ⫺
Threefold (or more) increase in both IFN and IFN⫹PRV Be
M80367 IFN-induced guanylate-binding protein 2 (p67) 273.7 35.4 ⫺
U17035 Small inducible cytokine B subfamily (C-X-C) member 10
245.1 242.9 79.7
AA799861 IFN regulatory factor 7 (moderately similar) 229.4 520.1 17.7
Y07704 Best5/viperin 228.3 257.4 12.6
X52711 Mx1 173.3 18.2 ⫺
AA891944 EST (BLAST similarity to Mx2) 111.2 26.3 ⫺
D10757 Proteasome subunit R-RING12 62.6 7.7 ⫺
AI235890 MHC class Ib RT1-BM1, alpha chain 57.5 8.4 ⫺
X57523 Tap1/antigen peptide transporter 27.8 6.8 ⫺
AI013987 PKR 18.9 13.2 3.5
L23128 MHC class Ib RT1, H2-TL-like 16.0 6.9 ⫺
Z18877 2⬘-5⬘oligoadenylate synthetase 1 9.9 3.9 ⫺
M34253 IFN regulatory factor 1 (IRF1) 8.4 4.3 ⫺
L40364 MHC class Ib RT1-CE12 7.2 3.8 ⫺
M24067 Plasminogen activator inhibitor 1 (PAI-1) 5.9 7.3 3.2
L01624 Serum/glucocorticoid-regulated kinase 5.2 25.0 9.1
AI170268 Beta-2-microglobulin 5.2 6.9 ⫺
M24324 MHC class I CE1 4.9 3.6 ⫺
X61381 Interferon-induced transmembrane protein 3 4.7 5.0 ⫺
AI176456 EST (BLAST similarity to MHC) 4.3 15.0 3.5
AF029240 MHC class Ib RT1-S3 4.0 3.4 ⫺
Continued on following page
on November 8, 2019 by guest
http://jvi.asm.org/
DISCUSSION
[image:7.585.47.541.79.551.2]The effectiveness of rIFN- in reducing wild-type PRV yields in REF cells was correlated with the length of time the cells had been treated with IFN prior to infection. The 1,000-fold drop in PRV Be yields after 24 h of rIFN-pretreatment was not surprising, as IFN- has been shown to be the most effective of the type I IFNs in antagonizing HSV-1 replication (10, 37). The large reduction in viral yield occurred only when the virus entered cells that had been primed by IFN- to respond quickly to infection. When IFN-and the virus bound to a naı¨ve cell simultaneously, PRV replication competed with, and overcame, the cell’s attempt to establish an antiviral state.
TABLE 2—Continued
Accession no. Gene
Avg increase (n-fold)a
IFN IFN⫹PRV Be PRV Be
Threefold (or more) increase in IFN⫹PRV Be
M11794 Metallothionein ⫺ 36.3 4.2
S67722 Cyclooxygenase-2 (COX-2) ⫺ 19.2 17.5
AI102562 EST (BLAST similarity to metallothionein) ⫺ 12.3 ⫺
AI137583 Inhibitor of DNA binding 2 ⫺ 11.8 7.2
U09401 Tenascin C ⫺ 11.7 3.4
U48592 Interleukin-1 receptor accessory protein ⫺ 10.3 ⫺
L11035 T-cell receptor alpha chain ⫺ 8.7 10.3
AA891576 Complement component 1, q subcomponent ⫺ 8.5 9.1
M64711 Endothelin 1 ⫺ 7.7 ⫺
AF000942 Inhibitor of DNA binding 3 ⫺ 6.3 ⫺
L14937 Proprotein convertase subtilisin/kexin type 4 ⫺ 6.3 6.4
U60977 Lipid raft protein flotillin 1 ⫺ 5.9 ⫺
AA891499 Predicted: similar to RIKEN ⫺ 5.9 5.2
X80395 Vesicular acetylcholine transporter (VAChT) ⫺ 5.4 4.5
S98336 Mullerian-inhibiting factor precursor ⫺ 5.2 4.8
AA859519 Predicted: similar to RNA binding protein gene ⫺ 4.9 4.0
X07320 Phosphorylase b kinase, gamma subunit ⫺ 4.7 3.8
S77556 Discoidin domain receptor family, member 1 ⫺ 4.7 4.7
M61875 CD44 antigen, transmembrane glycoprotein ⫺ 4.7 5.2
X91988 STAT5b ⫺ 4.6 3.8
AA944156 B-cell translocation gene 2 ⫺ 4.5 3.7
AA892333 Predicted: tubulin, alpha 6 ⫺ 4.4 6.1
AA800613 Zinc finger protein 36 ⫺ 4.4 ⫺
AI169756 Mitogen-inducible gene 6 ⫺ 4.3 4.1
AA875509 Mdm2 ⫺ 4.3 ⫺
L16764 Heat shock protein 70 ⫺ 4.3 ⫺
L01267 Transcription initiation factor IIF beta subunit ⫺ 4.2 ⫺
AA799406 EST ⫺ 4.2 4.1
X62875 High-mobility group protein Y ⫺ 4.1 ⫺
M33312 Cytochrome P450 ⫺ 4.0 ⫺
X06769 c-fos ⫺ 3.8 ⫺
M32061 Alpha-2B-adrenergic receptor ⫺ 3.8 ⫺
AF087944 Monocyte differentiation antigen CD14 precursor ⫺ 3.7 3.3
AA891751 EST (BLAST similarity to voltage-gated sodium channel) ⫺ 3.7 ⫺
U09361 Tenascin C ⫺ 3.7 ⫺
M63282 Activating transcription factor 3 ⫺ 3.7 ⫺
AI232783 Glutamine synthetase 1 ⫺ 3.7 ⫺
L35558 Neuronal/epithelial high-affinity glutamate transporter ⫺ 3.5 3.8
AF030358 Fractalkine precursor (C-X3-C) motif ⫺ 3.5 9.8
M35270 Alanine-glyoxylate aminotransferase ⫺ 3.4 3.2
AI169327 Tissue inhibitor of metalloproteinase 1 ⫺ 3.4 ⫺
AF061971 Palmitoyl-protein thioesterase 2 ⫺ 3.3 ⫺
AF001417 Kruppel-like transcription factor ⫺ 3.1 ⫺
AI230260 Casein kinase 2 ⫺ 3.1 ⫺
U19866 Activity-regulated cytoskeletal-associated protein (Arc) ⫺ 3.1 ⫺
AF020618 Myd116/protein phosphatase regulatory subunit ⫺ 3.0 ⫺
a
The average increase compared to mock-treated cells is indicated for each experimental condition.⫺, not significantly different or absent.
TABLE 3. Validation of microarray data by real-time PCR
Gene Condition
Increase (n-fold) Microarray RT-PCR
PKR IFN, 3 h 37.0 0.4
IFN⫹PRV Be, 3 h 37.2 13.9
Be, 3 h 1.1 1.3
IFN⫹PRV Be, 12 h 13.2 0.7
Be, 12 h 3.5 0.2
Mx1 IFN, 3 h 95.4 20.0
IFN⫹PRV Be, 3 h 60.6 3,880.0
Be, 3 h 1.6 11.2
IFN, 12 h 173.3 260,000.0
IFN⫹PRV Be, 12 h 18.2 2,600.0
Be, 12 h 1.8 11.0
on November 8, 2019 by guest
http://jvi.asm.org/
[image:7.585.301.542.590.725.2]This result indicated that at least one PRV protein carried in the virion or expressed during infection antagonized the anti-viral effects of IFN-.
Global analysis of rIFN--stimulated gene expression in the presence and absence of PRV Be infection showed that viral replication reduces the levels of many ISG transcripts normally induced by exogenous IFN-, especially at a late time during infection. Many of the genes affected serve to communicate with other players in the innate and adaptive immune re-sponses. For example, presentation of viral antigens by MHC
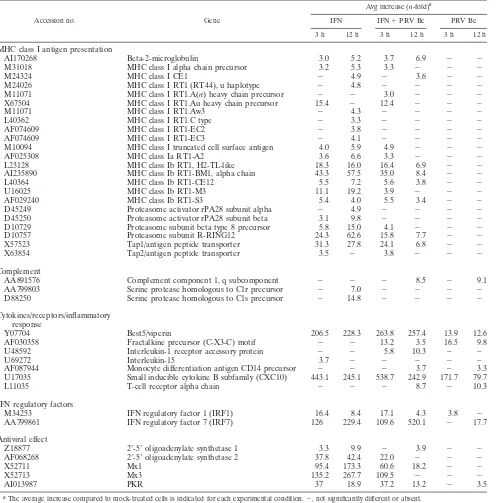
class I molecules to cytotoxic T cells is a crucial component of the host’s antiviral defense (12). The expression of genes as-sociated with MHC class I antigen presentation was reduced in simultaneously IFN--treated and PRV Be-infected cells rel-ative to their levels in IFN--treated cells. NK cells have been shown to be important in controlling persistent HSV-1 infec-tions (38). The levels of IRF-1 and IL-15 mRNAs, factors necessary for the development of NK cells (23), were reduced in the presence of PRV Be infection. In addition to genes involved in communicating with the immune system, expres-TABLE 4. Functional classes/pathways of immune response genes regulated postinfection with PRV Be and/or treatment with IFNa
Accession no. Gene
Avg increase (n-fold)a
IFN IFN⫹PRV Be PRV Be
3 h 12 h 3 h 12 h 3 h 12 h
MHC class I antigen presentation
AI170268 Beta-2-microglobulin 3.0 5.2 3.7 6.9 ⫺ ⫺
M31018 MHC class I alpha chain precursor 3.2 5.3 3.3 ⫺ ⫺ ⫺
M24324 MHC class I CE1 ⫺ 4.9 ⫺ 3.6 ⫺ ⫺
M24026 MHC class I RT1 (RT44), u haplotype ⫺ 4.8 ⫺ ⫺ ⫺ ⫺
M11071 MHC class I RT1.A(n) heavy chain precursor ⫺ ⫺ 3.0 ⫺ ⫺ ⫺
X67504 MHC class I RT1.Au heavy chain precursor 15.4 ⫺ 12.4 ⫺ ⫺ ⫺
M11071 MHC class I RT1.Aw3 ⫺ 4.3 ⫺ ⫺ ⫺ ⫺
L40362 MHC class I RT1.C type ⫺ 3.3 ⫺ ⫺ ⫺ ⫺
AF074609 MHC class I RT1-EC2 ⫺ 3.8 ⫺ ⫺ ⫺ ⫺
AF074609 MHC class I RT1-EC3 ⫺ 4.1 ⫺ ⫺ ⫺ ⫺
M10094 MHC class I truncated cell surface antigen 4.0 5.9 4.9 ⫺ ⫺ ⫺
AF025308 MHC class Ia RT1-A2 3.6 6.6 3.3 ⫺ ⫺ ⫺
L23128 MHC class Ib RT1, H2-TL-like 18.3 16.0 16.4 6.9 ⫺ ⫺
AI235890 MHC class Ib RT1-BM1, alpha chain 43.3 57.5 35.0 8.4 ⫺ ⫺
L40364 MHC class Ib RT1-CE12 5.5 7.2 5.6 3.8 ⫺ ⫺
U16025 MHC class Ib RT1-M3 11.1 19.2 3.9 ⫺ ⫺ ⫺
AF029240 MHC class Ib RT1-S3 5.4 4.0 5.5 3.4 ⫺ ⫺
D45249 Proteasome activator rPA28 subunit alpha ⫺ 4.9 ⫺ ⫺ ⫺ ⫺
D45250 Proteasome activator rPA28 subunit beta 3.1 9.8 ⫺ ⫺ ⫺ ⫺
D10729 Proteasome subunit beta type 8 precursor 5.8 15.0 4.1 ⫺ ⫺ ⫺
D10757 Proteasome subunit R-RING12 24.3 62.6 15.8 7.7 ⫺ ⫺
X57523 Tap1/antigen peptide transporter 31.3 27.8 24.1 6.8 ⫺ ⫺
X63854 Tap2/antigen peptide transporter 3.5 ⫺ 3.8 ⫺ ⫺ ⫺
Complement
AA891576 Complement component 1, q subcomponent ⫺ ⫺ ⫺ 8.5 ⫺ 9.1
AA799803 Serine protease homologous to C1r precursor ⫺ 7.0 ⫺ ⫺ ⫺ ⫺
D88250 Serine protease homologous to C1s precursor ⫺ 14.8 ⫺ ⫺ ⫺ ⫺
Cytokines/receptors/inflammatory response
Y07704 Best5/viperin 206.5 228.3 263.8 257.4 13.9 12.6
AF030358 Fractalkine precursor (C-X3-C) motif ⫺ ⫺ 13.2 3.5 16.5 9.8
U48592 Interleukin-1 receptor accessory protein ⫺ ⫺ 5.8 10.3 ⫺ ⫺
U69272 Interleukin-15 3.7 ⫺ ⫺ ⫺ ⫺ ⫺
AF087944 Monocyte differentiation antigen CD14 precursor ⫺ ⫺ ⫺ 3.7 ⫺ 3.3
U17035 Small inducible cytokine B subfamily (CXC10) 443.1 245.1 538.7 242.9 171.7 79.7
L11035 T-cell receptor alpha chain ⫺ ⫺ ⫺ 8.7 ⫺ 10.3
IFN regulatory factors
M34253 IFN regulatory factor 1 (IRF1) 16.4 8.4 17.1 4.3 3.8 ⫺
AA799861 IFN regulatory factor 7 (IRF7) 126 229.4 109.6 520.1 ⫺ 17.7
Antiviral effect
Z18877 2⬘-5⬘oligoadenylate synthetase 1 3.3 9.9 ⫺ 3.9 ⫺ ⫺
AF068268 2⬘-5⬘oligoadenylate synthetase 2 37.8 42.4 22.0 ⫺ ⫺ ⫺
X52711 Mx1 95.4 173.3 60.6 18.2 ⫺ ⫺
X52713 Mx3 135.2 267.7 109.5 ⫺ ⫺ ⫺
AI013987 PKR 37 18.9 37.2 13.2 ⫺ 3.5
aThe average increase compared to mock-treated cells is indicated for each experimental condition.⫺, not significantly different or absent.
on November 8, 2019 by guest
http://jvi.asm.org/
[image:8.585.46.542.80.583.2]sion of genes that have direct effects on viral-macromolecule synthesis, such as those encoding PKR, OAS, and Mx, was decreased by PRV infection. Furthermore, wild-type PRV in-fection does not induce the expression of most ISGs. Much like HSV-1 replication (22), PRV replication does not stimulate the early stages of an effective antiviral response.
The reduction in ISG levels does not reflect a nonspecific decrease of cellular mRNA levels, as the expression of some genes associated with the immune response remained elevated in simultaneously IFN--treated and PRV Be-infected cells. For example, IRF-7 mRNA levels increased under all experi-mental conditions by 12 h posttreatment of infection. This protein serves to increase the transcription of various IFN-␣ subspecies (16). However, it is possible that because IFN-␣s are not as effective at antagonizing herpesvirus replication (10,
37) or because PRV replication is mostly completed by that time, IRF-7 expression is not reduced by PRV infection. Ex-pression of complement genes is also not decreased uniformly. The levels of serine proteases C1s and C1r, which are detri-mental to viral replication, are increased by IFN-treatment but suppressed by PRV Be replication. The levels of the C1q component, which has been implicated in antibody-dependent enhancement of viral infection (36) and contributes to the inflammation process (8), are not increased by IFN- treat-ment. C1q expression is induced only by PRV Be infection, implying that this protein may be advantageous for PRV rep-lication. Other proinflammatory and immunomodulatory genes, such as those encoding IL-1 receptor accessory protein and monocyte differentiation antigen, were also induced by PRV Be infection, but not by IFN-treatment. CXC10 and best5/viperin genes, which are also associated with the inflam-matory response, were induced strongly by IFN- and re-mained so in infected cells. The fact that the expression of these genes is not suppressed and is sometimes induced by viral infection itself suggests that the inflammatory response is fa-vorable to PRV replication. These data support the hypothesis proposed by Brittle et al. (2) that animals infected with virulent PRV strains die because of an immune response to infection, rather than viral cytopathic effects. Other viruses, such as Sind-bis virus and lymphocytic choriomeningitis virus, have been shown to induce strong, lethal inflammatory responses in ro-dent hosts (5, 14).
Wild-type PRV infection suppresses STAT1 tyrosine phos-phorylation normally induced by IFN- treatment of REF cells. This suppression is not a result of the general deteriora-tion of the cells, since infected REF cells have been shown to remain attached to the plate and remain metabolically active at 8 and 12 h p.i. (33). Similarly, HSV-1-infected cells become unresponsive to IFN treatment (39). One difference is that pSTAT1 becomes imperceptible on immunoblots by 3 h p.i. with HSV-1 compared to 9 h p.i. with PRV Be. This result may reflect the different cells used in the two experiments or, al-ternatively, it is possible that HSV-1 and PRV inhibit STAT1 phosphorylation through different mechanisms. HSV-1 infec-tion increases the mRNA and protein levels of suppressor of cytokine signaling-3 (SOCS3), a cellular inhibitor of the JAK/ STAT pathway (40). While PRV Be infection has not been shown by microarray analysis to increase SOCS3 transcript levels (28, 33), it would be interesting to determine whether SOCS3 protein levels are increased after PRV infection. Other host negative regulators of STAT1 signaling that should be examined for activation by PRV infection include nuclear phosphatase TC45, cytoplasmic phosphatase PTP1B and SH2-containing phosphatases SHP1 and SHP2, PIAS proteins, and other SOCS proteins (1).
[image:9.585.65.256.69.419.2]Experiments to classify the viral gene(s) involved in inhibi-tion of STAT1 phosphorylainhibi-tion indicated that immediate-early, immediate-early, and late gene expression are not necessary for inhibition. However, binding and entry of the virus alone were sufficient for inhibition, which can be confirmed by testing if UV-inactivated PRV Be suppresses STAT1 phosphorylation. This result implicated a tegument protein, or proteins, in reg-ulation of STAT1 phosphorylation. The action of a tegument protein might be expected to become apparent sooner than 6 to 9 h p.i., which is when infected cells became unable to FIG. 3. Effect of PRV Be infection on tyrosine phosphorylation of
STAT1 in REF cells. Cells were either mock infected (M) or infected with PRV Be at a high MOI for various time periods before being stimulated with IFN- for 30 min or left unstimulated. Whole-cell lysates were examined by Western blot analysis with antibodies recog-nizing phosphorylated (Tyr701) STAT1 (pSTAT1), STAT1, and actin. Band intensities were quantified with a phoshorimager and normalized to actin levels for each sample. The amounts of STAT1 (A) and pSTAT1 (B) in the mock-infected, unstimulated, sample were set to 100%. All other measurements are presented relative to that. Each measurement is an average of two separate experiments. A represen-tative Western blot is shown in panel C.
on November 8, 2019 by guest
http://jvi.asm.org/
phosphorylate STAT1. However, it is likely that the viral pro-tein involved does not act on pSTAT1 directly. It may redirect a cellular phosphatase to dephosphorylate pSTAT1, as HSV-1
␥34.5 does, or it may increase the proteasomal degradation of pSTAT1. Considering that transport, dephosphorylation, and ubiquitination of cellular proteins are probably involved, the effect on STAT1 phosphorylation does not occur as soon as tegument proteins enter the cell.
Somewhat surprisingly, blocking viral DNA replication and late gene expression restored a low level of STAT1 phosphory-lation in response to IFN-treatment. It is possible that the expression of immediate-early and early viral genes is sensed by cellular defenses and allows some STAT1 phosphorylation. This result also implies that the viral protein responsible for STAT1 phosphorylation inhibition is a late protein. Perhaps both the protein brought in with the virion and the protein
pSTAT1
gE
Hoechst
Merge
mock
mock
+
IFN
PRV Be
3 hpi
+
IFN
PRV Be
6 hpi
+
IFN
PRV Be
9 hpi
+
IFN
PRV Be
18 hpi
+
IFN
Inset
FIG. 4. Immunofluorescent detection of STAT1 phosphorylation and nuclear translocation in PRV Be-infected REF cells. Cells were either mock-infected or infected with PRV Be at a low MOI for various time periods before being stimulated with IFN-for 30 min or left unstimulated. Representative immunofluorescent images stained with anti-pSTAT1 and anti-gE antibodies and Hoechst DNA stain are shown. Cells outlined in the merged panels are magnified in the inset column. Image acquisition settings were kept constant for all panels.
on November 8, 2019 by guest
http://jvi.asm.org/
newly made during viral replication are necessary for complete inhibition of STAT1 phosphorylation.
The viral protein EP0 was considered as a candidate for STAT1 phosphorylation inhibition because EP0 has been shown to be incorporated in PRV virions (25) and HSV-1 ICP0 inhibits ISG induction. We found that the EP0-null mutant inhibited STAT1 phosphorylation comparably to the wild-type virus. The effect of virion host shutoff protein on STAT1 phos-phorylation should be tested, because the HSV-1 homolog of
this protein has been implicated in the disappearance of JAK1, one of the kinases responsible for phosphorylating STAT1 (4). Cells infected with the attenuated vaccine strain PRV Ba showed a low level of STAT1 phosphorylation in response to IFN-treatment, and the pattern of staining for pSTAT1 ap-peared to be cytoplasmic instead of nuclear. The fact that PRV Ba may not be as efficient in preventing STAT1 phosphoryla-tion would explain the increased expression of ISGs in animals infected with this strain close to death (28).
FIG. 5. Classification of viral genes required for inhibition of STAT1 phosphorylation by PRV Be. (A) The indicated cells were pretreated with CHX (100g/ml) or PAA (400g/ml) for 30 min before being mock infected or infected with PRV Be at a high MOI for 9 h prior to stimulation with IFN-for 30 min. CHX or PAA was maintained in the cell medium throughout the infection and IFN stimulation. (B) Cells were infected with PRV EP0-1 or PRV Ba for 9 h prior to stimulation with IFN- for 30 min. Representative immunofluorescent images stained with anti-pSTAT1 and anti-gB antibodies and Hoechst DNA stain are shown. Cells outlined in the merged panels are magnified in the inset column. Image acquisition settings were kept constant for all panels.
on November 8, 2019 by guest
http://jvi.asm.org/
In summary, wild-type PRV infection of REF cells sup-presses the expression of most IFN--stimulated genes that have potent antiviral effects. This suppression is accomplished by rendering cells unable to phosphorylate STAT1 in response to IFN-treatment. Some ISGs, in particular those involved with inflammation, remain strongly induced in infected cells. The different effects on subsets of ISGs may be a result of signaling pathways other than JAK/STAT being involved in IFN--mediated transcription (32).
ACKNOWLEDGMENTS
We thank Christina Paulus (University of Regensburg, Regensburg, Germany) for generating and providing the PRV EP0-1 mutant strain and REF cells and Neelanjana Ray for guidance in performing mi-croarray and RT-PCR experiments. We are grateful to all members of the Enquist laboratory for helpful discussions.
This research was supported by NIH grant 5P01 CA87661 to L.W.E. A.B. was supported by an NSF Predoctoral Fellowship and a Princeton Graduate School Centennial Fellowship.
REFERENCES
1.Brierley, M. M., and E. N. Fish.2005. Stats: multifaceted regulators of transcription. J. Interferon Cytokine Res.25:733–744.
2.Brittle, E. E., A. E. Reynolds, and L. W. Enquist.2004. Two modes of pseudorabies virus neuroinvasion and lethality in mice. J. Virol.78:12951– 12963.
3.Cassady, K. A., M. Gross, and B. Roizman.1998. The herpes simplex virus US11 protein effectively compensates for the gamma1(34.5) gene if present before activation of protein kinase R by precluding its phosphorylation and that of the alpha subunit of eukaryotic translation initiation factor 2. J. Virol.
72:8620–8626.
4.Chee, A. V., and B. Roizman.2004. Herpes simplex virus 1 gene products occlude the interferon signaling pathway at multiple sites. J. Virol.78:4185– 4196.
5.Doughty, L., K. Nguyen, J. Durbin, and C. Biron.2001. A role for IFN-alpha beta in virus infection-induced sensitization to endotoxin. J. Immunol.166:
2658–2664.
6.Eidson, K. M., W. E. Hobbs, B. J. Manning, P. Carlson, and N. A. DeLuca.
2002. Expression of herpes simplex virus ICP0 inhibits the induction of interferon-stimulated genes by viral infection. J. Virol.76:2180–2191. 7.Fuchs, W., H. J. Rziha, N. Lukacs, I. Braunschweiger, N. Visser, D.
Lut-ticken, C. S. Schreurs, H. J. Thiel, and T. C. Mettenleiter.1990. Pseudora-bies virus glycoprotein gI: in vitro and in vivo analysis of immunorelevant epitopes. J. Gen. Virol.71:1141–1151.
8.Ghebrehiwet, B., and E. I. B. Peerschke.2004. cC1q-R (calreticulin) and gC1q-R/p33: ubiquitously expressed multi-ligand binding cellular proteins involved in inflammation and infection. Mol. Immunol.41:173–183. 9.Hampl, H., T. Ben-Porat, L. Ehrlicher, K. O. Habermehl, and A. S. Kaplan.
1984. Characterization of the envelope proteins of pseudorabies virus. J. Vi-rol.52:583–590.
10.Ha¨rle, P., V. Cull, M. P. Agbaga, R. Silverman, B. R. G. Williams, C. James, and D. J. J. Carr.2002. Differential effect of murine alpha/beta interferon transgenes on antagonization of herpes simplex virus type I replication. J. Virol.76:6558–6567.
11.He, B., M. Gross, and B. Roizman.1997. The gamma(1)34.5 protein of herpes simplex virus 1 complexes with protein phosphatase 1␣to dephos-phorylate the alpha subunit of the eukaryotic translation initiation factor 2 and preclude the shutoff of protein synthesis by double-stranded RNA-activated protein kinase. Proc. Natl. Acad. Sci. USA94:843–848. 12.Hengel, H., and U. H. Koszinowski.1997. Interference with antigen
process-ing by viruses. Curr. Opin. Immunol.9:470–476.
13.Katze, M. G., Y. He, and M. G. Gale, Jr.2002. Viruses and interferon: a fight for supremacy. Nat. Rev. Immunol.2:675–687.
14.Klimstra, W. B., K. D. Ryman, K. A. Bernard, K. B. Nguyen, C. A. Biron, and R. E. Johnston.1999. Infection of neonatal mice with Sindbis virus results in a systemic inflammatory response syndrome. J. Virol.73:10387–10398. 15.Levy, D. E., and A. Garcia-Sastre.2001. The virus battles: IFN induction of
the antiviral state and mechanisms of viral evasion. Cytokine Growth Factor Rev.12:143–156.
16.Levy, D. E., I. Marie, and A. Prakash.2003. Ringing the interferon alarm: differential regulation of gene expression at the interface between innate and adaptive immunity. Curr. Opin. Immunol.15:52–58.
17.Lin, R., R. S. Noyce, S. E. Collins, R. D. Everett, and K. L. Mossman.2004. The herpes simplex virus ICP0 RING finger domain inhibits IRF3- and IRF7-mediated activation of interferon-stimulated genes. J. Virol.78:1675– 1684.
18.McFerran, J. B., and C. Dow.1975. Studies on immunisation of pigs with the Bartha strain of Aujeszky’s disease virus. Res. Vet. Sci.19:17–22. 19.McGeoch, D. J., and S. Cook.1994. Molecular phylogeny of the
Alphaher-pesvirinae subfamily and a proposed evolutionary timescale. J. Mol. Biol.
238:9–22.
20.Mettenleiter, T. C.2000. Aujeszky’s disease (pseudorabies) virus: the virus and molecular pathogenesis—state of the art, June 1999. Vet. Res.31:99– 115.
21.Mossman, K. L., and A. A. Ashkar.2005. Herpesviruses and the innate immune response. Viral Immunol.18:267–281.
22.Mossman, K. L., P. F. Macgregor, J. J. Rozmus, A. B. Goryachev, A. M. Edwards, and J. R. Smiley.2001. Herpes simplex virus triggers and then disarms a host antiviral response. J. Virol.75:750–758.
23.Ogasawara, K., S. Hida, N. Azimi, Y. Tagaya, T. Sato, T. Yokochi-Fukuda, T. A. Waldmann, T. Taniguchi, and S. Taki.1998. Requirement for IRF-1 in the microenvironment supporting development of natural killer cells. Nature
391:700–703.
24.Olofsson, P. S., K. Jatta, D. Wagsater, S. Gredmark, U. Hedin, G. Paulsson-Berne, C. Soderberg-Naucler, G. K. Hansson, and A. Sirsjo.2005. The antiviral cytomegalovirus inducible gene 5/viperin is expressed in atheroscle-rosis and regulated by proinflammatory agents. Arterioscler. Thromb. Vasc. Biol.25:e113–e116.
25.Ono, E., S. Watanabe, H. Nikami, T. Tasaki, and H. Kida.1998. Pseudo-rabies virus (PRV) early protein 0 activates PRV gene transcription in combination with the immediate-early protein IE180 and enhances the in-fectivity of PRV genomic DNA. Vet. Microbiol.63:99–107.
26.Park, C., S. Lee, I. H. Cho, H. K. Lee, D. Kim, S. Y. Choi, S. B. Oh, K. Park, J. S. Kim, and S. J. Lee.2006. TLR3-mediated signal induces proinflamma-tory cytokine and chemokine gene expression in astrocytes: differential sig-naling mechanisms of TLR3-induced IP-10 and IL-8 gene expression. Glia
53:248–256.
27.Parkinson, J., and R. D. Everett.2000. Alphaherpesvirus proteins related to herpes simplex virus type I ICP0 affect cellular structures and proteins. J. Virol.74:10006–10017.
28.Paulus, C., P. J. Sollars, G. E. Pickard, and L. W. Enquist.2006. The transcriptome signature of virulent and attenuated pseudorabies virus-in-fected rodent brain. J. Virol.80:1773–1786.
29.Platt, K. B., C. J. Mare, and P. N. Hinz.1979. Differentiation of vaccine strains and field isolates of pseudorabies (Aujeszky’s disease) virus: thermal sensitivity and rabbit virulence markers. Arch. Virol.60:13–23.
30.Pomeranz, L. E., A. E. Reynolds, and C. J. Hengartner.2005. Molecular biology of pseudorabies virus: impact on neurovirology and veterinary med-icine. Microbiol. Mol. Biol. Rev.69:462–500.
31.Poppers, J., M. Mulvey, D. Khoo, and I. Mohr.2000. Inhibition of PKR activation by the proline-rich RNA binding domain of the herpes simplex virus type 1 Us11 protein. J. Virol.74:11215–11221.
32.Rani, M. R., and R. M. Ransohoff.2005. Alternative and accessory pathways in the regulation of IFN-beta-mediated gene expression. J. Interferon Cyto-kine Res.25:788–798.
33.Ray, N., and L. W. Enquist.2004. Transcriptional response of a common permissive cell type to infection by two diverse alphaherpesviruses. J. Virol.
78:3489–3501.
34.Samuel, C. E.2001. Antiviral actions of interferons. Clin. Microbiol. Rev.
14:778–809.
35.Sen, G. C.2001. Viruses and interferons. Annu. Rev. Microbiol.55:255–281. 36.Takada, A., and Y. Kawaoka.2003. Antibody-dependent enhancement of viral infection: molecular mechanisms andin vivoimplications. Rev. Med. Virol.13:387–398.
37.Taylor, J. L., S. D. Little, and W. J. O’Brien.1998. The comparative anti-herpes simplex virus effects of human interferons. J. Interferon Cytokine Res.18:159–165.
38.Vollstedt, S., S. Arnold, C. Schwerdel, M. Franchini, G. Alber, J. P. Di Santo, M. Ackermann, and M. Suter. 2004. Interplay between alpha/beta and gamma interferons with B, and natural killer cells in the defense against herpes simplex virus type 1. J. Virol.78:3846–3850.
39.Yokota, S., N. Yokosawa, T. Kubota, T. Suzutani, I. Yoshida, S. Miura, K. Jimbow, and N. Fujii.2001. Herpes simplex virus type 1 suppresses the interferon signaling pathway by inhibiting phosphorylation of STATs and janus kinases during an early infection stage. Virology286:119–124. 40.Yokota, S., N. Yokosawa, T. Okabayashi, T. Suzutani, S. Miura, K. Jimbow,
and N. Fujii.2004. Induction of suppressor of cytokine signaling 3 by herpes simplex virus type 1 contributes to inhibition of the interferon signaling pathway. J. Virol.78:6282–6286.
on November 8, 2019 by guest
http://jvi.asm.org/