• No results found

Optimum percentage of fly ash reinforcement in vinyl ester composites

N/A
N/A
Protected

Academic year: 2019

Share "Optimum percentage of fly ash reinforcement in vinyl ester composites"

Copied!
15
0
0

Loading.... (view fulltext now)

Full text

(1)

Optimum percentage of fly ash reinforcement in vinyl ester

composites

H Ku+#, M Trada+and V Kota+

+Faculty of Engineering and Surveying, #

Centre of Excellence in Engineered Fibre Composites,

University of Southern Queensland, West Street, Toowoomba,4350, Australia E-mail: [email protected]

®Ku, H, Trada, M and Kota, V, Optimum percentage of fly ash reinforced in vinyl ester composites, Journal of Materials in Civil Engineering, January 2010, Bol. 22, No. 1, pp. 104 – 107.

Corresponding Author: Title : Dr.

Name : Harry Siu-lung Ku

Position : Senior lecturer

Affiliation : Faculty of Engineering and Surveying, University of Southern Queensland. Tel. No. : (07) 4631-2919

Fax. No. : (07) 4631-2526 E-mail : [email protected]

Address : Faculty of Engineering and Surveying, University of Southern Queensland, West Street, Toowoomba, 4350, Australia.

Second Author: Title : Mr.

Name : Mohan Trada

Position : Senior technical officer

Affiliation : Faculty of Engineering and Surveying, University of Southern Queensland. Tel. No. : (07) 4631-1367

Fax. No. : (07) 4631-2526

E-mail : [email protected]

Address : Faculty of Engineering and Surveying, University of Southern Queensland, West Street, Toowoomba, 4350, Australia.

Last Author:

Title : Mr.

Name : Vamsi Kota

(2)

Abstract: The previous work of another group of researchersfound that the modulus of tension, flexural and compression increased with increasing percentage by volume of fly ash. They also documented that the viscosity of the composite increased exponentially with increasing percentage by volume of the filler. The viscosity increased sharply when the percentage by volume of reinforcer is between 35 to 50%. They failed to mention the highest percentage by weight of fly ash that could be added to the resin to get highest mechanical properties while still ensuring that the composite could be cast into moulds with ease. This project attempts to find out the optimum percentage by weight of slg in vinyl ester resin as far as yield strength, tensile strength, Young’s modulus and Poisson’s ratio of the composite are taken into account. The research found that 33% by weight of filler is a favourable and convenient percentage by weight of slg to use because up to this percentage by weight of reinforcement, the mechanical properties like modulus of tension are increasing with the increase in percentage by weight of filler, while at the same time the viscosity is not high enough to prevent ease of casting the composite into moulds.

Keywords: vinyl ester, slg, composite, yield strength, tensile strength, Young’s modulus and Poisson’s ratio.

Introduction

(3)

industries at a very competitive cost. A lot of research has been done in the centre in finding the most suitable combination of resin and reinforcer; up to date, cenospheres (ceramic hollow spheres or slg) reinforced vinyl ester composite is found to be the most suitable material for their current applications, e.g. bridges. The sample is simply made by casting the mixture of the resin, initiator and the slg into the moulds.

(4)

The Samples and Tensile Tests

The vinyl ester resin used is Hetron 922 PAW. The vinyl ester is dissolved in 50% by weight of styrene. The resin hardener is MEKP (methyl ethyl ketone peroxide) and the resin to hardener ratio used in the previous study is 98% resin and 2 % hardener by volume (Davey, et al., 2005). The same the resin to hardener ratio has been used in this study. The reinforcer is slg (ceramic hollow spheres) particulates and its percentage by weight was from 30 % to 35 % in the cured vinyl ester composite, VE/SLG because previous study showed that the yield and tensile strengths of composites with 25% or less by weight of fly ash were lower than those at 30% by weight of filler and they are therefore not considered here (Davey, et al., 2005). As the raw materials of the composites are liquid resin and ceramic hollow spheres, the tensile test specimens were cast to shape. The resin is first mixed with the accelerator, (MEKP). After that slg is added to the mixture and they are then mixed to give the uncured composite, which was then poured into the moulds of polyvinylchloride (PVC) for curing in ambient conditions (Ku, 2003).

(5)

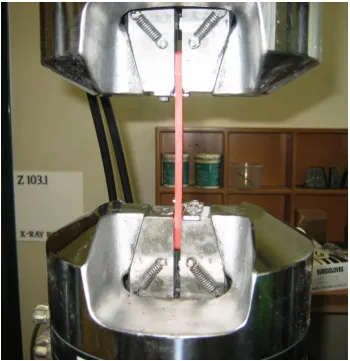
A Material Testing Systems (MTS) 810 was used for the tests. The capacity of the testing machine was 100 kN. The rate of extension, 1 mm per minute, was in accordance with an Australian Standard (Australian Standard 1145.2, 2001). A sample in test was shown in Figure 1. A total of five samples were tested for each fly ash percentage under consideration. The results of tensile tests were used in evaluating whether 33% by weight of fly ash was the best percentage of reinforcement.

Results and discussions

Yield Strength

It is the yield strength at which a definite amount of plastic strain has occurred. Figure 2 shows the force-extension curve of the composite material studied and how a 0.2% offset line was drawn parallel to the most approximated linear portion of the curve and the intersection of the offset line with the curve (John, 1990). When the intersection was projected to the y-axis, the load found was 1312 N which is the 0.2 % offset yield load. For example, the yield strength of sample 4 cured under ambient

conditions

area tional cross

Original

load offset

sec %

2 . 0

 = 14.46 4.32 1312

x = 21.00(MPa, mega

Pascals).

Tensile strength

This tensile strength can be calculated by dividing the maximum load with the

(6)

tensile strength of sample 4 cured under ambient conditions 32 . 4 46 . 14 1407

x = 22.52

(MPa).

The tensile strength is most sought after result of a tensile test. It is easy to determine and has become a familiar property and is useful for the purposes of specifications and quality control of a product.

Young’s modulus

The Young’s modulus (E) or modulus of elasticity is to measure the stiffness of the material. The Young’s modulus can be calculated by calculating the slope of the initial linear portion of the stress-strain curve. For example, the Young’s modulus of sample 4 cured under ambient conditions was calculated using the data provided from Figure 3, in which a portion of the most linear part of the curve was selected; after projecting the top and bottom points of the selected linear portion into the x- and y- axis respectively, the force (530.9 – 143.6) N and the extension (0.20- 0.05) mm were obtained and used in the calculation.

E =    105 ) 05 . 0 20 . 0 ( 32 . 4 46 . 14 6 . 143 9 . 530

x = 4340.15 (MPa) = 4.340 (GPa, giga Pascals).

+

is grip separation length in mm.

Poisson’s ratio

When a tensile stress is imposed on

ε

x a composite specimen, an elastic elongation

(7)

to be the x direction). As a result of this elongation, there will be constrictions in the lateral (y and z) directions perpendicular to the applied stress; from these contractions, the compressive strains

ε

y and

ε

z may be determined. If the applied stress is uniaxial,

and the material is isotropic, then

ε

y =

ε

z. A parameter termed Poisson’s ratio

ν

is defined as the ratio of the lateral and axial strains, or

x z

x y

  

   (1)

The negative sign is included in the expression so that

ν

will always be positive, since

ε

y and

ε

z will always be in opposite sign (Callister, 2003). Theoretically, the

Poisson’s ratio for isotropic material is 0.25; furthermore, the maximum value for

ν

is

0.50 (Callister, 2003). The Poisson’s ratio of sample 4 cured under ambient conditions is 0.353

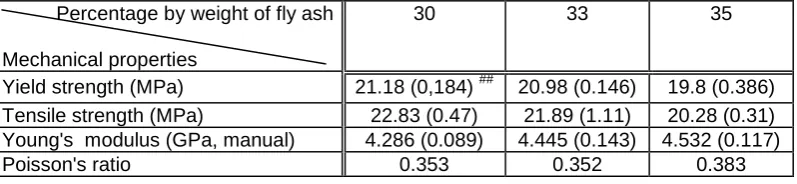
Table 1 summarizes the yield strength, tensile strength, Young’s modulus and Poisson’s ratio of VE/SLG at different percentages by weight of fly ash. The values of the standard deviations are low and it can be argued that the data are reliable. Figure 4 illustrates the yield and tensile strengths of VE/SLG composites with varying percentages by weight of slg. From the two curves (yield strength and tensile strength in Figure 4), it can be argued that the highest strengths are at 30% by weight of slg.

(8)
(9)

percent otherwise all advantages obtained by increasing the percentage by weight of fly ash will be compromised by the reduction in yield and tensile strengths. At 33 % by weight of filler, the viscosity, the modulus of tension, flexure and compression of the composite are 7,630 cP or 7.36 N-sm-2, 4.56 GPa, 4.33 GPa and 2.87 GPa respectively (Davey, et al., 2005); the yield strength, tensile strength, Young’s modulus and Poisson’s ratio of the composite are 20.98 MPa, 21.89 MPa, 4.45 GPa and 0.352 respectively (Kota, 2006). They are all in favourable conditions as compared to their respective values at 30% by weight of filler.

It is worth noting that the tension of modulus (4.56 GPa) at 33% by weight of filler obtained by Davey et al. (2005) is very close to the Young’s modulus (4.45 GPa) at the same percentage by weight of reinforcer obtained by Kota (2006). The difference between them is minimal and therefore negligible. The difference between the values obtained by two independent researchers is only 2.5% and the values are obtained by averaging five or more samples and it can be argued that their data are accurate and reliable.

The vinyl ester used in this research is Australian dollar $5.00 per kg and that of fly ash is $0.30. For 1 kg of the composite with 33% by weight of fly ash, the cost for the resin is $ 3.33 and that of the fly ash is $0.20. The total cost is $ 3.53 as compared to $5.00 for unfilled resin. This is a reduction of 30%. On the other hand, the tension of modulus of unfilled resin is 3,300 MPa while that with 33% by weight of fly ash is 4,600 MPa, an increase of 40%.

(10)

From the above discussions, it can be found that the optimum percentage by weight of fly ash in vinyl ester resin composite is 33% because at that percentage by weight of filler, the mechanical properties of the composite are the best and its fluidity is also suitable for casting. It can be argued that Davey et al. (2005) decided not to use 37.5% by weight of slg for the composite because at 37.5 % by weight of the filler, the viscosity (13,000cP or 13 N-sm-2) of the composite mix becomes too high for casting; there was no indicator in his research as what is the limit of viscosity at which casting is still favourable. In this project, all mechanical properties measured except yield and tensile strength also favours the percentage by weight of fly ash of up to 40 percent but the yield and tensile strength gives us the limit at which these properties become unacceptable if the percentage by weight of filler is over 33%.

References:

Åstrom, B. T. (1997). ‘Manufacturing of polymer composites’, Chapman and Hall, UK, pp. 74-83, 432-4.

Calister, W. D. (2003). ‘Material Science and Engineering: An Introduction’, 6th edition, Wiley International Edition, pp.121-122, 415, 416, 744-745.

(11)

Davey, S. W., Heldt, T., Van Erp, G. and Ayers, S. R. (2005). ‘Vinylester/cenosphere composite materials for civil and structural engineering’. FRP International, 2 (3). pp. 2-5.

John, V. B. (1990). ‘Engineering Materials’, Macmillan, p. 209.

Kota, V. (2006). ‘Young’s modulus of vinyl ester composites cured by microwave irradiation’, Master of Engineering Technology Thesis, University of Southern Queensland, Australia.

Ku, H. (2003). ‘Curing vinyl ester particle reinforced composites using microwaves’, Journal of Composite Materials, 37(22), pp. 2027 – 2042.

(12)

[image:12.595.139.490.70.432.2]
(13)

Figure 2: Load against extension of a sample cured under ambient conditions

Figure 3: Graph showing how to get data for calculating Young’s modulus Specimen Results:

Thickness 4.320 mm Width 14.460 mm Area 62 mm2 Peak Load 1407 N

Peak Stress 22.52 MPa Break Load 1371 N Break Stress 21.94 MPa Elongation At Break 0.857 mm Stress At Offset Yield 11.146 MPa Load At Offset Yield 696.252 N Load at Offset Yield 1312 N

Sample ID: Ambient Specimen Number: 4

(1312)

0.2% offset

530.9

143.6

(14)

Yield and tensile strengths for VE/FLY-ASH (variable %)

18 19 20 21 22 23 24

29 30 31 32 33 34 35 36

Percentage by w eight of fly ash

S tr e n g th ( M P a )

Yield strength (MPa)

Tensile strength (MPa)

Figure 4: Yield and tensile strengths of VE/FLY-ASH vs percentage by weight of filler

Young's modulusfor VE/FLY-ASH (v ariable %)

4.2 4.3 4.4 4.5 4.6

29 30 31 32 33 34 35 36

Percentage by weight of fly ash

Yo u n g 's m o d u lu s (G Pa )

Young's modulus (GPa)

Figure 5: Young’s modulus of VE/FLY-ASH vs percentage by weight of filler

Poisson's ratio for VE/FLY-ASH (variable %)

0.3 0.35 0.4 0.45 0.5

29 30 31 32 33 34 35 36

Percentage by w eight of fly ash

P o is s o n 's r a ti o Poisson's ratio

(15)
[image:15.595.89.488.95.187.2]

Table 1: Mechanical prosperities of VE/FLY-ASH with varying percentages by weight of fly ash

Percentage by weight of fly ash

Mechanical properties

30 33 35

Yield strength (MPa) 21.18 (0,184) ## 20.98 (0.146) 19.8 (0.386) Tensile strength (MPa) 22.83 (0.47) 21.89 (1.11) 20.28 (0.31) Young's modulus (GPa, manual) 4.286 (0.089) 4.445 (0.143) 4.532 (0.117)

Poisson's ratio 0.353 0.352 0.383

##

Figure

Figure 1: A sample under test
Table 1:  Mechanical prosperities of VE/FLY-ASH with varying percentages by weight of fly ash

References

Related documents

vein. Similarly, the 3 lesions found on superficial lobe and 1 secondary lesion all presented deformation and displacement of sub- mandibular vein, indicating a higher tendency

After having the metadata terms from Provenance Vocabulary the provenance information of the dataset are stored using VoID which is based on two dimensions viz Data

equi in the salivary glands; (ii) 233 adult ticks fed as nymphs on H072 during the chronic phase of infection were trans- mission fed on naive horse H073, with 98 ticks being

Heinonen and Strandvik (2005) outline that consumers distinguish advertising at this level as a disturbance due to the personal nature of a mobile phone, usually only used to

For this purpose, we depleted cellular cholesterol and disrupted the lipid rafts in Jurkat cells treated with BCDs and/or statins (Fig. 2 and 3) and subsequently examined the ability

The interviews suggested that some students do not have internet access at home, that some do not like checking emails each day, and that others ‘just don’t like using the computer.’

Tuckman’s four stage model of sequential group development serves as the basic theoretical lens through which the role ‘teams’ play in the working environment of a large

In relation with the stated aim of the project ‘to determine flexible moduli for different pavements materials for use in future mechanistic pavement design in North