University of Southern Queensland
Faculty of Engineering and Surveying
Development and Testing of a Networked
PC Power Management Tool
A dissertation submitted by
Simon Brooks
in fulfilment of the requirements of
Courses ENG4111 and ENG4112 Research Project
towards the degree of
Bachelor of Engineering (Computer Systems)
Abstract
One of the major themes of this project is Personal Computer (PC) power usage, which is a significant issue as many PCs run 24 hours per day and therefore potentially waste large amounts of power. This power wastage is unfortunate given that most operating systems support hibernation
As issues such as fossil fuels, carbon footprint, global warming etc., are highly topical and politicized, energy efficiency in electrical devices is a significant issue. Additionally, through capability developments such as âgreenâ computing, virtualization, and even edge computing, the Information and Communications Technology (ICT) industry is one of the few industries that seem to be taking ecological issues seriously.
The main objectives of the project are:
⢠The research and evaluation of a number statistics that relate to PC energy consumption.
⢠Investigation of power spikes and network traffic floods which may be caused by simultaneous PC start-up.
⢠Development of a software tool to control the start-up and shutdown of a PC either via scheduling or manual control.
⢠Development of a software tool that remotely controls the start-up and shutdown of either singular or grouped PCs.
start-up has a secondary benefit in potentially reducing the severity of power spikes due to a simultaneous PC start-up.
University of Southern Queensland
Faculty of Engineering and Surveying
ENG4111 Research Project Part 1 &
ENG4112 Research Project Part 2
Limitations of Use
The Council of the University of Southern Queensland, its Faculty of Engineering and
Surveying, and the staff of the University of Southern Queensland, do not accept any
responsibility for the truth, accuracy or completeness of material contained within or
associated with this dissertation.
Persons using all or any part of this material do so at their own risk, and not at the risk of the
Council of the University of Southern Queensland, its Faculty of Engineering and Surveying
or the staff of the University of Southern Queensland.
This dissertation reports an educational exercise and has no purpose or validity beyond this
exercise. The sole purpose of the course "Project and Dissertation" is to contribute to the
overall education within the studentâs chosen degree programme. This document, the
associated hardware, software, drawings, and other material set out in the associated
appendices should not be used for any other purpose: if they are so used, it is entirely at the
risk of the user.
Professor Frank Bullen
Dean
Certification
I certify that the ideas, designs, and experimental work, results, analyses and conclusions set out in this dissertation are entirely my own effort, except where otherwise indicated and acknowledged.
I further certify that the work is original and has not been previously submitted for assessment in any other course or institution, except where specifically stated.
Simon Brooks
Student Number: 0011120394
____________________________________ Signature
Acknowledgements
This project was carried out under the supervision of Dr Alexander Kist and I would like to thank Alexander for his guidance and support during the project.
Table of Contents
Abstract ... i
Limitations of Use... iii
Certification ... iv
Acknowledgements ... v
Table of Contents ... vi
Appendices... x
List of Tables ... xi
List of Figures ... xii
List of Abbreviations ... xiv
Chapter 1. Introduction ... 1
1.1 Project theme and background... 1
1.2 Dissertation layout and description... 2
Chapter 2. Project drivers ... 4
2.1 Introduction... 4
2.2 Energy production... 4
2.3 Energy usage... 6
2.4 Significance of PC energy consumption... 8
2.5 Network transmission efficiency ... 9
2.6 Efficient and consistent power draw... 11
Chapter 3. A brief review of PCs and networks ... 12
3.1 Introduction... 12
3.2 Advanced Configuration and Power Interface... 12
3.2.1 ACPI Global States ... 13
3.2.2 ACPI Sleeping States ... 14
3.3.2 Application Programming Interface... 17
3.4 Wake on LAN... 19
3.4.1 Wake on LAN Details... 19
3.4.2 Wake on LAN Setting Considerations... 21
Chapter 4. Project objectives and scope analysis ... 22
4.1 Introduction... 22
4.2 Project objectives and scoping... 22
Chapter 5. Project statistics and outcomes ... 26
5.1 Introduction... 26
5.2 Computer usage statistics... 27
5.2.1 Computer power status... 27
5.2.2 Energy financial cost estimates ... 29
5.2.3 Energy environmental cost estimates... 30
5.2.4 Idle time statistics... 30
5.2.5 Network traffic floods ... 32
5.2.6 Power spikes ... 33
5.3 Environmental and financial impacts ... 34
Chapter 6. Project management ... 35
6.1 Introduction... 35
6.2 Project methodology and lifecycle ... 36
6.3 Project Scope ... 37
6.4 Project risk ... 38
6.5 Project activities and schedule... 40
6.6 Software Project Management... 41
Chapter 7. Software development... 42
7.1 Introduction... 42
7.2 Development and implementation environment... 42
7.4.2 Human-computer interaction ... 49
7.5 Security ... 51
7.6 Implementation considerations and resources ... 53
Chapter 8. Program outline... 54
8.1 Introduction... 54
8.2 PowerMan general outline ... 56
8.3 PowerMan client operation... 58
8.3.1 System details ... 59
8.3.2 Server connection... 59
8.3.3 Efficiency ... 60
8.3.4 Sleeping... 61
8.3.5 Waking ... 62
8.3.6 Storage ... 62
8.3.7 PowerMan client functions ... 63
8.4 PowerMan server operation ... 65
8.4.1 System details ... 66
8.4.2 Network details ... 66
8.4.3 Client management ... 67
8.4.4 Wake list management ... 69
8.4.5 Wake scheduling ... 70
8.4.6 Storage ... 71
8.4.7 PowerMan server functions... 72
Chapter 9. Testing and evaluation ... 74
9.1 Introduction... 74
9.2 Testing methodology ... 74
9.3 Test environment ... 76
9.4 Test plan and results ... 77
9.4.1 Client specific testing... 77
Chapter 10. Conclusions and Future developments... 84
10.1 Achievement of project objectives ... 84
10.2 Further work ... 85
Appendices
Appendix A - Research Project Specification ... 90
Appendix B - Research Project Schedule ... 91
Appendix C â PowerMan Client Code ... 92
Appendix C1 â Form1.cs... 93
Appendix C2 â Form1.Designer.cs ... 112
Appendix C3 â Program.cs ... 114
Appendix C4 â DateTimeState.cs ... 115
Appendix C5 â ServerPacket.cs ... 117
Appendix D â PowerMan Server Code ... 118
Appendix D1 â Form1.cs ... 119
Appendix D2 â Form1.Designer.cs ... 138
Appendix D3 â Program.cs ... 140
Appendix D4 â ClientPacket.cs... 141
Appendix D5 â ServerClient.cs... 142
Appendix E â PowerMan Batch File Contents... 143
Appendix F â PowerMan Class Library Code... 144
List of Tables
Table 2.1 â PC electrical energy usage... 6
Table 2.2 â Average Power Consumption: Computer and Peripherals ... 7
Table 3.1 â ACPI Global States... 13
Table 3.2 â ACPI Sleeping States... 14
Table 3.3 â Practical View of ACPI Sleeping States... 15
Table 3.4 â ACPI Global States... 16
Table 5.1 â PC Night Status... 28
Table 5.2 â Common energy tariffs and costs ... 29
Table 5.3 â Estimates for âcarbon costâ of coal fired energy... 30
Table 5.4 â Idle time delay and effect on PC power state ... 31
Table 6.1 â Project risk management plan... 39
Table 6.2 â Project Activity Table... 40
List of Figures
Figure 2.1 â Greenhouse gas emissions by sector ... 5
Figure 2.2 â Carbon dioxide emissions from US electricity generation... 5
Figure 2.3 â Energy usage by sector... 8
Figure 3.1 â System states and transitions ... 16
Figure 5.1 â Power status by equipment type... 27
Figure 5.2 â Idle time delay effect on PC power state... 31
Figure 5.3 â Effects of network traffic shaping ... 32
Figure 6.1 â Project âtriple constraintâ... 36
Figure 6.2 â Project lifecycle phases ... 36
Figure 6.3 â Typical software project management ... 41
Figure 7.1 â âWaterfallâ software development lifecycle. ... 45
Figure 7.2 â âIncrementalâ software development lifecycle ... 46
Figure 7.3 â Hybrid software development lifecycle ... 47
Figure 7.4 â User interface design approaches ... 49
Figure 8.1 â Transitions between sleeping and waking states ... 54
Figure 8.2 â Basic client server diagram ... 56
Figure 8.3 â High level application model ... 57
Figure 8.4 â âPowerManâ client side screenshot... 58
Figure 8.5 â Client system details... 59
Figure 8.6 â Client network details... 60
Figure 8.7 â Client efficiency settings ... 60
Figure 8.8 â Client session end settings... 61
Figure 8.9 â Client session end and start details... 61
Figure 8.10 â Client session wake settings ... 62
Figure 8.11 â âPowerManâ server side screenshot... 65
Figure 8.12 â Server system details ... 66
Figure 8.13 â Server network details ... 67
Figure 8.17 â Server scheduled wake list details... 71
Figure 9.1 â Testing phases ... 74
Figure 9.2 â Example of software testing process model ... 75
List of Abbreviations
ACPI Advanced Configuration and Power Control Interface API Application Programming Interface
ARP Address Resolution Protocol BCL Base Class Library
BIOS Basic Input Output System CLR Common Language Runtime CPU Central Processing Unit DLL Dynamic Link Library GUI Graphical User Interface
ICT Information and Communications Technology IDE Integrated Development Environment IP Internet Protocol
IT Information Technology LAN Local Area Network MAC Media Access Control MPS Multiprocessor Support OS Operating System PC Personal Computer
PM Project Manager / Project Management PMI Project Management Institute
PMP Project Management Plan ROI Return On Investment RTC Real Time Clock
TCP Transmission Control Protocol UDP Universal Datagram Protocol
Chapter 1.
Introduction
1.1
Project theme and background
The chosen topic for this dissertation is the âDevelopment and Testing of a Networked PC Power Management Toolâ. The primary theme of this project is Personal Computer (PC) power usage, which is a significant issue as many home and office PCs run 24 hours per day, and therefore potentially waste large amounts of power. This power wastage is unfortunate given that most Operating Systems (OS) support either hibernation (Kist 2009), or other forms of low power standby.
Building on the theme described above, the primary aim of this project was the development of simple software tool that would control the start-up and shutdown of PCs via a user defined schedule. The developed software tool comprises of both a localised client control capability in addition to a functionality allowing a networked or supervisory control of a scheduled PC start-up, and also singular remote PC shutdown capability.
In addition to the broad development objectives outlined above, the project has also included research into the following areas:
⢠Average PC energy use and related statistics in common operating environments.
⢠Impact of simultaneous PC start-up on network traffic, and mains power supplies.
available that supports both the mainstream and extreme views on current environmental issues. Additionally, through capability developments such as âgreenâ computing, virtualisation, and even edge computing it would appear that the Information and Communications Technology (ICT) industry is one of the few industries that are actually taking ecological issues seriously.
This leading approach by the ICT industry which may be seen by many as unnecessarily restrictive given current laws, may in fact work in the industries long run favour. That is, by adopting a market leading approach on power efficiency now, it is likely that the ICT industry will not be as significantly effected should more rigid power related statutory regulations or governance be put in place in the future.
1.2
Dissertation layout and description
The approximate singular Full Time Equivalent (FTE) project hours against the major project functional categories are listed below to demonstrate the âtimeâ component of this project:
⢠Research â 150 hours
⢠Coding and testing â 200 hours ⢠Documenting and reporting â 50 hours
The following paragraphs provide a brief description of the layout of this dissertation:
⢠Chapter 2 describes the primary project drivers and hence the rationale and associated benefits of the project.
⢠Chapter 4 examines in detail the objectives for the project and subsequently provides some discussion on the rationale behind the objectives, thus aiding in the provision of a robust scope for the application development.
⢠Chapter 5 looks at PC power usage and other network related statistics, which form the critical components of the research requirements for this project.
⢠Chapter 6 details the project management methodologies and processes which are critical to complex software development, and hence this project.
⢠Chapter 7 details the software development considerations including the development environment and methodology.
⢠Chapter 8 provides a functional description of both the server and client applications, in addition to the key features.
⢠Chapter 9 details the testing methodology, test plan and test results for the developed applications.
Chapter 2.
Project drivers
2.1
Introduction
This chapter describes the primary project drivers, and hence presents the rationale and the associated benefits for this chosen project.
2.2
Energy production
According to Silver (2008), the majority of energy utilised today is generated from the burning of fossil fuels. This combustion process which results in the by-product of carbon dioxide, is responsible for the increases in carbon dioxide in the atmosphere to levels 35 percent greater than 150 years ago. The exponential generation of carbon dioxide and other greenhouse gases is likely to continue throughout this century, and thus if the present strong belief by scientists and policymakers proves to be correct, then these gases will be a significant driver for global climate changes in the future (Williams & Balling 1996).
Waste Disposal 2.8%
Energy Supply 25.9%
Forestry 17.4% Agriculture
13.5% Industry
19.4% Buildings
7.9% Transportation
[image:20.612.191.463.86.287.2]13.1%
Figure 2.1 â Greenhouse gas emissions by sector (Source: Silver 2008)
Natural Gas 13%
Oil 4%
Coal 83%
[image:20.612.188.462.417.620.2]2.3
Energy usage
From above it can be readily seen how power consumption directly contributes to greenhouse gas emissions, and thus possibly global climate change. While greenhouse gas emissions and climate change are important topics within the broad context of this project, they are not the primary focus. The primary focus of this project is the potential for energy savings or the greater efficiency of a standard PC utilised in a home or small office environment. Table 2.1 below details the energy consumption for a PC. Importantly, it also compares energy usage between the different âstatesâ of the computer.
Appliance Wattage Rating
CPU (awake/asleep) 120/30 or less
Monitor (awake/asleep) 150/30 or less
Laptop 50
Table 2.1 â PC electrical energy usage (Source: Silver 2008)
Appliance Energy Use (watts)
Desktop CPU 100
LCD Monitor (15-17 inches) 50-150
Laser printer 100
Inkjet printer 12
Multifunction printer/copier 15
Laptop 22
Wireless router 6
Computer speakers 7
USB hub 3
Table 2.2 â Average Power Consumption: Computer and Peripherals (Source: Leonhard & Murray 2009)
Electricity 40%
Homes, offices, businesses
11% Industrial
21% Transportation
28%
Figure 2.3 â Energy usage by sector (Source: Leonhard & Murray 2009)
Using the abovementioned figures and illustrations, it can be seen how switching to a âsleepingâ (or like) state of the PC can result in an energy usage of approximately one quarter of the normal usage. Furthermore, if we consider that a hard shutdown or power off will have a wattage usage rating of zero, then the energy and potential cost savings are even more significant.
2.4
Significance of PC energy consumption
2.5
Network transmission efficiency
Another component of this project is the management of networked PCs start-up in order to minimise the potential for network traffic problems. According to Addie (2007), network traffic can be affected by either data loss or delay, with the three major causes of delay being:
⢠Propagation delay, ⢠Transmission delay, and ⢠Queuing delay.
Given that propagation delay is due to the physical transmission distance (Held 1996), it is likely to be insignificant when compared to other forms of delay in a small office environment. Furthermore, transmission delay which is the delay due to the time taken to feed a signal onto the communications medium (Slone 2000), is likely to be much more significant than propagation delay over short distances.
Last but by no means least is queuing delay, which is the delay due to storage and retransmission of data within a network (Hancock 1990). Queuing delay is likely to have some impact within a small office environment depending upon the amount and type of data switching that takes place within the network.
In addition to above, data arriving at a destination will have to be either buffered or discarded in cases where the destination device is busy. Furthermore, where a buffer reaches maximum capacity, discarding of data will also occur. Where this data is discarded, it is effectively lost, and thus is required to be retransmitted, which then places an additional traffic load on the network. Lewis (2008) suggests that another significant factor in data corruption or data loss is network collisions, which are common on an Ethernet network, and are the result of two hosts transmitting frames simultaneously.
device. This combination of collision and buffering issues is then likely to result in data corruption and/or loss, and therefore retransmission. This will ultimately result in increased networked traffic.
2.6
Efficient and consistent power draw
The final major driver for the project is efficient power consumption, with a focus on the minimisation of controlled events which could contribute to a power spike. A power spike is a short duration high voltage condition (Smith 2010) that occurs across a power circuit. Theses spikes can have a number of effects including damaging an electronic deviceâs internal power supply in addition to damaging or degrading other sensitive components such as motherboards and processors.
While the majority of power spikes can be attributed to environmental factors such as storms or lightning, power spikes can also be caused by the switching of large electrical loads (ThomasNet 2010). In the case of a modern office environment where a vast number of PCs may be either started or shut down simultaneously, there is a frequent net effect of large electrical load being either applied or removed from a power circuit. This therefore increases the chances of a power spike being generated within the circuit.
Furthermore, while the switching of loads may cause power spikes, and hence damage to internal equipment, the switching of large loads will also impact upon the primary power feeder into an office or building. This could then have flow on effects of impacting upon the reliability or consistency of the power network.
Chapter 3.
A brief review of PCs and networks
3.1
Introduction
The following paragraphs detail the research into PCs and networks and consequently form the base level of knowledge that the project and/or application is built on. Importantly, while the following paragraphs contain a significant amount of the overall project research, the remaining research is provided within the remaining dissertation chapters.
3.2
Advanced Configuration and Power Interface
The Advanced Configuration and Power Interface (ACPI) is a critical component of this project. According to Hewlett-Packard et al (2010), the Advanced Configuration and Power Interface (ACPI) was developed to provide industry standard interfaces. Furthermore, these interfaces allow: Operating Systems (OS) directed device configuration; and power management of both single devices and entire systems.
The ACPI was built on the legacy power management systems and processes including: power management Basic Input Output System (BIOS) code, Advanced Power Management (APM) Application Programming Interfaces (APIs) and Multiprocessor Specification (MPS) tables in order to provide a structured and well defined configuration and power management interface configuration (Hewlett-Packard et al 2010).
The ACPI has a number of state definitions which include expected or designated performance criteria. The categories of the ACPI state definitions are:
⢠ACPI Global states, ⢠ACPI Device states, ⢠ACPI Sleeping states,
⢠ACPI Processor power states, and
⢠ACPI Device and processor performance states.
The states relevant to this dissertation and subsequently described in the following paragraphs are:
⢠Global states, ⢠Sleeping states, and ⢠Processor power states
3.2.1 ACPI Global States
The ACPI has a number of global state definitions which are visible to the user. These global states are described together with some relevant criteria in table 3.1 below
Global State Software Runs Power Consumption OS Restart Required
G0 Working Yes Large No
G1 Sleeping No Smaller No
G2/G5 Soft Off No Very Near 0 Yes
G3 Mechanical Off No Real Time Clock
(RTC) Battery Yes
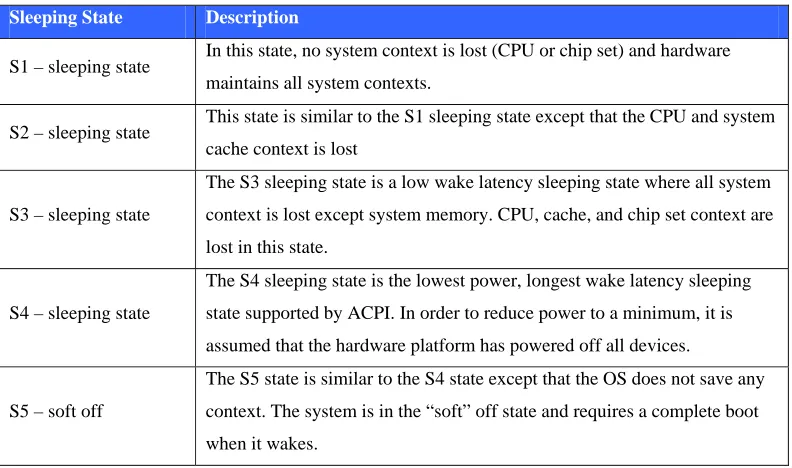
3.2.2 ACPI Sleeping States
The ACPI has a number of sleeping states which reside within the global âG1â state. The ACPI sleeping states are described in table 3.2 below
Sleeping State Description
S1 â sleeping state In this state, no system context is lost (CPU or chip set) and hardware maintains all system contexts.
S2 â sleeping state This state is similar to the S1 sleeping state except that the CPU and system cache context is lost
S3 â sleeping state
The S3 sleeping state is a low wake latency sleeping state where all system
context is lost except system memory. CPU, cache, and chip set context are
lost in this state.
S4 â sleeping state
The S4 sleeping state is the lowest power, longest wake latency sleeping
state supported by ACPI. In order to reduce power to a minimum, it is
assumed that the hardware platform has powered off all devices.
S5 â soft off
The S5 state is similar to the S4 state except that the OS does not save any
context. The system is in the âsoftâ off state and requires a complete boot
[image:29.612.128.524.173.407.2]when it wakes.
Table 3.2 â ACPI Sleeping States (Source: Hewlett-Packard et al 2010)
Sleeping State Description
S0 On and fully operational.
S1 System is in low power mode (a.k.a. sleep mode). The CPU clock is stopped, but RAM is powered on and being refreshed.
S2 Similar to S1, but power is removed from the CPU.
S3 Suspend to RAM (a.k.a. standby mode). Basically, most components are shutdown except RAM.
S4
Suspend to disk (a.k.a. hibernate mode). The memory contents are swapped
to the disk drive, and then reloaded into RAM when the system is
awakened.
S5 Power off.
Table 3.3 â Practical View of ACPI Sleeping States (Source: Intel 2010)
Figure 3.1 below provides an illustration of the transitions between the aforementioned ACPI sleeping states. From this illustration, the following can be noted:
⢠Wake event â This will raise the system to a working of S0 âfull-onâ state from the âS1-S4â sleeping states.
⢠Idle related event â An event generated from measured idle time could transition the system from the S0 âfull-onâ state to the âS1-S4â sleeping states.
⢠Power switch â A OS generated, or user initiated, switch can transition a PC as follows:
Figure 3.1 â System states and transitions (Source: MSDN 2010)
3.2.3 ACPI Processor Power States
The ACPI also has a number of processor power states which reside within the global âG0â state. The ACPI sleeping states are described in table 3.4 below
Processor State Description
C0 While the processor is in this state, it executes instructions.
C1 Aside from putting the processor in a non-executing power state, this state has no other software-visible effects.
C2
The C2 state offers improved power savings over the C1 state. The
worst-case hardware latency for this state is provided via the ACPI system
firmware and the operating software can use this information to determine
when the C1 state should be used instead of the C2 state.
C3
The C3 state offers improved power savings over the C1 and C2 states. The
worst-case hardware latency for this state is provided via the ACPI system
firmware and the operating software can use this information to determine
3.3
Operating System Considerations
The following paragraphs cover some of the noteworthy points relating to the Windows Management Instrumentation (WMI) and the Windows Application Programming Interface (API)
3.3.1 Windows Management Instrumentation
Windows Management Instrumentation (WMI) is provided on Windows based operating systems and is the infrastructure for management data and operations on such systems. Importantly, WMI scripts or applications can be created to automate administrative tasks on remote computers (MSDN 2010). Furthermore, WMI has been designed for programmers who use the C, C++, C# languages within Microsoftâs Visual Studio.
In simple terms, the WMI is an OS interface that provides information and notifications. This then allows for the local and remote management of Windows computers and servers.
3.3.2 Application Programming Interface
According to Silberschatz, Galvin and Gagne (2005), the Application Programming Interface (API) details a list of functions that are made available to a programmer. Included in this list are the parameters that are passed to each function and also the value types that are expected to be returned. The three most common APIs are:
⢠Win32 API for Windows Systems,
⢠POSIX API for POSIX-based systems, and
⢠Java API for programs that run on the Java virtual machine.
full power of Windows. Furthermore, the Windows API (formerly referred to as the Win32 API) consists of the following functional categories:
⢠Administration and Management, ⢠Diagnostics,
⢠Graphics and Multimedia, ⢠Networking,
⢠Security,
3.4
Wake on LAN
The Wake on (Local Area Network) (WoL) functionality is an important consideration in this project. According to Intel (2010), the remote management of PCs has evolved over the last few years from a simple power-on function to a complex system that considers a variety of device and OS power states.
3.4.1 Wake on LAN Details
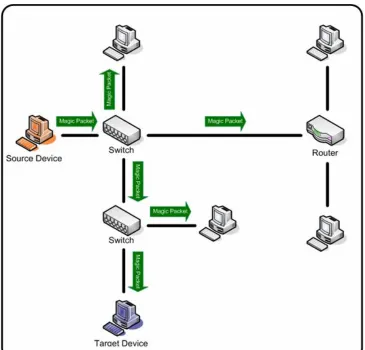
WoL is a functionality of some network interface devices that causes a PC to âwakeâ from an ACPI sleep state. WoL is very much hardware dependant and in most cases will allow the PC to wake from the S1 to S5 states. However, some devices will not respond or âwakeâ when in an S5 state. The WoL process requires the transmission of a âmagic packetâ, which is a packet that begins with a six byte sequence of âFFâ bytes. This sequence is then followed by the Media Access Control (MAC) address of the network device that is being prompted to âwakeâ, repeated 16 times (Neumann 2008). The âmagic packetâ composition is illustrated in figure 3.1 below.
Figure 3.1 â âMagic packetâ composition
generate a âwakeâ event for normal network traffic, but rather will only respond to a specific âwakeâ directive.
Figure 3.2 â âMagic packetâ transmission (Source: Newman, 2008)
3.4.2 Wake on LAN Setting Considerations
As WoL performance is largely dependant on the network device, in order for it to operate, it requires that correct settings be established from within BIOS and also the OS. This is largely due to the fact that while WoL can be initially selected within BIOS, modern operating systems making use of ACPI features allow for the configuration of individual components (Intel 2010).
Experimentation with the WoL functionality has demonstrated that the following components must be checked and/or selected in order for WoL to function correctly:
⢠The device network card must support WoL.
⢠The networked device power supply must support WoL. ⢠WoL must be enabled in BIOS.
⢠The operating system must be configured to enable WoL.
Furthermore, trial and error throughout this project has shown that in order for WoL to have a consistent capability, then the BIOS settings must ensure that after a mains power loss, the system returns to the âlast stateâ. Expanding on this, a given BIOS will generally allow for three settings with respect to power management, after an AC mains power outage including:
⢠Power off, ⢠Last state, and ⢠Power on.
Chapter 4.
Project objectives and scope analysis
4.1
Introduction
Typical software design generally progresses from a user requirements phase through to a formal specification phase and then onto a design phase (Somerville 2007). However, this project in effectively commencing from a formal specification phase, makes user requirements somewhat redundant. When considering that user requirements form a significant consideration in software estimation and planning, and hence overall user satisfaction (Galorath and Evans 2006), detailed user requirements are an extremely valuable component for any software project.
In analysing the project objectives or specification which is included at Appendix A, we are able to broadly capture the intent and breadth of both user functional and non-functional requirements, and from this detail some of the envisaged benefits or outcomes from the project. Furthermore, as Wysocki, Beck & Crane (2000) suggest that project scope is significantly more than just requirements, the use of additional information within the project scope will lead to a more robust scope and hence maximise the chances of project success. Accordingly, the following paragraphs examine the objectives for the project in detail, and subsequently provide some discussion on the rationale behind the objectives.
4.2
Project objectives and scoping
Specification Item 1 - Research and evaluate the average power use, idle time and
other statistics of a PC that relate to power consumption in a standard office
tasks performed on the PC. Consequently, this then allows the examination of whether an automated approach to start-up and shutdown will provide any advantages in relation to the ratio between the idle and active times of the PC. Using these idle time figures, in addition to the statistics on average PC power use, the generation of a number of statistics detailing actual amounts of power used and wasted by an average PC in a standard office environment can be calculated.
Specification Item 2 - Research the potential for, and severity of power spikes,
network traffic floods and other issues in a standard office environment due to
simultaneous PC start-up.
Where PCs in an office environment are started at the same time, for example, at the commencement of a working day, a significant load may be placed on the local power grid, potentially causing power spikes. Through more controlled management of the start-up sequence computers on the same power circuit, the potential for and severity of power spikes may be reduced. Additionally, within a networked PC environment, issues may be caused where PCs attempt to start communicating on the network at the same time, possibly resulting in a network traffic flood. Through the use of a phased start-up, possibly together with some sort of primitive flagging system, the number of PCs attempting to establish communication with the network simultaneously may be able to be better managed, and thus reduce network traffic flood problems.
Specification Item 3 - Develop a software tool that controls start-up and shutdown
of a PC either via scheduling or manual control.
Specification Item 4 - In conjunction with the local software tool described in
component 3, develop a software tool that remotely controls the start-up and
shutdown of either singular or grouped PCs (within a designated domain) over
a Local Area Network (LAN).
Through building upon the functionality of the local start-up and shutdown tool described above via the inclusion of a networked control capability, the management of PC start-up and shutdown can be removed from the user, and therefore reside with a nominated administrator. In addition to freeing the user from managing this task, the use of a centralised start-up capability could potentially provide some benefits due to the ability of the administrator to recognise usage patterns over the entire network, and thus implement a start-up and shutdown schedule that is the most beneficial for the entire network.
Specification Item 5 - In addition to specifications outlined in components 3 and 4
above, the software tool shall:
a. Implement a phased start-up (to prevent power spikes) where multiple
PCs on a single LAN may be scheduled to start-up.
b. Presentation of software tool options, controls, and critical usage
statistics within a user friendly Graphical User Interface (GUI).
A centralised phased start-up will reduce peak demand on shared power sources, and also aid in distributing network traffic to prevent traffic floods. The inclusion of a GUI in addition to an intuitive based format will provide ease of use for the PC user or network administrator. Additionally, the publication of usage trends and statistics may provide the user with some incentive or motivation towards managing their PC usage more efficiently.
Specification Item 6 - Evaluate and test the tool in a small office/network
environment
This testing phase will be incorporated within the development phases under an agile development methodology, which according to Somerville (2004) relies on an iterative approach to software development. This will effectively allow the trial of features etc. as they are implemented and added rather than at the end of development. However, it is most likely that the small office testing will be conducted in two major stages: Firstly, the testing at the completion of local application; and Secondly, the second stage of testing occurring at the end of the development of the network component of the tool.
Specification Item 7 - Evaluate and test the tool in a large office/network
environment.
This will provide a test environment that replicates the intended usage environment, and thus effectively indicate how well the tool performs in its intended role. As this is on an âas time permitsâ basis, and not a critical component of this project, planning for and testing within this environment will only occur (if at all) during the final stages of the small office testing for the network component of the tool.
Specification Item 8 - Translate âwasted power measurementsâ, and also saved
power with the use of the tool into figures relating to a âcarbon footprintâ and
greenhouse gas measurement.
Chapter 5.
Project statistics and outcomes
5.1
Introduction
According to Bigelow (2003), PC power as a topic, is not simply an issue about the connection of a small silver box. With global concerns about limited resources and greenhouse gasses, there is a growing focus on the power that millions of PCs world wide consume, and perhaps more significantly waste, while not being actively used.
Before looking at general PC power use statistics it is worthwhile understanding the different types of power supplies that power modern PCs and also the improvement in these systems over recent years. There are two primary categories of PC power supplies:
⢠Linear power supplies, and ⢠Switched regulator supplies.
Linear power supplies can often waste half of the input power through heat dissipation, thus making them tremendously inefficient. While switched power supplies through the use of feedback loop effectively switch the input voltage off and on to maintain a steady output, and thus minimise power wasted as heat. (Bigelow 2003).
5.2
Computer usage statistics
5.2.1 Computer power status
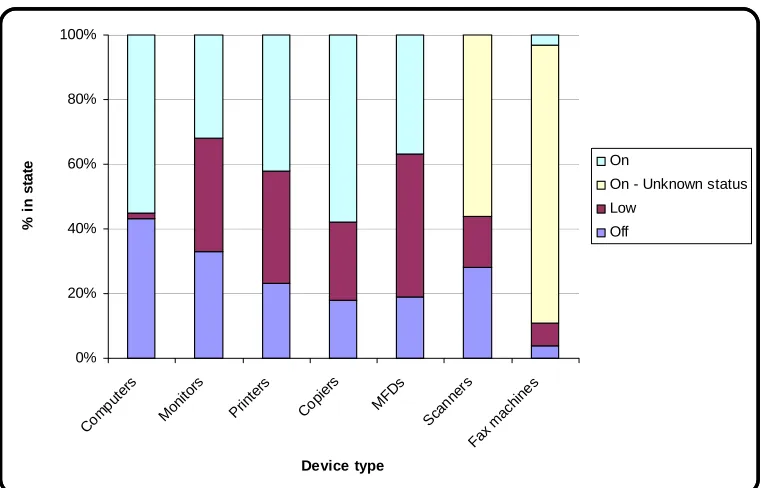
Figure 5.1 below illustrates the observed power status for a number of common office machines including PCs during a survey conducted on an average office environment, during working hours. Importantly, it can be seen that approximately 55% of computers were in an âonâ status during the survey.
0% 20% 40% 60% 80% 100%
Com puter
s
Moni tors
Prin ters
Copi ers
MFDs Scan
ners
Fax ma chin
es
Device type
% in
s
ta
te On
On - Unknown status Low
[image:42.612.136.518.251.495.2]Off
Figure 5.1 â Power status by equipment type (Source: Webber et al. 2001)
Study Sample Size On Low Power Off
Syzdlowski & Chvala (1994) 182 18% -- 82%
Tille & Newsham (1993) 94 20% -- 80%
IHEM (1994) 30 47% 53%
Nordman et al. (1996) 70 26% 6% 69%
LBNL-Forrestal ~200 10% 90%
CADDET (1999) 307 >99% <1% 0%
Arney & Frey 20 25% -- 75%
Nielson (1998) 373 11% 89%
Picklum et al. (1999) 904 17% 9% 73%
Nordman (2000) 154 9% 0% 91%
Table 5.1 â PC Night Status
5.2.2 Energy financial cost estimates
Table 5.2 below details the charges for a number of Ergon Energy advertised energy tariffs. Although the tariffs are quite detailed, they are included to illustrate the approximate financial cost of energy, in addition to the variety of pricing schemes available. Based on this, an arbitrary cost of 17 cents per kilo-Watt-hour (kWh) is used for the financial cost calculations within the project.
Tariff Condition Cost (cents per kWh)
20 â General supply All consumption 23.925
First 100 kWh per month 29.722
Next 9,900 kWh per month 27.918 21 â General supply
Remaining usage 21.252
Low rate 10.241
22 â General supply (time
of use) All other consumption High Rate 29.073
31 â Night rate (super
economy)
All consumption 8.712
33 â Controlled supply
(economy)
All consumption 12.826
From 10.30pm to 4.30pm (18 hours) 12.727 37 - Non-Domestic Heating
Time of Use (Obsolescent) From 4.30pm to 10.30pm (6 hours) 31.823
41 - Low Voltage General
Supply Demand
All consumption 7.414
From 7.00am - 11.00pm Mon - Fri 15.08 43 - General Supply
[image:44.612.127.498.234.521.2]Demand Time of Use Other Times 6.028
5.2.3 Energy environmental cost estimates
Table 5.3 below details the estimated carbon dioxide âcostsâ for coal produced energy. As with the above energy financial costs, they are included to illustrate the estimated environmental cost of energy, in addition to the variety of estimates available for carbon dioxide âcostsâ. Based on this, an arbitrary cost of carbon at 0.956 kg per kWh is used for the energy production environment cost calculations within the project.
Source Cost (carbon (kg) per kWh)
My Clean Sky (2010) 1
Wiki (2010) 0.963
Department of Energy (2000) 0.960
Parliamentary Office of Science and Technology
(2006) >1
Carbon Dioxide (2010) 0.966
Table 5.3 â Estimates for âcarbon costâ of coal fired energy
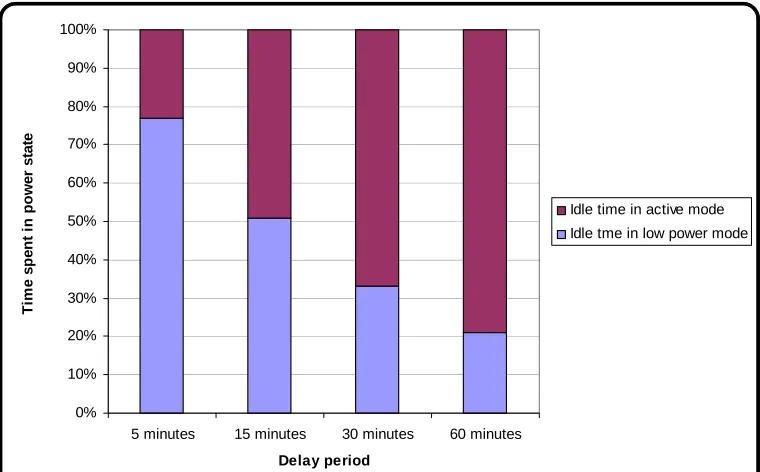
5.2.4 Idle time statistics
Idle time is the time that a PC spends with no direct user interaction. According to a study by Kawamoto et al. (2004), the average computer idle time in any given day is 3.9 hours. By specifying a variable delay, after which computers enter a low power state, the idle time in a high power state can be reduced.
Idle Time Delay (minutes)
Idle Time in Active Mode (minutes)
Idle Time in Low Power Mode (minutes)
Time is Low power Mode (minutes)
5 0.9 3 76
15 1.9 2 51
30 2.6 1.3 34
[image:46.612.136.516.295.531.2]60 3.1 0.8 20
Table 5.4 â Idle time delay and effect on PC power state (Source: Kawamoto et al, 2004)
0% 10% 20% 30% 40% 50% 60% 70% 80% 90% 100%
5 minutes 15 minutes 30 minutes 60 minutes
Delay period T im e sp en t i n p o w e r stat e
Idle time in active mode Idle tme in low power mode
5.2.5 Network traffic floods
A network traffic flood is the saturation of the network with too much traffic, which has the effect of slowing down transmission speeds over the network. Traffic shaping is typically utilised to control the volume of traffic on the network through the imposition of delays on selected packets (Wikipedia 2010). Accordingly, the controlled phased switching of network devices could be considered a primitive form of traffic shaping.
It is important to note that network shaping is significantly different to traffic policing. Traffic policing is the dropping or remarking of selected packets during peak traffic load times (Cisco 2010). One of the significant advantages of traffic shaping, or in fact any sort of network traffic load control, is the even distribution of network traffic over time, rather than a series of extreme peaks and troughs.
5.2.6 Power spikes
As explained previously, power spikes are generally caused by environmental conditions such as lightning, or are due to the switching of large electrical loads. According to Interstate Assessment Technologies (2010) most semi-conductor devices are intolerant of voltage transients in excess of their voltage rating.
Large scale power spikes can cause instantaneous damage such as short circuits, breakdown or melting of insulation, and possibly fire. Looking past immediate physical effects, both large and small scall transients can have the following effects:
⢠Causing semi-conductor devices to fail, and
⢠Degradation of semi-conductor devices leading to a shorter life.
5.3
Environmental and financial impacts
As Rowsell-Jones (2007) suggests the value of an ICT investment is measured in purely in terms of business performance only, it can be concluded that a congested or unavailable network will not provide an optimal return for the business. Therefore the following measures may have significant impact on overall ICT availability, and hence provide a greater financial return for the business:
⢠The efficient management of network traffic to minimise congestion and hence ensure that network traffic throughput is efficient as possible.
⢠The reduction of transient voltages applied to a network to ensure a greater availability of network devices, and also a greater Return On Investment (ROI), through an increased lifespan of network hardware.
It is also hoped that by translating the project energy consumption and production findings into terminology that is presently highly topical and also more common, the benefits of the tool and dissertation are likely to reach a wider audience. Given that engineers are often perceived to reside between pure science and wider society, then a translation of data into a more practical context seems worthwhile.
As discussed above, given the topical nature of energy production, projects that can potentially reduce energy wastage, and thus effectively contribute to reducing carbon emissions are likely to incur significant attention and hopefully further development. It is important to note however, that while this project improves PC power efficiency, it does not alter or improve a PCs power efficiency while operating, and thus the overall energy efficiency is still dependent on the actual energy consumption rate of the device being used.
Chapter 6.
Project management
6.1
Introduction
While this dissertation is primarily intended to identify and detail a solution for a proposed problem or issue within an âacademicâ environment, the methodology utilised to manage the solution development in this environment is just as critical in ensuring project success, as it is in the commercial world.
According to Kerzner (2003) a project can be likened to a series of activities that are subject to some or all of the following criteria:
⢠Defined objectives to be completed in accordance with specifications.
⢠Defined commencement and cessation dates.
⢠Have financial constraints.
⢠Consumption of resources.
Figure 6.1 â Project âtriple constraintâ
6.2
Project methodology and lifecycle
The following paragraphs are, according to Dobie (2007), some of the essential components that are required to be included in a Project Management Plan (PMP):
⢠Project background. ⢠Project objective(s). ⢠Project scope. ⢠Project risks.
⢠Project exclusions, constraints, and assumptions.
Furthermore, the PMI Standards Committee (2000) suggests that project plans should also include a robust risk management component, detailed activity listing, and a corresponding schedule. While we have previously discussed the project background, scope and objectives, the following paragraphs cover the project risk, activities and schedule.
6.3
Project Scope
As discussed previously, the project scope is much more than the requirements or specification, and if not managed correctly can lead to an unsuccessful project. Broadly, project scope is managed under the following categories (PMI Standards Committee 2000):
⢠Scope planning, ⢠Scope definition, ⢠Scope verification, and ⢠Scope control.
are adopted, and are done so in a controlled manner. Changes which are outside this control are often referred to as scope creep and present a major risk to the success of this project.
6.4
Project risk
According to Gardiner (2005), risk management consists of risk assessment and risk control, both of which are effectively governed under the higher level category of risk planning. Given that that the task at hand is in fact a project by definition, the following project management risk types may also be applicable (MGT8022 2009):
⢠Technical risk â the possibility that the original requirements may be not achievable within the given schedule.
⢠Schedule risk â the possibility that the schedule will not conform to the management plan.
⢠Operational risk â the possibility that the equipment will not meet all of the user requirements.
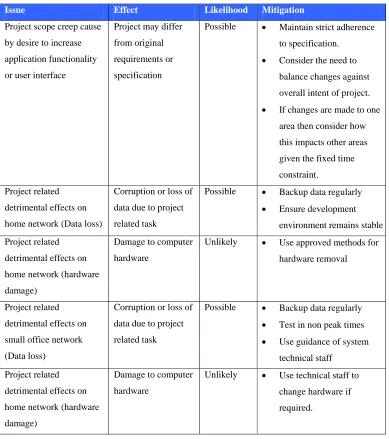
From the above risk categories, technical risk and operational risk are the main risk types that may impact upon this or like projects. It is also important to highlight that while ENG4111/4112 (2009) details that risk implies a threat to personal or public safety, as can be seen from the project risk factors considered above, a holistic perspective to project risk considers much more than purely physical safety issues.
Issue Effect Likelihood Mitigation
Project scope creep cause
by desire to increase
application functionality
or user interface
Project may differ
from original
requirements or
specification
Possible ⢠Maintain strict adherence
to specification.
⢠Consider the need to
balance changes against
overall intent of project.
⢠If changes are made to one
area then consider how
this impacts other areas
given the fixed time
constraint.
Project related
detrimental effects on
home network (Data loss)
Corruption or loss of
data due to project
related task
Possible ⢠Backup data regularly
⢠Ensure development
environment remains stable
Project related
detrimental effects on
home network (hardware
damage)
Damage to computer
hardware
Unlikely ⢠Use approved methods for
hardware removal
Project related
detrimental effects on
small office network
(Data loss)
Corruption or loss of
data due to project
related task
Possible ⢠Backup data regularly
⢠Test in non peak times
⢠Use guidance of system
technical staff
Project related
detrimental effects on
home network (hardware
damage)
Damage to computer
hardware
Unlikely ⢠Use technical staff to
change hardware if
[image:54.612.128.517.63.502.2]required.
6.5
Project activities and schedule
In looking at the project activities and schedule, one of the most obvious differences when compared with industry project management and scheduling, is the fact that the project specification has largely been defined to match the available timeframe. This approach differs with the common approach of using a project specification or requirements to drive a Work Breakdown Structure (WBS), and hence project schedule. This is not a problem, but more an observation of how time constraints can effectively curtail a project from inception.
According to the PMI (2006), planning is pivotal in successful project management, whereby the Work Breakdown Structure (WBS) is used to provide a foundation for defining the project work, and also the framework for managing the work. The planned schedule for the entire project is included in Appendix B, and is derived from the activity table which forms the basis of a WBS, in table 6.2 below.
Various Level Activity Listing
1.1.1 Topic Investigation/Negotiation
1.1.2 Project Specification Negotiation
1.1.3 Implementation Investigation
1.1.4 Environmental Factors Research
1.1.5 Requirements Preliminary Research
1.1.6 Project Coding (Local app) 1.1 Project Phase 1 (ENG4111)
1.1.7 Project Appreciation
1.2.1 Write Draft Dissertation
1.2.2 Project Coding (Networked app)
1.2.3 Small office testing
1.2.4 Partial Draft Dissertation 1 Project
1.2 Project Phase 2 (ENG4112)
[image:55.612.131.522.396.620.2]1.2.5 Write Final Dissertation
6.6
Software Project Management
While the above paragraphs detail the level of generic project planning that has been applied to this project, it is important to note that software development, which is often perceived as intangible, differs from some project management approaches. Phillips (1998) is brutally honest with his depiction of âtypical software project managementâ illustrated in Figure 6.3 below. Additionally, Phillips (1998) takes a differing and perhaps more pragmatic approach to the project triple constraint proposed above, when he suggests that software project management could be done much better through a focus on the following areas:
⢠People perspective, ⢠Business perspective, and ⢠Process perspective.
Figure 6.3 â Typical software project management (Source: Phillips, 1998)
Chapter 7.
Software development
7.1
Introduction
The following paragraphs detail the software development environment, development methodology, design methodology and security considerations that combined to provide the overall development framework for the application.
7.2
Development and implementation environment
According to Eeles and Cripps (2010) the software development environment will include the infrastructure to support the method and tools of the developer(s). In looking at the methods and tools for this project, the primary components are:
⢠Implementation language, and ⢠Software development environment.
The identification and use of suitable Integrated Development Environment (IDE) which is an all one tool for writing, editing, compiling and running a computer program is a critical consideration in software projects. According to Qin, Xing and Zheng (2008) an IDE presents the following advantages from the perspective of a developer:
⢠Reduced requirement for programmers to remember grammar and syntax.
While the above advantages were considered during the early stages of the definition phase of the project lifecycle, the primary consideration for the development environment was programmer skills and experience. Given the developers experience with the C and C++ languages, the initial environment was going to be built around a C++ implementation together a HTML derived user interface. However, through trial and error, a number of limitations with this approach were discovered and a decision was made to consider an alternative development environment.
The chosen development environment for the project was the Microsoft Visual Studio development environment. Microsoft Visual Studio development environment is one of the latest steps in software development environments and is a large and comprehensive compilation of development tools that can be accessed through a windowed interface (Sebasta 2005).
Finally, according to Troelson (2003), C# provides almost as much flexibility and power as C++, and offers the following features in comparison:
⢠No pointers required, as C# programs do not generally have a need for direct pointers.
⢠Automatic memory management, which precludes the need for âdeleteâ keyword.
7.3
Development methodology
The trial and error approach to the identification and selection of an appropriate development environment and language is largely similar to the prototyping software development methodology. Given this prototyping development methodology has the advantage of allowing the early detection of errors (Vliet 2001), it is perhaps unsurprising that a similar approach for the actual software development was undertaken.
The intended development methodology for this project was the waterfall software methodology. The decision to use the waterfall methodology which cascades from one phase to the next (Somerville 2007) and is illustrated in Figure 7.1 below, was based upon the following rationale:
⢠The project was defined by a robust and detailed specification, and
⢠The project included the project specification in addition to a comprehensive project scoping analysis.
[image:60.612.134.509.448.654.2]However, as can be seen in the above illustration the waterfall methodology requires a robust system and software design phase in order to produce a detailed system design. As a decision was made early in the development phase to move further into implementation at the expense of detailed design, the waterfall methodology in many ways became redundant.
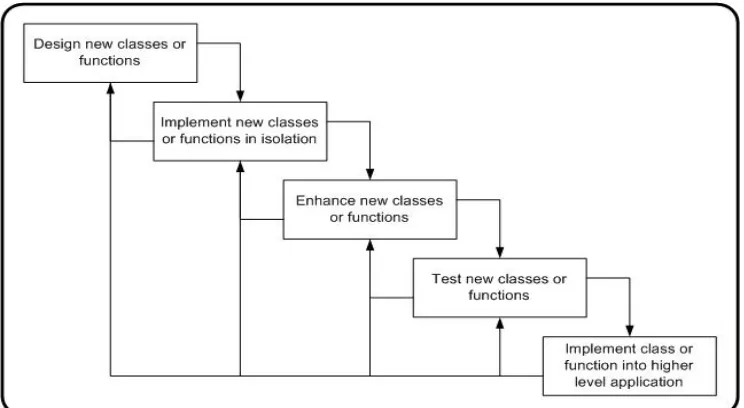
The driver behind the decision to adopt a more agile development approach was based around the desire to complete the majority of the âclientâ application before commencing on the âserverâ application, which provided the network functionality of the application. The development of the application in this way is highly similar to the iterative/incremental software development life cycle, where progression towards the user requirements is achieved via delivery in a number of small steps (Schach 1990). The incremental development methodology is illustrated in Figure 7.2 below.
Figure 7.2 â âIncrementalâ software development lifecycle (Source: Schach, 1990)
level of functionality, then significant re-work and possibly redesign, may have been required.
In looking at the advantages of the above approach it is worthwhile looking at the wider benefits of such an approach. From a practical perspective, Schwalbe (2006) suggests this type of adaptive approach seems to be more suitable for smaller scale Information Technology (IT) or software projects as it allows requirements to be managed within an iterative framework, when compared to a phased life cycle approach such as the waterfall methodology. Furthermore, an approach similar to above would present the following advantages:
⢠More flexible responding to changes associated with technology or user requirements.
⢠Achievement of milestones early in the project lifecycle and thus demonstrate earned value and other commercial benefits.
[image:62.612.141.513.476.680.2]7.4
Design methodology
7.4.1 Object-oriented approach
The chosen software design methodology for the project was an object-oriented approach. While the C# language implies an object-orientated approach, there still must be a desire by the programmer to maintain the principles of the object-oriented methodology irrespective of the chosen language.
Object-oriented programming presents a significant advantage in terms of dealing with one of the major problems associated with procedural programming. This problem in procedural programming occurs when changes made to parts of a program cause a cascading ripple effect throughout other parts of a program (Johnsonbaugh and Kalin 2000). Given that an incremental software development methodology was utilised for this project and therefore that major changes in software are likely to consistently occur throughout the software development process, the elimination of this issue through the adoption of an object-oriented approach is a significant advantage.
7.4.2 Human-computer interaction
In looking at the user interface or human design requirements of the project, Dix, Finally, Abowd and Beale (1998) provide some valuable guidance in suggesting that software and systems should be designed in such a way that people with specific tasks will want to use systems in a way that is seamless with respect to their everyday role. Undoubtedly, one of the major challenges in this project was around the need to include significant user driven functionality, without creating an environment that was too complex or daunting for either new or experienced users.
[image:64.612.179.474.391.597.2]Related to above, Mandel (1997) in suggesting that there will never be one perfect tool, and that visually sophisticated programs can get in the way, and hence distract users, further highlights the difficulty in creating a user interface that is suitable for a broad audience. Figure 7.4 below provides an illustration of the major categories that should be considered when designing a user interface.
While a number of the above attributes were considered, the primary considerations for the application developed were as follows:
⢠The available timeframe,
⢠The greater importance of functionality over user interface requirements,
⢠The assumption that the user of the âclientâ application would be relatively inexperienced.
7.5
Security
While the primary aim of this project is meet academic requirements, the consideration given to real world issues such as security and protection is still worthwhile. Additionally, when considering that variants of this application could potentially be deployed over Wide Area Networks (WANs), the need to consider security requirements early in the design phase is essential.
From a business and/or commercial perspective, Vachon and Graziani (2008) suggest that within any system there are three categories of security related vulnerabilities that will exist, namely: technological, configuration, and security policy weaknesses. In developing and deploying an application of this sort, the technological and configuration are the primary security considerations. Vachon and Graziani (2008) also suggest that the following items should be considered when looking at network security across an enterprise:
⢠Device hardening, ⢠Antivirus software, ⢠Personal firewalls, ⢠Software patches,
⢠Public/Private key encryption, ⢠Authentication,
⢠Virtual Private Networks (VPN).
that software security relates directly to software quality, then it can be assumed that utilising software that has been developed within a robust and appropriate methodology, will provide a degree of security. Furthermore, Pressman (2010) suggests that in order to build a secure system, a focus must be on quality, and therefore that a focus on eliminating architectural flaws rather than simply eliminating bugs must be pursued in development.
Building on the above, the security of the designed system is built on the following assumptions and considerations:
⢠The network on which the application resides will currently meet enterprise security requirements.
⢠The application has been developed within a robust development methodology.
⢠The incremental development methodology allowed for the early detection and correction of flaws, rather than a âdebugâ at the end of the development.
⢠Significant effort has gone into ensuring that user menus are intuitive, and can therefore only provide an approved range of choices to a user.
⢠Where a PC enters hibernation, the OS will require user authentication a âwakeâ time.
7.6
Implementation considerations and resources
As mentioned previously, the chosen development environment for is Microsoftâs Visual Studio. Although, typically an executable file developed from within this environment is fully portable and thus able to operate on any Windows based System, in the case of this project there are a number of other considerations.
The .NET framework contains the Common Language Runtime (CLR) and Base Class Libraries (BCL) that provide the majority of functionality and is required to be deployed to PCs that will operate the developed application. Furthermore, this framework should be a version that is compatible with the development environment.
The following paragraphs detail the other considerations and resources required to deploy and run the developed application:
⢠Microsoft .NET Framework 3.5 â The development environment is Visual Studio 2008, which is aligned with the .NET 3.5 framework.
⢠Dynamic Link Library (DLL) file(s) â These are the specific library files developed for the shared classes in the developed application.
⢠AUTOEXEC.BAT file â This is the plain text batch file that contains the run instructions for the developed application.
⢠Executable file(s) â The actual client or server application file(s).
Chapter 8.
Program outline
8.1
Introduction
[image:69.612.187.463.332.549.2]The following sections within this chapter describe the key features, functions and operation of the PowerMan client and server applications. As outlined previously, the core function of the applications is to manage the transitions between the S0 to S5 states to reduce the power wastage of a PC. Figure 8.1 provides a high level illustration of the relationship between these states.
Figure 8.1 â Transitions between sleeping and waking states
appropriate standard âsleepingâ state for the application the following issues and features were given consideration:
⢠Responsiveness â The time taken to return to normal operation from a sleeping state.
⢠Power Usage â The relative power usage between the sleeping states.
⢠Data Assurance â The ability of the state to protect system data should an unexpected event like a power failure occur.
⢠Sleep Functionality â The ability to be able to utilise wake timers or like in the sleep state.
⢠Wake-on-LAN Compatibility â The ability to be able to respond to a WoL magic packet in the sleep state.
Table 8.1 details the results of a comparative assessment used to determine the appropriate sleeping state for the application. The results were drawn from testing on a number of ACPI capable x86 Intel PCs.
Sleep State Feature
S3 (Standby) S4 (Hibernate) S5 (Full off)
Responsiveness fast medium Slow
Power Usage medium low Low
Data Assurance no full full
Sleep Functionality yes yes Some PCs
WoL Compatibility Yes yes Some PCs
Based on the results of the above assessment, the selected sleep state for the application was the âhibernateâ or S4 state which provided medium level responsiveness, low power usage, data assurance of âopenâ data, the ability to be able to respond to wake timers, and finally the ability to be able to respond to a WoL command.
8.2
PowerMan general outline
The PowerMan applications are essentially two separate applications operating independently but utilising a client-server communications link to provide both a localised and remotely controlled PC power management capability. This primitive client server relationship is illustrated in Figure 8.2 below.
Figure 8.2 â Basic client server diagram
Figure 8.3 below provides a high level illustration of the overall application model. From this it can be seen that the server hosts client(s) in a one to many relationship, while both applications share a number of purpose built classes held within the class library.
Figure 8.3 â High level application model
The general operation of the overall application sees the server application initialising first and from here âlisteningâ