0022-538X/05/$08.00
⫹
0
doi:10.1128/JVI.79.20.12969–12978.2005
Copyright © 2005, American Society for Microbiology. All Rights Reserved.
Isolation of Cell Lines That Show Novel, Murine Leukemia
Virus-Specific Blocks to Early Steps of Retroviral Replication
James W. Bruce,
1Kenneth A. Bradley,
2Paul Ahlquist,
1,3and John A. T. Young
4*
Institute for Molecular Virology, University of Wisconsin, Madison, Wisconsin 53706-1596
1; Department of Microbiology,
Immunology, and Molecular Genetics, University of California at Los Angeles, Los Angeles, California 90095
2;
Howard Hughes Medical Institute University of Wisconsin, Madison, Wisconsin 53706-1596
3; and
Infectious Disease Laboratory, The Salk Institute for Biological Studies,
La Jolla, California 92037
4Received 9 May 2005/Accepted 26 July 2005
In order to identify cellular proteins required for early stages of retroviral replication, a high volume
screening with mammalian somatic cells was performed. Ten pools of chemically mutagenized Chinese hamster
ovary (CHO-K1) cells were challenged with a murine leukemia virus (MLV) vector pseudotyped with the
vesicular stomatitis virus glycoprotein (VSV-G), and cells that failed to be transduced were enriched by cell
sorting. Each pool yielded a clonally derived cell line with a 5-fold or greater resistance to virus infection, and
five cell lines exhibited a >50-fold resistance. These five cell lines were efficiently infected by a human
immunodeficiency virus vector pseudotyped with VSV-G. When engineered to express the TVA receptor for
subgroup A avian sarcoma and leukosis virus (ASLV-A), the five cell lines were resistant to infection with a
MLV vector pseudotyped with the ASLV-A envelope protein but were fully susceptible to infection with an
ASLV-A vector. Thus, the defect in these cells resides after virus-cell membrane fusion and, unlike those in
other mutant cell lines that have been described, is specific for the MLV core. To identify the specific stages
of MLV infection that are impaired in the resistant cell lines, real-time quantitative PCR analyses were
employed and two phenotypic groups were identified. Viral infection of three cell lines was restricted before
reverse transcription; in the other two cell lines, it was blocked after reverse transcription, nuclear localization,
and two-long terminal repeat circle formation but before integration. These data provide genetic evidence that
at least two distinct intracellular gene products are required specifically for MLV infection. These cell lines are
important tools for the biochemical and genetic analysis of early stages in retrovirus infection.
The retroviral life cycle is a multistep process, divided into
early and late stages (reviewed in reference 8). The early stages
consist of virus binding to a cellular receptor, fusion of viral
and cellular membranes, delivery of the viral core into the
cytoplasm, reverse transcription of the positive-strand RNA
genome to generate a doubled-stranded DNA product,
trans-location of viral nucleoprotein complexes to the nucleus, and
integration of the viral DNA into the host cell genome to
generate a provirus. Interaction of the viral envelope protein
(Env) with cellular receptors is the primary determinant for
retroviral entry (reviewed in reference 8). However, the events
that occur following virus-cell membrane fusion and that lead
to proviral DNA establishment, especially those involving
cel-lular factors, are only partially understood (18). Celcel-lular
fac-tors other than recepfac-tors that have been implicated as playing
important roles at distinct early steps of retroviral replication
include actin, microtubules, importin-7, HMGa1, LAP-2
␣
and
the barrier-to-autointegration factor (9, 11, 14, 28, 40). A
pu-tative serine kinase that phosphorylates murine leukemia virus
(MLV) p12 has also been implicated in cytoplasm-to-nucleus
transport of that virus (44, 45). Yet other cellular factors,
including Fv-1, Trim-5
␣
, and APOBEC3G, act to restrict the
early steps of retroviral replication (3, 4, 36, 38).
It is likely that other, as-yet-unidentified cellular factors
con-tribute to other steps of retroviral replication. Indeed, a
re-cently described cell-free uncoating assay has implicated
cel-lular factor involvement in the uncoating step of retroviral
infection which occurs immediately after membrane fusion and
leads to the formation of an active reverse transcription
com-plex (31). Moreover, the involvement of multiple cellular
fac-tors is consistent with the dynamic nature of the reverse
tran-scription complex during the progression of infection (12, 13).
Genetic studies have also implicated cellular factors as playing
a positive role in early stages of retroviral infection. Two lines
of chemically mutagenized Rat-2 fibroblast cell lines (R3-2 and
R4-7) were identified under negative selection conditions
fol-lowing multiple rounds of challenge with a mixture of
ampho-tropic and ecoampho-tropic MLV vectors (17). Cell line R3-2 was
approximately 1,000-fold resistant to infection by these vectors,
a defect that mapped to a stage following reverse transcription
but before nuclear localization (17). Cell line R4-4 was
approx-imately 100-fold resistant to infection by these vectors, and the
block in this cell line occurred before the earliest step of
reverse transcription (17). The defects in cell lines R3-2 and
R4-4 were judged to be common to all retroviruses, since these
cell lines restricted the early steps of entry by MLV and human
immunodeficiency virus type 1 (HIV-1) vectors (17). Two
cDNAs that complement the defect in cell line R4-4 have been
isolated. One cDNA represents an antisense transcript to the
transcriptional coactivator CAPER, and the other is a sense
transcript of the central portion of the VL30 endogenous
ret-* Corresponding author. Mailing address: Infectious Disease
Labo-ratory, The Salk Institute for Biological Studies, 10010 North Torrey
Pines Road, La Jolla, CA 92037. Phone: (858) 453-4100. Fax: (858)
554-0341. E-mail: [email protected].
12969
on November 8, 2019 by guest
http://jvi.asm.org/
rovirus-like element. Since neither of these cDNAs is predicted
to give rise to a protein product, it is not yet clear how they
exert their complementing effects (16).
In an attempt to identify other cellular factors that
partici-pate in the early steps of retroviral replication, we have
em-ployed a high-throughput somatic cell mutagenesis-based
ap-proach. This approach involved mutagenizing Chinese hamster
ovary (CHO-K1) cells with the frameshift mutagen ICR-191
and subjecting the cells to multiple rounds of challenge with an
MLV vector that was pseudotyped with the vesicular stomatitis
virus glycoprotein (VSV-G). After each round of infection, the
cells were subjected to either fluorescent or magnetic sorting,
leading to single-cell cloning. This screening led to the
isola-tion of two classes of mutant cell lines that have a defect that
lies either upstream of reverse transcription or appears to lie
downstream of nuclear localization but before proviral DNA
establishment. These data suggest a role for novel cellular
proteins in facilitating MLV-specific early steps of replication.
MATERIALS AND METHODS
Cell culture and virus production.CHO-K1 cells (ATCC CCL-61) were cul-tured in F-12 medium supplemented with 10% bovine calf serum (Invitrogen, Carlsbad, CA). Human embryonic kidney 293T cells (ATCC CRL-11268) were cultured in Dulbecco’s modified Eagle medium (DMEM) supplemented with 10% fetal calf serum (HyClone, Logan, UT). Chicken DF-1 cells (ATCC CRL-12203) were cultured in DMEM supplemented with 10% fetal calf serum (Hy-Clone, Logan, UT). MLV pseudotyped viruses were generated as previously described (5, 21). Briefly, 293T cells were transfected by the calcium phosphate
method with 4g of the appropriate packageable vector plasmid, 3g of a
plasmid (pmd.oldgagpol) encoding MLV Gag/Pol, and 1g of plasmid encoding
either the vesicular stomatitis virus glycoprotein or EnvA (pMD VSV-G or pAB6, respectively). The VSV-G-pseudotyped HIV vector was made using a Virapower kit (Invitrogen, Carlsbad, CA) following the manufacturer’s instruc-tions. DF-1 cells were transfected using the calcium phosphate method with the subgroup A-specific avian sarcoma and leukosis virus (ASLV-A) vector, RCASBP(A)-AP, encoding alkaline phosphatase (15). Medium from transfected cells was collected 2 days posttransfection to 7 days posttransfection and filtered
through a 0.45-m bottle top filter. Virus was stored at 4°C through the
collec-tion period, combined, and then frozen at⫺80°C for long-term storage. Virus for
use in quantitative PCR (QPCR) amplification studies was treated with DNaseI (Roche Applied Science, Indianapolis, IN) to remove contaminating plasmid DNA from the virus preps. DNaseI was added as a powder (to a final
concen-tration of 1g/ml) when the virus-containing supernatants were collected. The
supernatants were incubated 1 h at room temperature before filtration. The titer of VSV-G and EnvA vector stocks were determined by assaying for transduction of a marker gene following infection of either wild-type (WT) CHO-K1 cells or WT CHO-K1 cells that had been engineered to express TVA800 (described below). Calculations of the multiplicity of infection (MOI) were based on the number of transducing units observed with infection of WT CHO-K1 cells, with or without TVA800 expression.
Plasmids.The MLV genome plasmids pMMP-nls-LacZ (encoding -galacto-sidase), pCMMP-eGFP (encoding the enhanced green fluorescent protein [eGFP]), and pCMMP-IRES-GFP and the subgroup A ASLV (ASLV-A) ge-nome plasmid RCASBP(A)-AP (encoding alkaline phosphatase) have been pre-viously described (5, 15, 29). To construct the pCMMP-CD4-eGFP vector, a NotI-to-PstI fragment with the CD4 gene deleted for the cytoplasmic tail from pMACS4.1 (Miltenyi Biotec Inc., Auburn, CA) was inserted into the NotI/PstI sites downstream of the viral long terminal repeat (LTR) and upstream of the encephalomyocarditis virus internal ribosome entry site (IRES) in pCMMP-IRES-GFP. The HIV-1 vectors were derived from the pLenti6/V5-GW/lacZ vector (Invitrogen, Carlsbad, CA). The HIV-HcRED vector was constructed by inserting into the BamHI/EcoRV sites of pLenti6/V5-GW/lacZ the multiple cloning site and IRES from pCMMP-IRES-GFP as a BamHI/BspEI fragment upstream of an AgeI/StuI fragment containing the HcRED coding sequence from pHcRED1 (Clontech, Palo Alto, CA). To generate the pHIV-TVA800-hcRED vector, the coding sequence of TVA800 was excised from pCMMP-TVA800 (30) as a PmlI/SalI fragment and inserted into the EcoRV/SalI sites of the HIV-HcRED vector upstream of the IRES.
Mutagenesis of CHO-K1 cells.Ten pools of 1⫻106CHO-K1 cells were
mutagenized by ICR-191 treatment (10g/ml) as described previously (6). Each
pool was subjected to three rounds of mutagenesis before screening.
Isolation of MLV-resistant cells by fluorescence-activated cell sorting (FACS).
Two pools (numbers 1 and 4) of 1⫻106
mutagenized CHO-K1 cells were infected with CMMP-eGFP[VSV-G] at an approximate MOI of 3 to 5 GFP
transducing units (GTU) for 2 h at 37°C in the presence of 4g/ml Polybrene
(Sigma-Aldrich, Inc., St. Louis, MO). The virus-containing medium was then removed and replaced with fresh medium. Forty-eight hours postinfection (hpi), the cells were trypsinized and resuspended in medium, and GFP-negative cells were isolated using a FACSvantage high-speed cell sorter (Becton Dickinson, San Jose, CA). Cells were allowed to recover (typically for 24 to 48 h) and
expanded as necessary to a level that was greater than or equal to 1⫻106cells.
The viral challenge and sorting was repeated until there was an observable resistance to infection in the sorted pools based on the level of GFP fluorescence obtained relative to a control population of unmutagenized cells. This required seven rounds of selection for pool 1 and six rounds of selection for pool 4. Once resistance was observed, a final infection and sorting was performed, and GFP-negative cells were single-cell cloned. Each of these clonal cell lines was then divided into two aliquots; one was uninfected, and the other was infected with CMMP-EGFP[VSV-G] at an approximate MOI of 3 to 5 GTU. The virus-resistant clones were identified as GFP negative following viral challenge, and the corresponding cell clone in the uninfected plate was expanded for further characterization.
Isolation of MLV-resistant cells by magnetic cell sorting (MACS).Eight pools
(pools 2, 3, and 5 to 10) of 2⫻107mutagenized CHO-K1 cells were infected with
CMMP-CD4-EGFP[VSV-G] at an approximate MOI of 1 GTU for 2 h at 37°C
in the presence of 4g/ml Polybrene. Unbound viruses were then removed, and
fresh medium was added. At 48 h postinfection, the cells were removed from the plate with phosphate-buffered saline (PBS) containing 5 mM EDTA. Cells were
pelleted (200⫻g, 5 min), resuspended in 500l of PBS containing 2 mM EDTA
and 2% bovine serum albumin (BSA) (Sigma-Aldrich, Inc., St. Louis, MO), and incubated with anti-human CD4 iron-conjugated antibody (Miltenyi Biotec Inc.,
Auburn, CA) at 20g/107
cells for 15 min at 4°C. Large-cell columns (Miltenyi Biotec Inc., Auburn, CA) were applied to a magnetic field and washed with 2 ml
PBS containing 2 mM EDTA and 2% BSA. Cells were filtered through a 30-m
mesh (Miltenyi Biotec Inc., Auburn, CA) and applied to the large-cell column. Cells were washed twice with 2 ml PBS containing 2 mM EDTA and 2% BSA. Column flowthrough and washes were collected, and the cells were pelleted, resuspended in medium, and replated. Cells were allowed to recover for at least 16 h before the next viral challenge. When necessary, the cells were expanded
between each round of virus infection to a minimum of 5⫻105
cells per sort. The infection and selections were repeated until there was an observable resistance to infection based on eGFP fluorescence in the selected cells relative to a control population of unmutagenized CHO-K1 cells. This varied from five to seven rounds depending on the pool. Once resistance in a pool was observed, the population was infected a final time with CMMP-CD4-EGFP[VSV-G], and the GFP-negative cells were single-cell cloned after high-speed FACS.
Screening MLV-resistant clones.Single-cell clones from pools 2, 3, and 5 to 10 were plated on duplicate plates and incubated for 2 h with pMMP-nls-LacZ [VSV-G] at an approximate MOI of 1 LacZ transducing unit (LTU) in the
presence of 4g/ml Polybrene. Unbound virus was then removed, and fresh
medium was added. At 48 h postinfection, one plate was assayed for
-galacto-sidase activity with a Galacto-Star chemiluminescent kit (Applied Biosystems, Foster City, CA) according to the manufacturer’s instructions, and the other plate was assayed for cell number and cell viability by using CellTiter-Glo reagent (Promega, Madison, WI) following the manufacturer’s instructions.
Chemiluminescent assay of viral infection.Eight wells of a 96-well plate were
seeded at 1⫻104
cells/well for each cell line tested. The cells were incubated for 2 h with an approximate MOI of 1 LTU of either MMP-nls-LacZ[VSV-G], MMP-nls-LacZ[EnvA], or Lenti6/V5-GW/lacZ [VSV-G], or an MOI of 1
alka-line phosphatase transducing unit of RCASBP(A)-AP, in the presence of 4g/ml
Polybrene. Unbound virions were removed, and fresh medium was added. At
48 h postinfection, four wells were assayed for either-galactosidase activity as
described above or for alkaline phosphatase activity [in the case of RCASBP(A)-AP infections] by using a Phospha-Light kit (Applied Biosystems, Foster City, CA) according to the manufacturer’s instructions. The other four wells were assayed for cell number and cell viability using CellTiter-Glo reagent (Promega, Madison, WI) as described above. In these experiments, the ratio of
-galactosidase or alkaline phosphatase to luciferase activity was calculated in
each case and compared to that seen with a control population of unmutagenized CHO-K1 cells to determine level of the resistance to viral infection. Under these
conditions, the control cells exhibited an approximately 50-fold increase in
on November 8, 2019 by guest
http://jvi.asm.org/
lactosidase:luciferase or alkaline phosphatase:luciferase ratios following infec-tion.
To determine the absolute level of resistance to viral infection, X-Gal
(5-bromo-4-chloro-3-indoyl--D[SCAP]-galactopyranoside) staining was performed
with cells that were infected with serial dilutions of viruses. For these
experi-ments, cells were seeded at 2⫻104cells/well in triplicate rows for each cell line
tested. The cells were then infected for 2 h with 10-fold serial dilutions of
MMP-nls-LacZ[VSV-G] in the presence of 4g/ml Polybrene as described
before, and the cells were subsequently stained with X-Gal as previously de-scribed (1). The blue cells contained in wells that had between 20 and 200
-galactosidase-positive cells were counted to give an accurate measure of the
viral titer.
TVA-expressing cell lines.Cells (1⫻106
) were seeded in a 6-cm dish and infected with HIV-1-TVA800-HcRED[VSV-G] at an approximate MOI of 0.5 hcRED transducing units for 2 h. Cells infected with this virus express TVA800, HcRED, and the blasticidin S resistance gene. Infected cells were selected for 2
weeks in the presence of 3g/ml blasticidin (Invitrogen, Carlsbad, CA).
Blasti-cidin-resistant clones were pooled, and TVA800 expression was confirmed by staining cells with an ASLV-A SU-immunoglobulin G immunoadhesin followed by flow cytometric analysis as previously described (47).
Real-time QPCR.To measure the amounts of reverse transcription
interme-diates in infected cells, cells were seeded in triplicate wells at 5⫻105/well in a
six-well plate and then infected at 4°C on a rocking platform at an MOI of 1 GTU for 2 h with an MLV vector (pLEGFP; Clontech, Palo Alto, CA) pseudotyped with VSV-G that was treated with DNaseI as described above. DNA was har-vested from infected cells at 24 hpi by using a DNeasy kit (QIAGEN, Valencia, CA). For the nuclear fractionation studies, nuclei were harvested from infected cells 24 hpi using a Nuclei EZ Prep kit (Sigma-Aldrich, Inc., St. Louis, MO) following the manufacturer’s instructions, and DNA was isolated from nuclei as described above. To measure integrated proviral DNA copy number, cells were seeded and infected as described above and then passaged for 10 days. DNA was
then harvested from 1⫻106infected cells as described above. To measure the
number of two-long terminal repeat (2LTR) circles, 1⫻106
cells were infected as described above at a MOI of 10 GTU. DNA was harvested 24 h postinfection. DNA concentration was calculated by measuring the A260 on a SPECTRAmax Plus 96-well UV spectrophotometer (Molecular Devices, Sunnyvale, CA). Quan-titative, real-time PCR (QPCR) was performed on an ABI 9600 (Applied Bio-systems, Foster City, CA) using the standard cycling conditions of 50°C for 10
min and 40 cycles of 95°C for 30 s and 60°C for 2 min. DNA (10l/25-l
reaction) was amplified in TaqMan Universal PCR Mastermix (Applied
Biosys-tems, Foster City, CA) with 1M concentrations of each primer and 0.1M 5⬘
6-carboxyfluorescein (6-FAM), 3⬘6-carboxytetramethylrhodamine
(TAMRA)-labeled probe. Each primer probe set was tested on each cell line in a minimum of three independent experiments. The number of molecules in each reaction was determined by a comparison to standard curves generated from amplifica-tion of plasmid DNA containing the target sequence. The primer probe set used
to determine if the screen virus had integrated into cells is OJWB7 (5⬘-GAAC
AGATGGTCCCCAGATGC-3⬘), OJWB8 (CGGTGGAACCTCCAAATGAA),
and OJWB21 (5⬘
-6-FAM-AAAAGAGCCCACAACCCCTCACTCGG-TAMRA-3⬘). Since the 3⬘LTR is replaced with the cytomegalovirus promoter in
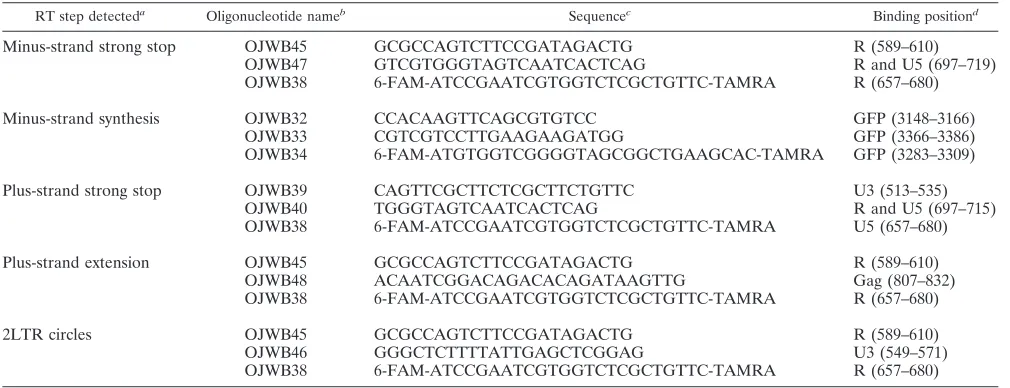
pCMMP-based vectors, this primer probe set will detect only reverse-transcribed viral ge-nomes and does not detect pCMMP genome plasmids or reverse-transcribed viral genomes derived from pLEGFP. Primers and probes used to identify specific reverse transcription intermediates are given in Table 1.
RESULTS
Isolation of cell lines resistant to retroviral infection.
FACS
and MACS approaches were employed to isolate cells that are
resistant to retroviral infection. Both approaches involved
sub-jecting chemically mutagenized CHO-K1 cells to infection with
a VSV-G-pseudotyped, replication-defective MLV vector. The
use of VSV-G-pseudotyped virions reduced the possibility of
identifying mutations that abolish receptor expression, since
VSV-G has been reported to bind to a ubiquitous
nonprotein-aceous receptor, potentially phosphatidylserine (32, 33). Ten
independent pools of CHO-K1 cells (pools 1 to 10) were
mu-tagenized with the alkylating agent ICR-191. This mutagen
induces frameshift and small deletions which have a low
rever-sion rate relative to point mutations (17, 26). CHO-K1 cells
were employed because they have been shown to be
function-ally hypodiploid, so that in most cases, only one copy of a gene
needs to be disrupted to exhibit a mutant phenotype (20).
Pools 1 and 4 of the mutagenized cells were challenged with
VSV-G-pseudotyped pCMMP-eGFP
(CMMP-eGFP[VSV-TABLE 1. Quantitative real-time PCR primer and probe sets for the detection of reverse transcription intermediates
RT step detecteda Oligonucleotide nameb Sequencec Binding positiond
Minus-strand strong stop
OJWB45
GCGCCAGTCTTCCGATAGACTG
R (589–610)
OJWB47
GTCGTGGGTAGTCAATCACTCAG
R and U5 (697–719)
OJWB38
6-FAM-ATCCGAATCGTGGTCTCGCTGTTC-TAMRA
R (657–680)
Minus-strand synthesis
OJWB32
CCACAAGTTCAGCGTGTCC
GFP (3148–3166)
OJWB33
CGTCGTCCTTGAAGAAGATGG
GFP (3366–3386)
OJWB34
6-FAM-ATGTGGTCGGGGTAGCGGCTGAAGCAC-TAMRA
GFP (3283–3309)
Plus-strand strong stop
OJWB39
CAGTTCGCTTCTCGCTTCTGTTC
U3 (513–535)
OJWB40
TGGGTAGTCAATCACTCAG
R and U5 (697–715)
OJWB38
6-FAM-ATCCGAATCGTGGTCTCGCTGTTC-TAMRA
U5 (657–680)
Plus-strand extension
OJWB45
GCGCCAGTCTTCCGATAGACTG
R (589–610)
OJWB48
ACAATCGGACAGACACAGATAAGTTG
Gag (807–832)
OJWB38
6-FAM-ATCCGAATCGTGGTCTCGCTGTTC-TAMRA
R (657–680)
2LTR circles
OJWB45
GCGCCAGTCTTCCGATAGACTG
R (589–610)
OJWB46
GGGCTCTTTTATTGAGCTCGGAG
U3 (549–571)
OJWB38
6-FAM-ATCCGAATCGTGGTCTCGCTGTTC-TAMRA
R (657–680)
a
The DNA intermediate of the MLV reverse transcription process that the primer/probe set detects.
b
Designation given to each primer in a primer/probe set. Sets are listed in the following order: plus-strand primer, minus-strand primer, probe. The OJWB38 probe binds on the plus strand, and the OJWB34 probe binds to the minus strand.
c
Sequence of the oligonucleotide written in the 5⬘-to-3⬘orientation. Oligonucleotides used as Taqman probes are modified with a 6-FAM fluorescent probe at the
5⬘end and a TAMRA quencher at the 3⬘end.
d
The functional elements of the viral genome the primer binds are denoted along with base pair position in the viral genome plasmid pLEGFP-C1. U3 is the unique
3⬘region of the viral LTR, U5 is the unique 5⬘region of the viral LTR, R is the repeat region of the LTR, and GFP correlates to the green fluorescent protein marker
gene.
on November 8, 2019 by guest
http://jvi.asm.org/
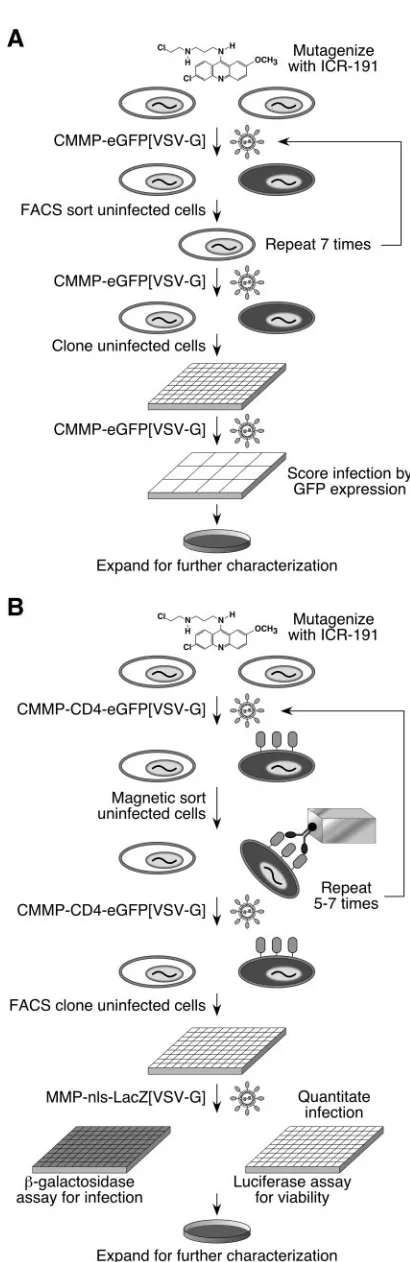
[image:3.585.42.547.80.274.2]G]), an MLV vector that encodes the eGFP, and the
eGFP-negative population (enriched for uninfected cells) was then
collected by FACS (Fig. 1A). This procedure was repeated
until there was an observable resistance to virus infection, and
single cell clones were isolated as described in Materials and
Methods. The most resistant clone from pool 1 (designated
mutant cell line 1 [MCL1]) and the most resistant clone from
pool 4 (designated MCL4) were characterized further (see
below).
The flow cytometric method, while useful for isolating
virus-resistant cells, was time-consuming and was not suitable for
screening the additional pools. Therefore, to screen the eight
remaining pools (2, 3, and 5 to 10), MACS was employed (Fig.
1B). In this approach, cells in each population were infected
with CMMP-CD4-eGFP[VSV-G], a VSV-G-pseudotyped
MLV vector that encodes the cell surface protein CD4 and
contained an IRES that allowed for translation of the eGFP.
Two days postinfection, the cells were incubated with an
anti-CD4 antibody that was conjugated to an iron moiety. The
infected cells were removed from the population by exposure
to a magnetic field. The infections and sorting were repeated
for 5 to 7 rounds until there was an observable resistance to
virus infection, and single cell clones of eGFP-negative cells
were isolated as described in Materials and Methods. This
approach gave rise to eight cell lines: MCL2, MCL3, and
MCL5 through MCL10 (from pools 2, 3, and 5 through 10,
respectively) (see below).
Characterization of the resistance to MLV infection in
iso-lated clones.
To measure the defects in infection seen with the
mutant cell lines, MCL1 to MCL10 were challenged with
VSV-G-pseudotyped pMMP-nls-LacZ (MMP-nls-lacZ[VSV-G], an
MLV vector that encodes

-galactosidase, and assayed 48 h
later for the virus-encoded

-galactosidase activity. Since these
studies involved a direct comparison between the levels of virus
infection
seen
in
mutagenized
versus
nonmutagenized
CHO-K1 cells, it was important to correct the data for any
differences in either the relative plating efficiencies or the
growth rates of the mutant cell types. This was accomplished by
incorporating a luciferase-based cell viability assay during the
analysis. Reconstruction experiments performed with
increas-ing numbers of CHO-K1 cells showed that the

-galactosidase
and luciferase signals that were obtained increased linearly
with the number of input cells (Fig. 2A and 2B). Therefore, in
the experiments described below, the data were normalized to
the number of cells in each population by dividing the

-ga-lactosidase signal by the luciferase signal (to give a ratio of the
amount of viral infection to relative cell number).
Infection of unmutagenized CHO-K1 cells gave rise to a
40-fold increase in the ratio of

-galactosidase to luciferase
(defined as 100%) (Fig. 3A). Each of the clones tested was
judged to be at least fivefold resistant to infection with
MMP-nls-LacZ[VSV-G] relative to WT CHO-K1 cells (Fig. 3A).
MCLs 1, 3, 4, 7, and 9 were
ⱖ
40-fold resistant to infection
(defined as background levels for this assay) and were
charac-terized further. MCL5 was 10-fold resistant to MLV, infection,
but this phenotype spontaneously reverted to WT after several
weeks in culture and therefore, given its instability, this cell line
was not further characterized.
In order to precisely determine the level of resistance in the
highly resistant cell lines, they were infected with serial
dilu-tions of MMP-nls-LacZ[VSV-G] and stained 48 hpi with
X-Gal. The resultant

-galactosidase-positive cells were counted,
and the relative infectious units per ml of virus stock were
calculated for each cell line (Fig. 3B). The average resistance
to MLV infection for each cell line was 1,100-fold for MCL1,
50-fold for MCL3, 130-fold for MCL4, 230-fold for MCL7, and
43-fold for MCL9 (Fig. 3B).
Resistance to infection is specific to the MLV core.
We next
asked if the resistance was specific to MLV or common to
other retroviruses. To address this question, cells were infected
with MMP-nls-LacZ[VSV-G] or with Lenti6/V5-GW/lacZ
[VSV-G], an HIV-1 vector encoding

-galactosidase. As
ex-pected, MCLs 1, 3, 4, 7, and 9 were at least 40-fold resistant to
MLV infection, as seen before (Fig. 4A). However, each of
these cell lines showed no obvious defect in their susceptibility
to infection by the HIV-1 vector (Fig. 4A). Since both the
MLV and the HIV-1 vectors used in these experiments
con-tained VSV-G, these data demonstrated that the defects in
these cells are not linked to the viral glycoprotein but instead
map specifically to the core of the MLV vector. To address this
issue more thoroughly, the MCLs were engineered to express
TVA800, the cellular receptor for ASLV-A (2, 43). The
TVA800-expressing cells were resistant to infection by MLV
vectors pseudotyped with VSV-G or with the ASLV-A Env
(EnvA) (Fig. 4B). However, the TVA-expressing cells were
fully susceptible to infection with an ASLV-A vector that
en-codes heat-stable alkaline phosphatase (Fig. 4B). These data
confirmed that the resistance in these cell lines is independent
of viral envelope/receptor interactions and is specific for MLV
cores.
The mutant cell lines exhibit defects either at pre- or
post-reverse transcription steps.
A real-time QPCR analysis
re-vealed that, despite multiple rounds of challenge with an MLV
vector during the screening process, MCLs 1, 3, 4, 7, and 9 did
not contain integrated viral DNA (Fig. 5A). Therefore, these
data indicated that these mutant cell lines were deficient at
supporting an early step of MLV replication prior to
integra-tion. To determine whether the defects in these cells lie
up-stream or downup-stream of specific stages during reverse
tran-scription, additional QPCR experiments were performed.
The primer/probe sets used in these experiments recognize
(in temporal order) the minus-strand strong stop (–SSS),
elon-gated minus strand (minus strand), plus-strand strong stop
(
⫹
SSS), and the plus-strand extension product after the
sec-ond-strand transfer event (plus strand). Each primer/probe set
recognizes the specific temporal reverse transcription step and
will also amplify reverse transcription products from
subse-quent steps. Primer sets were chosen to amplify the specific
reverse transcription intermediates based on hybridization to
different regions of the viral genome (19, 42). Primers used to
detect –SSS products hybridized to the viral repeat (R) and
unique 5
⬘
(U5) regions, those that detected minus strand
elon-gation hybridized to the GFP coding sequence, those that
detected products after the first-strand transfer (
⫹
SSS)
hybrid-ized to the viral unique 3
⬘
(U3) and U5 regions, and those that
detected products after the second strand transfer hybridized
to the viral R and Gag regions (Table 1). To reduce the
de-tection of plasmid DNA from the viral stocks, the virus stocks
were treated with DNaseI, and cells were washed twice after
infection. MCLs 1, 3, and 9 exhibited 10-fold, 20-fold, and
on November 8, 2019 by guest
http://jvi.asm.org/
FIG. 1. Two approaches used to isolate mutagenized CHO-K1 cell
lines resistant to retroviral infection. (A) Isolation of MLV resistant
cells by FACS. CHO-K1 cells mutagenized with ICR-191 were infected
with a VSV-G-pseudotyped MLV vector that encodes eGFP, and the
FIG. 2. The

-galactosidase-based infection assay and the
lucif-erase-based cell viability assay display a linear dependence upon cell
number. Cells were plated for 24 h and then challenged with 8
⫻
10
4LTU of MMP-nls-lacZ[VSV-G]. The cells were assayed 48 h
postin-fection with (A) a CellTiter-Glo kit (Promega, Madison, WI), which
measures the viability of infected cells by measuring cellular ATP as a
substrate for luciferase, or (B) a Galacto-star chemiluminescent

-ga-lactosidase assay (Applied Biosystems, Foster City, CA). Uninfected
controls were assayed 72 h after plating. The data shown are the
average mean values obtained in an experiment with quadruplicate
samples and are representative of results of three independent
exper-iments. Error bars indicate the standard deviations of the data.
resultant eGFP-negative cells were collected by FACS. After a
mini-mum of five rounds of infection and sorting, the eGFP-negative cells
were single-cell cloned, expanded into 12-well plates, and assayed for
resistance to infection by infection by the pseudotyped MLV vector.
(B) Isolation of MLV-resistant cells by MACS. CHO-K1 cells
mu-tagenized with ICR-191 were infected with a VSV-G-pseudotyped
MLV vector that encodes both CD4 and eGFP. Infected cells were
depleted from the population by magnetic sorting with an
iron-conju-gated anti-CD4 antibody. After a minimum of five rounds of infection
and sorting, the eGFP-negative cells were single-cell cloned, expanded,
and seeded into duplicate assay plates. The assay plates were infected
with another VSV-G-pseudotyped MLV vector that encodes

-galac-tosidase. One plate was then assayed with a chemiluminescent assay
for

-galactosidase, and the other plate was assayed with a
luciferase-based chemiluminescent viability assay.
on November 8, 2019 by guest
http://jvi.asm.org/
20-fold fewer –SSS products, respectively, than WT CHO-K1
cells (Fig. 5B). Minus-strand (Fig. 5C) and
⫹
SSS (Fig. 5D)
reverse transcription products were at background levels in cell
lines 1, 3, and 9. The final reverse transcription products
ac-cumulated to levels 50-fold lower than WT in these three cell
lines (Fig. 5E). These data indicate that MLV does not
un-dergo efficient reverse transcription in MCLs 1, 3, and 9. In
contrast, MCL4 and MCL7 contained WT or greater levels of
reverse transcription products with all four primer/probe sets,
indicating that there is no defect in their ability to support
reverse transcription (Fig. 5).
MCL4 and MCL7 support movement of the MLV reverse
transcription complex to the nucleus but fail to integrate
MLV.
To determine if viral DNA is localized to the nucleus for
either cell line, MCL4 or MCL7, infections were performed,
nuclei were isolated, DNA was extracted, and QPCR was
per-formed. Late reverse transcription products were detected in
the nuclei of these cells at levels equal to or greater than the
levels detected for WT CHO-K1 cells (Fig. 6A). By contrast,
no nuclear reverse transcription products were detected with
MCL1, as predicted, since this cell line does not give rise to
reverse transcription products. The reason for the increase in
reverse transcription products in MCL4 and MCL7, which was
observed with all primer/probe sets (Fig. 5 and 6A), is
un-known, but the increase is highly reproducible, suggesting that
it is caused by the mutation which blocks MLV infection. It
may be that the incoming genome is trapped in the nucleus in
a form that is slightly more stable than in WT cells.
FIG. 3. Resistance of isolated cell lines to infection by a
VSV-G-pseudotyped MLV vector. (A) Cells (1
⫻
10
4/well of a 96-well plate) of
the indicated cell lines were infected with 5
⫻
10
4IU of
MMP-nls-lacZ[VSV-G] and assayed 48 h postinfection with chemiluminescent
assays for

-galactosidase and viability as described for Fig. 2. (B) Cells
(1
⫻
10
4/well) of the indicated cell lines were infected with different
concentrations of MMP-nls-lacZ[VSV-G] and stained 48 h
postinfec-tion with X-Gal. The data shown are the average mean values obtained
in an experiment with triplicate samples and are representative of
results of three independent experiments. Error bars indicate the
stan-dard deviations of the data.
FIG. 4. Resistance to retroviral infection is specific to the MLV
core. (A) Cells (1
⫻
10
4/well of a 96-well plate) of the indicated cell
lines were infected with either 5
⫻
10
4IU (LTU) of MMP-nls-lacZ
[VSV-G] or 5
⫻
10
4IU of a VSV-G-pseudotyped HIV-1 vector that
encodes

-galactosidase (Lenti6/V5-GW/lacZ [VSV-G]) and assayed
48 h postinfection with chemiluminescent assays for

-galactosidase
and for viable cells as described for Fig. 2. (B) Cells (1
⫻
10
4/well of a
96-well plate) of WT CHO-K1 or the indicated cell lines engineered to
express TVA800 were infected with either 5
⫻
10
4IU (LTU) of the
MLV vectors MMp-nls-LacZ[VSV-G], 5
⫻
10
4IU of pMMp-nls-Lac
Z[envA], or the ASLV-A vector RCASBP(A)-AP and assayed 48 h
postinfection with chemiluminescent assays for cell viability and either

-galactosidase or alkaline phosphatase. TVA-expressing cell lines are
designated with a T after the line name. The data shown are the
average mean values obtained in an experiment with quadruplicate
samples and are representative of results of three independent
exper-iments. Error bars indicate the standard deviations of the data.
on November 8, 2019 by guest
http://jvi.asm.org/
FIG. 5. Production of reverse transcription intermediates in resistant cell lines. (A) DNA was harvested from infected and uninfected cells
(5
⫻
10
5/well of a six-well plate) of the indicated cell lines. QPCR was performed using a primer/probe set that recognizes the first-strand transfer
(
⫹
SSS) reverse transcription intermediate of the MLV genome that was used in the initial screen. (B to E) Cells (5
⫻
10
5/well of a six-well plate)
of the indicated cell lines were infected with 5
⫻
10
5IU of LEGFP[VSV-G] at 4°C for 2 h. Total DNA was harvested at 0 hpi and 24 hpi. DNA
concentration was quantitated by A260, and QPCR was performed using primer/probe sets that recognize the (B) minus-strand strong stop,
(C) minus strand, (D) first-strand transfer (
⫹
SSS) products, and (E) second-strand transfer (plus strand) reverse transcription intermediates. The
numbers of DNA molecules were determined by comparison to a standard curve generated from serial dilutions of plasmid DNA. The data shown
are the average mean values obtained in an experiment with triplicate samples and are representative of results of three independent experiments.
Error bars indicate the standard deviations of the data.
on November 8, 2019 by guest
http://jvi.asm.org/
To determine if the viral DNA in MCL4 and MCL7 is
accessible to the interior of the nucleus, we exploited the fact
that viral DNA that is localized to the nucleus can be
circular-ized by cellular enzymes into integration incompetent products
known as 2LTR circles (34, 35). The formation of 2LTR circles
has been used as a marker for the exposure of viral reverse
transcription products to the interior of the nucleus (10, 17,
25). To test if the reverse transcription products in MCL4 and
MCL7 get imported to the interior of the nucleus, cells were
infected and QPCR amplification was used to measure the
amount of viral 2LTR circular DNA that was produced. Cell
lines 4 and 7 had close to WT levels of 2LTR circles, while cell
line 1, which does not make reverse transcription products, had
only 6% of the WT levels of 2LTR circles (Fig. 6B). These data
suggest that reverse transcription products synthesized in cell
lines 4 and 7 are transported to the interior of the nucleus. To
determine if the cell lines could support integration, cells were
infected and then passaged for 10 days. Since episomal
retro-viral DNA is not maintained with cell division, only integrated
viral DNA would be predicted to remain after 10 days (41, 46).
All of the cell lines had at least 50-fold fewer molecules of
integrated viral DNA than WT cells (Fig. 6C). These data
suggest that the majority of resistance to MLV in cell lines 4
and 7 is due to the failure of nuclear localized viral DNA to
integrate into the host genome. Taken together, the data
strongly suggest that the resistance to infection in cell lines 4
and 7 is due to a failure of MLV to integrate into the genomes
of these cells.
DISCUSSION
We have employed a high-throughput screening method
with chemically mutagenized CHO-K1 cells that has led to the
identification of mutant cell lines that exhibit novel blocks to
the early steps of retroviral infection. These effects were
spe-cific for the MLV core and were not noted with HIV-1 or
ASLV vectors. These cell lines fall into two distinct phenotypic
groups.
Members of the first group, consisting of MCL1, MCL3, and
MCL9, appear to have a defect in uncoating, since they are
impaired in supporting the earliest steps of MLV-specific
verse transcription. Indeed, the impairment in initiating
re-verse transcription is sufficient to explain the MLV resistance
in MCL3 and MCL9. In the case of MCL1, the cell line exhibits
an
⬃
1,100-fold resistance to MLV infection, and at least
50-fold of this effect is due to impaired reverse transcription. The
discrepancy between results of the reporter gene assay used to
determine infectivity and the QPCR results may be due, in
part, to an approximately sevenfold defect in this cell line in
transcription from the MLV LTR (data not shown). This
tran-scriptional defect, while not specific—it was also noted with the
FIG. 6. Nuclear localization and integration of reverse
transcrip-tion intermediates in resistant cell lines. (A) Cells (5
⫻
10
5/well of a
[image:8.585.78.248.72.596.2]six-well plate) of the indicated cell lines were infected as described for
Fig. 5, and nuclear DNA was harvested at 0 hpi and 24 hpi. QPCR was
performed using a primer/probe set that recognizes the second-strand
transfer reverse transcription intermediate. (B) Cells (5
⫻
10
6/6-cm
dish) of the indicated cell lines were infected with 5
⫻
10
6IU of
LEGFP[VSV-G]. DNA was harvested 24 hpi, and QPCR was
per-formed with a primer/probe set that recognizes 2LTR circles. (C) Cells
(5
⫻
10
5/well of a six-well plate) of the indicated cell lines were
infected with 5
⫻
10
5IU of pLEGFP[VSV-G]and passaged for 10 days
postinfection. Total DNA was isolated, and QPCR was performed
using a primer/probe set that recognizes the first-strand transfer
(
⫹
SSS) and subsequent reverse transcription intermediates. DNA
concentration was quantitated by A260, and number of DNA
mole-cules was determined by comparison to a standard curve generated
from serial dilutions of plasmid DNA. The data shown are the average
mean values obtained in an experiment with triplicate samples and are
representative of results of three independent experiments. Error bars
indicate the standard deviations of the data.
on November 8, 2019 by guest
http://jvi.asm.org/
cytomegalovirus promoter—likely contributes to the MCL1
resistance phenotype.
The second group, consisting of MCL4 and MCL7,
con-tained even higher levels (three- to fivefold) of reverse
tran-scription products relative to WT CHO-K1 cells. In these cells,
viral DNA was associated with the nucleus and 2LTR circular
viral DNA forms were produced, indicative of nuclear
trans-location. However, the viral DNA genomes failed to integrate
in these cells. The defects observed in the two distinct classes
of mutant CHO-K1 cells are also clearly different from those
described for two Rat-2 cell lines (R3-2 and R4-7) (17). Like
MCL1, MCL3, and MCL9, the R4-7 cell line exhibits a block to
initiation of reverse transcription. However, this defect is not
MLV specific, since a similar block to infection was seen with
an HIV-1 vector (17). Unlike MCL4 and MCL7, the R3-2 cell
line exhibits a block to nuclear translocation of viral
DNA-containing complexes, and again this effect is not
MLV-spe-cific, since it was also observed with an HIV-1 vector (17). It is
unlikely that the MLV-specific defects in MCL4 and MCL7
can be explained by mutations in the cellular factors
barrier-to-autointegration factor or HMGa1, since these factors
sup-port MLV and HIV-1 DNA integration (7, 22–24, 27, 37, 39,
40). Given these novel features, we anticipate that further
characterization of the mutant cell lines that are described in
this study will provide new insights into the role of viral-host
cell factor interactions in promoting the early steps of
retrovi-ral replication. Moreover, the high-throughput MACS assay
that is described in this report should prove useful for
screen-ing for cellular factors that help facilitate the early replication
events for a number of different viruses.
ACKNOWLEDGMENTS
We thank Jessica Bernestro
¨m for the screening of Pool 4 cells.
This work was supported by NIH training grant T32 CA009075 and
by NIH grants CA70810 (J.A.T.Y.) and CA22443 (P.A.)
REFERENCES
1.Adkins, H. B., S. C. Blacklow, and J. A. Young. 2001. Two functionally distinct forms of a retroviral receptor explain the nonreciprocal receptor interference among subgroups B, D, and E avian leukosis viruses. J. Virol.
75:3520–3526.
2.Bates, P., J. A. Young, and H. E. Varmus.1993. A receptor for subgroup A Rous sarcoma virus is related to the low density lipoprotein receptor. Cell
74:1043–1051.
3.Best, S., P. Le Tissier, G. Towers, and J. P. Stoye.1996. Positional cloning of
the mouse retrovirus restriction gene Fv1. Nature382:826–829.
4.Bieniasz, P. D.2004. Intrinsic immunity: a front-line defense against viral
attack. Nat. Immunol.5:1109–1115.
5.Boerger, A. L., S. Snitkovsky, and J. A. Young. 1999. Retroviral vectors preloaded with a viral receptor-ligand bridge protein are targeted to specific
cell types. Proc. Natl. Acad. Sci. USA96:9867–9872.
6.Bradley, K. A., J. Mogridge, M. Mourez, R. J. Collier, and J. A. Young.2001.
Identification of the cellular receptor for anthrax toxin. Nature414:225–229.
7.Chen, H., and A. Engelman.1998. The barrier-to-autointegration protein is
a host factor for HIV type 1 integration. Proc. Natl. Acad. Sci. USA95:
15270–15274.
8.Coffin, J. M., S. H. Hughes, and H. Varmus.1997. Retroviruses. Cold Spring Harbor Laboratory Press, Plainview, N. Y.
9.Dvorin, J. D., and M. H. Malim.2003. Intracellular trafficking of HIV-1 cores: journey to the center of the cell. Curr. Top. Microbiol. Immunol.
281:179–208.
10.Ellis, J., and A. Bernstein.1989. Retrovirus vectors containing an internal attachment site: evidence that circles are not intermediates to murine
ret-rovirus integration. J. Virol.63:2844–2846.
11.Engelman, A.2003. The roles of cellular factors in retroviral integration.
Curr. Top. Microbiol. Immunol.281:209–238.
12.Fassati, A., and S. P. Goff.2001. Characterization of intracellular reverse transcription complexes of human immunodeficiency virus type 1. J. Virol.
75:3626–3635.
13.Fassati, A., and S. P. Goff.1999. Characterization of intracellular reverse
transcription complexes of Moloney murine leukemia virus. J. Virol. 73:
8919–8925.
14.Fassati, A., D. Gorlich, I. Harrison, L. Zaytseva, and J. M. Mingot.2003. Nuclear import of HIV-1 intracellular reverse transcription complexes is
mediated by importin 7. EMBO J.22:3675–3685.
15.Federspiel, M. J., P. Bates, J. A. Young, H. E. Varmus, and S. H. Hughes.
1994. A system for tissue-specific gene targeting: transgenic mice susceptible to subgroup A avian leukosis virus-based retroviral vectors. Proc. Natl. Acad.
Sci. USA91:11241–11245.
16.Gao, G., and S. P. Goff.2004. Isolation of suppressor genes that restore
retrovirus susceptibility to a virus-resistant cell line. Retrovirology1:30.
17.Gao, G., and S. P. Goff.1999. Somatic cell mutants resistant to retrovirus replication: intracellular blocks during the early stages of infection. Mol.
Biol. Cell10:1705–1717.
18.Goff, S. P.2001. Intracellular trafficking of retroviral genomes during the early phase of infection: viral exploitation of cellular pathways. J. Gene Med.
3:517–528.
19.Gotte, M., X. Li, and M. A. Wainberg.1999. HIV-1 reverse transcription: a brief overview focused on structure-function relationships among molecules
involved in initiation of the reaction. Arch. Biochem. Biophys.365:199–210.
20.Gupta, R. S., D. Y. Chan, and L. Siminovitch.1978. Evidence for functional hemizygosity at the Emtr locus in CHO cells through segregation analysis.
Cell14:1007–1013.
21.Landau, N. R., and D. R. Littman.1992. Packaging system for rapid pro-duction of murine leukemia virus vectors with variable tropism. J. Virol.
66:5110–5113.
22.Li, L., C. M. Farnet, W. F. Anderson, and F. D. Bushman.1998. Modulation of activity of Moloney murine leukemia virus preintegration complexes by
host factors in vitro. J. Virol.72:2125–2131.
23.Li, L., K. Yoder, M. S. Hansen, J. Olvera, M. D. Miller, and F. D. Bushman.
2000. Retroviral cDNA integration: stimulation by HMG I family proteins.
J. Virol.74:10965–10974.
24.Lin, C. W., and A. Engelman.2003. The barrier-to-autointegration factor is a component of functional human immunodeficiency virus type 1
preinte-gration complexes. J. Virol.77:5030–5036.
25.Lobel, L. I., J. E. Murphy, and S. P. Goff.1989. The palindromic LTR-LTR junction of Moloney murine leukemia virus is not an efficient substrate for
proviral integration. J. Virol.63:2629–2637.
26.MacInnes, M. A., U. Friedrich, T. van Daalen Wetters, and P. Coffino.1982. Quantitative forward-mutation specificity of mono-functional alkylating agents, ICR-191, and aflatoxin B1 in mouse lymphoma cells. Mutat. Res.
95:297–311.
27.Mansharamani, M., D. R. Graham, D. Monie, K. K. Lee, J. E. Hildreth, R. F. Siliciano, and K. L. Wilson.2003. Barrier-to-autointegration factor BAF binds p55 Gag and matrix and is a host component of human
immunodefi-ciency virus type 1 virions. J. Virol.77:13084–13092.
28.McDonald, D., M. A. Vodicka, G. Lucero, T. M. Svitkina, G. G. Borisy, M. Emerman, and T. J. Hope.2002. Visualization of the intracellular behavior
of HIV in living cells. J. Cell Biol.159:441–452.
29.Melikyan, G. B., R. J. Barnard, R. M. Markosyan, J. A. Young, and F. S. Cohen.2004. Low pH is required for avian sarcoma and leukosis virus Env-induced hemifusion and fusion pore formation but not for pore growth.
J. Virol.78:3753–3762.
30.Narayan, S., R. J. Barnard, and J. A. Young.2003. Two retroviral entry pathways distinguished by lipid raft association of the viral receptor and
differences in viral infectivity. J. Virol.77:1977–1983.
31.Narayan, S., and J. A. Young.2004. Reconstitution of retroviral fusion and
uncoating in a cell-free system. Proc. Natl. Acad. Sci. USA101:7721–7726.
32.Schlegel, R., T. S. Tralka, M. C. Willingham, and I. Pastan.1983. Inhibition of VSV binding and infectivity by phosphatidylserine: is phosphatidylserine
a VSV-binding site? Cell32:639–646.
33.Schlegel, R., M. C. Willingham, and I. H. Pastan.1982. Saturable binding sites for vesicular stomatitis virus on the surface of Vero cells. J. Virol.
43:871–875.
34.Shank, P. R., S. H. Hughes, H. J. Kung, J. E. Majors, N. Quintrell, R. V. Guntaka, J. M. Bishop, and H. E. Varmus.1978. Mapping unintegrated avian sarcoma virus DNA: termini of linear DNA bear 300 nucleotides
present once or twice in two species of circular DNA. Cell15:1383–1395.
35.Shank, P. R., and H. E. Varmus.1978. Virus-specific DNA in the cytoplasm of avian sarcoma virus-infected cells is a precursor to covalently closed
circular viral DNA in the nucleus. J. Virol.25:104–114.
36.Sheehy, A. M., N. C. Gaddis, J. D. Choi, and M. H. Malim.2002. Isolation of a human gene that inhibits HIV-1 infection and is suppressed by the viral
Vif protein. Nature418:646–650.
37.Shumaker, D. K., K. K. Lee, Y. C. Tanhehco, R. Craigie, and K. L. Wilson.
2001. LAP2 binds to BAF · DNA complexes: requirement for the LEM
domain and modulation by variable regions. EMBO J.20:1754–1764.
38.Stremlau, M., C. M. Owens, M. J. Perron, M. Kiessling, P. Autissier, and J. Sodroski.2004. The cytoplasmic body component TRIM5␣restricts HIV-1
infection in Old World monkeys. Nature427:848–853.
on November 8, 2019 by guest
http://jvi.asm.org/
39.Suzuki, Y., and R. Craigie.2002. Regulatory mechanisms by which barrier-to-autointegration factor blocks autointegration and stimulates intermolec-ular integration of Moloney murine leukemia virus preintegration
com-plexes. J. Virol.76:12376–12380.
40.Suzuki, Y., H. Yang, and R. Craigie.2004. LAP2␣and BAF collaborate to organize the Moloney murine leukemia virus preintegration complex.
EMBO J.23:4670–4678.
41.Weller, S. K., A. E. Joy, and H. M. Temin.1980. Correlation between cell killing and massive second-round superinfection by members of some
sub-groups of avian leukosis virus. J. Virol.33:494–506.
42.Whitcomb, J. M., and S. H. Hughes.1992. Retroviral reverse transcription
and integration: progress and problems. Annu. Rev. Cell Biol.8:275–306.
43.Young, J. A., P. Bates, and H. E. Varmus.1993. Isolation of a chicken gene
that confers susceptibility to infection by subgroup A avian leukosis and
sarcoma viruses. J. Virol.67:1811–1816.
44.Yuan, B., X. Li, and S. P. Goff.1999. Mutations altering the Moloney murine leukemia virus p12 Gag protein affect virion production and early events of
the virus life cycle. EMBO J.18:4700–4710.
45.Yueh, A., and S. P. Goff.2003. Phosphorylated serine residues and an argi-nine-rich domain of the Moloney murine leukemia virus p12 protein are
required for early events of viral infection. J. Virol.77:1820–1829.
46.Zack, J. A., S. J. Arrigo, S. R. Weitsman, A. S. Go, A. Haislip, and I. S. Chen.
1990. HIV-1 entry into quiescent primary lymphocytes: molecular analysis
reveals a labile, latent viral structure. Cell61:213–222.
47.Zingler, K., and J. A. Young.1996. Residue Trp-48 of Tva is critical for viral entry but not for high-affinity binding to the SU glycoprotein of subgroup A
avian leukosis and sarcoma viruses. J. Virol.70:7510–7516.
on November 8, 2019 by guest
http://jvi.asm.org/