The Impacts and Benefits of Structural Reforms
in the Transport, Energy and
Telecommunications Sectors in APEC
Economies
Prepared by:
Professor Christopher Findlay School of Economics
University of Adelaide
Adelaide, South Australia 5005
Produced for:
Asia-Pacific Economic Cooperation Policy Support Unit Asia-Pacific Economic Cooperation Secretariat
35 Heng Mui Keng Terrace Tel: (65) 6891-9500
Fax: (65) 6891-9690 Email: [email protected] Website: www.apec.org
APEC#211-SE-01.1
This work is licensed under the Creative Commons Attribution-NonCommercial-ShareAlike 3.0 Singapore License. To view a copy of this license, visit http://creativecommons.org/licenses/by-nc-sa/3.0/sg/.
TABLE OF CONTENTS
List of figures ... ix
List of tables... xii
List of boxes ... xvi
Acknowledgements ... xvii
Executive summary ... xviii
Infrastructure and structural reform ... xviii
Progress to date ... xix
Air transport ... xix
Rail transport ... xix
Road transport ... xx
Maritime transport ... xx
Electricity ... xxi
Gas ... xxii
Telecommunications ... xxii
The next steps and their effects ... xxiii
A stronger agenda for APEC ... xxiv
1 The impacts and benefits of structural reforms in the transport, energy and telecommunications sectors in APEC economies ... 1
1.1 Introduction ... 1
1.2 The structural reform framework ... 3
1.3 Structural reform of infrastructure industries ... 5
1.4 Sectoral progress and impacts ... 6
1.4.1 Transport ... 7
1.4.1.1 Air transport ... 7
1.4.1.2 Rail transport ... 9
1.4.1.3 Road transport ... 11
1.4.1.4 Maritime transport... 13
1.4.2 Energy ... 15
1.4.2.1 Electricity ... 15
1.4.2.2 Gas ... 18
1.4.2.3 Telecommunications ... 20
1.5 Ten lessons of reforms to date ... 23
1.5.1 Competition is more important than ownership ... 23
1.5.2 Take a forward looking view and provide a leadership commitment ... 23
1.5.3 Be aware of ‘the gap’ in regulatory practice ... 23
1.5.4 Know the costs of the current regime ... 24
1.5.5 The commitment to structural reform is continuous and never stops ... 24
1.5.6 Promoting engagement from within ... 25
1.5.7 The use of experiments ... 25
1.5.8 The value of independent evaluation for designing options ... 25
1.5.9 Coordination and when it matters ... 26
1.5.10 Universal service obligations ... 26
1.6 The next steps ... 26
1.6.1 Effects of further reform ... 26
1.6.3 The LAISR agenda ... 29
1.7 References ... 30
2 Modelling the benefits of structural reforms in APEC economies ... 31
2.1 Introduction ... 31
2.2 The reform agenda ... 32
2.2.1 Air transport ... 32
2.2.2 Maritime transport ... 34
2.2.3 Rail transport ... 36
2.2.4 Electricity ... 38
2.2.5 Gas ... 40
2.2.6 Telecommunications ... 41
2.3 Quantifying the first round effects of reform ... 45
2.3.1 Air and maritime transport ... 45
2.3.2 Rail transport ... 47
2.3.3 Electricity and gas ... 48
2.3.4 Telecommunications ... 50
2.3.5 Summary ... 51
2.4 Quantifying the economy- and region-wide effects of structural reforms ... 53
2.4.1 The economy- and region-wide effects of structural reforms ... 55
2.4.2 Putting the gains into perspective ... 58
2.4.3 Adjustment costs ... 59
2.5 Conclusion ... 63
2.6 References ... 66
3 Quantifying the impacts of structural reforms on international transport margins ... 69
3.1 Introduction ... 69
3.2 Data description ... 70
3.3 Determinants of transport costs ... 71
3.4 Estimating a model of transport costs ... 74
3.4.1 Determination of freight costs ... 74
3.4.2 Results ... 75
3.6 Conclusion ... 78
3.7 References ... 79
Annex 3 Figures A1–6 and Tables A1–5 ... 80
Data sources ... 81
4 Quantifying the impacts of structural reforms on air traffic flows in APEC economies ... 88
4.1 Introduction ... 88
4.2 Liberalisation of air services ... 89
4.3 Methodology and the policy indices ... 92
4.4 Impact of policy on traffic flows ... 99
4.5 Conclusion ... 101
4.6 References ... 102
5 Quantifying the benefits from structural reforms in railway transport markets in APEC economies ... 103
5.1 Introduction ... 103
5.2 Restructuring measures for the rail industry ... 105
5.2.1 The degree of vertical separation ... 105
5.2.2 Promotion of competition (horizontal dimension) ... 106
5.3 Literature review ... 107
5.4 Results ... 108
5.5 Conclusion ... 115
5.6 References ... 116
6 Quantifying the benefits from structural reforms in electricity and gas markets in APEC
economies ... 124
6.1 Introduction ... 124
6.2 Key features of electricity and gas markets ... 125
6.2.1 Electricity markets ... 125
6.2.2 Gas markets ... 126
6.3 The state of play in APEC economies ... 127
6.3.1 APEC electricity markets ... 128
6.3.2 APEC gas markets ... 129
6.4 The gains from reform – evidence to date ... 129
6.4.1 Qualitative evidence ... 129
6.4.2 Empirical evidence ... 131
6.5 New evidence on the gains from reform in electricity and gas markets ... 133
6.5.1 Analysis of electricity markets ... 134
6.5.2 Analysis of gas markets ... 137
6.6 Implications for APEC economies ... 140
6.7 References ... 142
Annex 6 Tables 6.2–6.12 ... 144
7 Quantifying the impacts of structural reforms in telecommunications markets in APEC economies ... 179
7.1 Introduction ... 179
7.2 State of play in the APEC telecommunications sector ... 181
7.2.1 Overview ... 181
7.2.2 Performance in the fixed-line telecommunications network ... 182
7.2.3 Performance in the mobile sector ... 184
7.3 Development in broadband accessibility ... 186
7.3.1 User penetration performance ... 187
7.3.2 Subscriber penetration performance ... 187
7.4 Market structure and access conditions ... 189
7.4.1 The fixed-line telecommunications sector ... 189
7.4.2 The mobile telecommunications sector ... 191
7.4.3 Summary ... 193
7.5 Regulatory reform underpinning structural reform ... 193
7.6 Quantifying the impact of reform ... 194
7.6.1 Impact at the sectoral level ... 194
7.6.1.1 Market entry and non-discrimination category ... 197
7.6.1.2 Pro-competition regulation category ... 197
7.6.2 Economy-wide effects ... 200
7.7 Conclusion ... 204
7.8 References ... 205
Annex 7 Policy index ... 207
8 Quantifying the impacts of regulatory reform in infrastructure on economic performance in APEC economies ... 209
8.1 Introduction ... 209
8.2 Modelling and data ... 210
8.3 Results and analysis ... 212
8.4 Conclusion ... 215
8.5 References ... 218
9 Air transport in Korea and Northeast Asia ... 219
9.1 Introduction ... 219
9.2 Domestic markets ... 219
9.3.1 Policy in Korea ... 221
9.3.2 Policies in China and Japan ... 222
9.4 Impact of Open Skies ... 223
9.5 Steps towards NEA market integration ... 226
9.6 Conclusion ... 227
9.7 References ... 229
10 Rail transport in New Zealand ... 230
10.1 Introduction ... 230
10.2 A short history of New Zealand rail to the 1990s ... 231
10.2.1 Building the railway, building the nation 1860 to the 1920s ... 231
10.2.2 The end of the golden age 1930 to the 1990s ... 231
10.3 Privatisation ... 234
10.4 The government returns to rail ... 238
10.5 Regulation, competition and structural reform ... 241
10.5.1 Minimal regulation ... 242
10.5.2 No barriers to entry ... 242
10.5.3 Structural integration favoured ... 244
10.6 The gap to best practice in structural reform ... 245
10.7 Where to now for rail in New Zealand? ... 246
10.7.1 Drivers for reform ... 246
10.7.2 Barriers to reform ... 246
10.7.3 Small steps to support reform ... 247
10.7.4 More questions than answers ... 247
10.8 Some lessons from the New Zealand experience ... 249
10.8.1 Rail-specific lessons ... 249
10.8.2 Structural reform lessons ... 250
10.9 References ... 251
11 Rail transport in Chile ... 254
11.1 Introduction ... 254
11.2 Chilean geography and the development of railroads ... 255
11.3 Reforms in Chile’s railroad industry ... 257
11.4 Regulation and performance of Chile’s railroad industry ... 259
11.4.1 The rationale for regulation in railroads... 259
11.4.2 Railroad regulation in Chile ... 260
11.4.3 Unregulated privatisation ... 261
11.4.4 Regulated concessions ... 262
11.4.5 Remnants of the past ... 264
11.5 Conclusion ... 265
11.6 References ... 266
12 Road transport in Thailand ... 267
12.1 Introduction ... 267
12.2 The role of Bangkok ... 267
12.3 Characteristics of the road transport industry ... 269
12.3.1 Passenger transport ... 270
12.3.1.1 Route licensing ... 271
12.3.1.2 Bus fare regulation ... 272
12.3.1.3 Van transport ... 274
12.3.2 Freight transport ... 276
12.3.3 International road transport ... 278
12.3.3.1 Thailand–Lao PDR ... 279
12.4 Multilateral agreements... 280
12.4.1 ASEAN Framework Agreement on Services ... 280
12.5 Value of coordination ... 286
12.6 Conclusion ... 287
12.7 References ... 288
13 Maritime transport in Australia ... 290
13.1 Introduction ... 290
13.2 Current regulatory framework ... 291
13.2.1 Shipping ... 291
13.2.2 Port infrastructure and related services ... 293
13.3 Forces for policy change ... 293
13.3.1 Coastal shipping ... 293
13.3.2 Shipping agreements ... 296
13.3.3 Infrastructure and related services ... 297
13.3.3.1 Container terminals ... 297
13.3.3.2 Bulk port terminals ... 303
13.3.4 Consequences of changes and scope for further reform ... 306
13.3.4.1 Coastal shipping ... 306
13.3.4.2 Shipping agreements ... 306
13.3.5 Infrastructure and related services ... 306
13.3.5.1 Container port terminals... 306
13.3.5.2 Bulk port terminals ... 307
13.4 Conclusion ... 308
13.5 References ... 309
Annex A13.1 Port regulatory regimes in various Australian states ... 311
Annex A13.2 Recent policy changes in maritime transport ... 312
14 Maritime transport in the United States ... 313
14.1 Introduction ... 313
14.2 The current regulatory framework ... 314
14.2.1 Shipping ... 314
14.2.1.1 International shipping ... 314
14.2.1.2 Domestic shipping cabotage ... 315
14.2.2 Port infrastructure and related services ... 316
14.3 Forces for policy change ... 317
14.3.1 Cargo preferences ... 317
14.3.2 Subsidy programs and the Jones Act ... 319
14.3.3 Port infrastructure and related services ... 324
14.3.3.1 Congestion in ports ... 324
14.3.3.2 Rail and road bottlenecks in port surroundings ... 325
14.4 Scope for further reform ... 326
14.4.1 Shipping ... 326
14.4.2 Port infrastructure and related services ... 327
14.5 Conclusion ... 329
14.6 References ... 331
Annex A14.1 Recent policy changes in maritime transport ... 333
15 Electricity in Korea ... 334
15.1 Introduction ... 334
15.2 Restructuring and reaction ... 335
15.2.1 Basic nature of the Korean model ... 336
15.2.2 Reform put on hold ... 337
15.2.3 Retail tariffs and cross-subsidisation ... 338
15.2.4 Emergence of district suppliers ... 339
15.3 Present status ... 340
15.4.1 Price trends ... 340
15.4.2 Trend of total power losses ... 341
15.4.3 Efficiency gains from restructuring? ... 341
15.5 Politics of reform ... 342
15.6 Conclusion ... 343
15.7 References ... 344
16 Electricity in Russia ... 345
16.1 Introduction ... 345
16.2 Electricity system in Russia ... 345
16.3 Policy reform ... 347
16.3.1 Ownership ... 349
16.3.1.1 Generation ... 349
16.3.1.2 Transmission ... 350
16.3.1.3 Distribution ... 350
16.3.2 Regulation ... 351
16.3.2.1 Independent power producers ... 351
16.3.2.2 Third party access ... 353
16.3.2.3 Wholesale electricity (capacity) market ... 353
16.3.2.4 Trade and interconnections ... 356
16.3.2.5 Industrial users choice ... 357
16.3.2.6 Residential choice ... 357
16.3.2.7 Consumer tariffs ... 357
16.3.2.8 Regulators ... 358
16.3.2.9 Universal service obligations and cross-subsidisation ... 360
16.3.3 Review of the implementation of reform ... 362
16.4 Conclusion ... 365
16.5 References ... 367
17 Gas in China ... 370
17.1 Introduction ... 370
17.2 Restrictions on entry ... 372
17.2.1 Production ... 372
17.2.2 Transmission ... 374
17.2.3 Distribution ... 375
17.3 Imports of gas ... 376
17.4 Price regulation ... 377
17.5 Universal service ... 378
17.6 Recent changes in policy ... 378
17.7 Conclusion ... 381
17.8 References ... 383
18 Gas in Thailand ... 385
18.1 Introduction ... 385
18.2 The current structure of the gas industry in Thailand ... 386
18.2.1 Domestic competition ... 386
18.2.2 Foreign commercial presence ... 387
18.2.3 Cross-border competition ... 387
18.3 Government policy ... 389
18.4 The regulatory regime ... 391
18.4.1 The institution ... 391
18.4.2 The regulatory rules ... 392
18.5 The performance of the Thai gas industry and PTT ... 393
18.5.1 The Thai gas industry ... 393
18.5.2 Gas price ... 394
18.6 Conclusion ... 395
18.7 References ... 397
19 Telecommunications in Chinese Taipei ... 398
19.1 Introduction ... 398
19.2 Licensing regime and market structure ... 399
19.2.1 Licensing regime ... 399
19.2.2 Market structure ... 402
19.3 Pro-competition regulations ... 403
19.3.1 Interconnection regime ... 403
19.3.2 Access to essential facilities ... 405
19.3.3 Universal service obligations ... 406
19.4 Assessment of performance ... 407
19.4.1 Accessibility and price ... 407
19.4.2 Quantitative assessment ... 410
19.5 Future challenges ... 410
19.5.1 Market dominance ... 410
19.5.2 Convergence ... 411
19.5.3 Competitive safeguards ... 411
19.5.4 Interconnection ... 412
19.5.5 Access to essential facilities ... 412
19.5.6 Universal service obligations ... 412
19.5.7 Allocation and use of spectrum and scarce resources ... 413
19.6 References ... 414
20 Telecommunications in Viet Nam ... 415
20.1 Introduction ... 415
20.2 Regulation and market structure ... 415
20.2.1 Private and foreign entry conditions ... 415
21.2.2 The Law on telecommunications ... 418
20.2.3 Licensing regime ... 418
20.2.4 Market structure ... 419
20.3 Pro-competition regulations ... 421
20.3.1 Overview and regulation of operators with significant market power ... 421
20.3.2 Interconnection regime ... 422
20.3.3 Universal service obligations ... 423
20.3.4 Allocation of spectrum ... 424
20.4 Assessment of performance ... 425
20.5 Conclusion ... 427
20.5.1 Continuing structural reform through market liberalisation ... 428
20.5.2 State dominance and the creation of an independent regulator ... 429
20.5.3 Reducing development disparity ... 429
20.6 References ... 432
21 Telecommunications in Papua New Guinea ... 433
21.1 Introduction ... 433
21.2 Historical background ... 433
21.2.1 Telikom PNG Ltd ... 434
21.2.2 PANGTEL ... 435
21.2.3 Independent Competition and Consumer Commission ... 435
21.2.4 Pacific Mobile Communications Ltd ... 436
21.2.5 Independent Public Business Corporation ... 436
21.1.6 Universal service obligations ... 436
21.3 Development of ICT policy ... 436
21.3.2 Multilateral policy restraints ... 439
21.3.3 Domestic restraints ... 440
21.4 The benefits from opening the mobile phone market ... 440
21.5 Locking-in policy through WTO commitments ... 442
21.6 Conclusion ... 442
21.7 References ... 444
22 Logistics in Indonesia ... 446
22.1 Introduction ... 446
22.2 The importance of efficient logistics to Indonesia ... 447
22.3 Benchmarking logistics’ current performance ... 450
22.4 National Logistics Blueprint ... 452
22.5 First steps ... 455
22.5.1 One-stop shop to facilitate investment ... 455
22.5.2 New funds for infrastructure ... 455
22.5.3 Changes to the negative list for investment ... 457
22.5.4 Six new economic development corridors ... 457
22.5.5 National Single Window implementation ... 458
22.5.6 Round-the-clock port services ... 459
22.6 Conclusion ... 459
LIST OF FIGURES
1 The impacts and benefits of structural reforms in the transport, energy and
telecommunications sectors in APEC economies ... 1
1.1 Summary of APEC economies’ implementation of the WTO regulatory principles ... 21
2 Modelling the benefits of structural reforms in APEC economies ... 31
2.1 Productivity improvements from structural reforms in air transport ... 47
2.2 Productivity improvements from structural reforms in maritime transport ... 47
2.3 Productivity improvements from structural reforms in rail transport ... 48
2.4 Productivity improvements from structural reforms in electricity ... 49
2.5 Productivity improvements from structural reforms in gas ... 50
2.6 Productivity improvements from structural reforms in telecommunications ... 51
2.7 Productivity improvements from structural reforms in transport, energy and telecommunications ... 52
2.8 Simple average tariffs on agriculture and food ... 52
2.9 Simple average tariffs on manufacturing ... 53
2.10 Welfare gains from structural reforms, relative to initial economic size ... 56
2.11 Gains in real GDP ... 56
2.12 Contribution to welfare from own and others’ structural reforms ... 57
2.13 Contribution to welfare from structural reforms in each sector ... 58
2.14 Deviation from baseline in sectoral output from own structural reforms ... 59
2.15 Deviation from baseline in sectoral output from all structural reforms ... 60
2.16 Deviation from baseline in unskilled employment from all structural reforms ... 61
2.17 Deviation from baseline in real wages of unskilled labour arising from all structural reforms .... 63
3 Quantifying the impacts of structural reforms on international transport margins ... 69
3.1 Air share of imports by value for Australia; Brazil; Chile; and the USA, 1990–2008 ... 73
A1 Imports to the USA ... 82
A2 Imports to Australia ... 82
A3 Imports to Chile ... 82
A4 Imports to Brazil ... 83
A5 Imports to the USA; Australia; Chile; and Brazil ... 83
A6a Average adjusted ad valorem transport costs, selected APEC members ... 84
A6b Average adjusted ad valorem transport costs, selected APEC members ... 84
A6c Average adjusted ad valorem transport costs, selected APEC members ... 84
4 Quantifying the impacts of structural reforms on air traffic flows in APEC economies ... 88
4.1 The aviation regulation and liberalisation restrictiveness indices for APEC economies ... 96
4.2 The alternative policy indices ... 98
5 Quantifying the benefits from structural reforms in railway transport markets in APEC economies ... 103
5.1 Productivity change ... 109
5.2 Efficiency change ... 111
5.3 Technical change ... 111
5.4 Productivity change for APEC economies ... 114
5.5 Efficiency change for APEC economies ... 114
5.6 Technical change for APEC economies ... 115
A5.1 The input-based Malmquist productivity index ... 119
7 Quantifying the impacts of structural reforms in telecommunications markets in APEC economies ... 179
7.2 APEC economies fixed-line penetration rate, 2008 ... 183
7.3 Comparison of fixed-line penetration rate between 2002 and 2008 ... 184
7.4 Mobile penetration rate and GDP per capita, 2008 ... 185
7.5 Comparison of change in APEC economies’ mobile penetration rate ... 185
7.6 Internet user penetration rate and GDP per capita, 2008 ... 187
7.7 Broadband subscribers as a percentage of total Internet subscribers, 2008 ... 188
7.8 Comparison of change in APEC economies’ broadband penetration ... 188
7.9 Fixed network market structures in APEC regions, 2003–09 ... 189
10 Rail transport in New Zealand ... 230
10.1 Milestones in the development of railways in New Zealand, 1982–2008 ... 232
10.2 Rail operating profit/loss as a percentage of revenue, 1875–1982 ... 233
10.3 The decline in passenger rail travel ... 234
10.4 Rail freight in New Zealand from 1880 ... 235
10.5 Tranz Rail’s profit could not sustain its operations ... 236
10.6 A comparison of rail freight density internationally ... 238
10.7 Growth in Auckland passenger rail ... 244
11 Rail transport in Chile ... 254
11.1 Main railroads in Chile ... 256
12 Road transport in Thailand ... 267
12.1 The modal share in freight transport in 2008 ... 276
12.2 Freight transport split by mode, 2006 ... 276
12.3 Time and cost improvement on the Bangkok–Danang route ... 282
12.4 The problem of possible cross-border truck flow at Mukdahan–Savannakhet ... 285
13 Maritime transport in Australia ... 290
13.1 Total coastal trade and permit tonnage issued by the government ... 294
13.2 Share of coastal trade transported under permits ... 294
13.3 Real interstate non-bulk freight rates and world oil price ... 295
13.4 Crane rate at selected ports, 2005–07 ... 298
13.5 TEU throughput per berth metre, 2006–07 ... 298
13.6 Yard utilisation measured as TEU throughput per gross hectare, 2006–07 ... 299
13.7 TEUs handled in overseas ports, 2006–07 ... 300
13.8 Simple correlations – TEUs handled and port performances, 2006–07 ... 301
13.9 Port performance indicators, average of the five main ports, in TEUs per hour... 307
14 Maritime transport in the United States ... 313
14.1 Size of the US-flag merchant fleet, ocean-going ships of >1000 gross tons ... 319
14.2 Volume of foreign and domestic shipping ... 322
14.3 US domestic transport share by modes ... 322
14.4 The number of shipyards in the US ... 323
14.5 Employment in the shipbuilding and repairing sector ... 323
14.6 Capacity and demand by 2020 by major ports ... 324
14.7 Port productivity in international ports, 2009 ... 325
14.8 Port productivity in international ports, 2009 ... 325
15 Electricity in Korea ... 334
15.1 Trend of average power prices in KRW/kWh, 1994–2008 ... 340
15.2 Trends of power losses, 1993–2008 ... 341
16 Electricity in Russia ... 345
16.1 Distribution of installed capacity by commissioning year, 2007 ... 348
16.2 Electricity consumption by final use, 2007 ... 348
17 Gas in China ... 370
17.1 China’s natural gas production and consumption, 1990–2008 ... 370
17.2 Energy consumption in China, by type, 2006 ... 371
17.3 The price hooking mechanism ... 380
18 Gas in Thailand ... 385
18.1 Thailand’s natural gas supply, 1986–2009... 385
18.2 The current structure of the Thai gas industry ... 387
18.3 Thailand’s regional natural gas pipeline network and its neighbours ... 388
18.4 Future gas industry structure as perceived in 1998 ... 390
18.5 The length of natural gas pipeline, 1981–2012 ... 394
18.6 PTT’s EBIT/net sales ratio, 2002–2009 ... 395
19 Telecommunications in Chinese Taipei ... 398
19.1 Market share in Chinese Taipei fixed-line market, 2009 ... 402
19.2 Market share in Chinese Taipei mobile market, 2009 ... 402
19.3a Fixed-line penetration rates: Chinese Taipei; USA; Australia; and Japan, 1991–2008 ... 408
19.3b Broadband penetration rates: Chinese Taipei; USA; Australia; and Japan, 1997–2008 ... 408
19.3c Mobile penetration rates: Chinese Taipei; USA; Australia; and Japan, 1997–2008 ... 408
19.4 Percentage of change in broadband penetration: USA; Canada; Singapore; Japan; and Chinese Taipei, 2004–08 ... 408
19.5a Mobile service monthly subscription charge... 409
19.5b Mobile service connection charge ... 409
20 Telecommunications in Viet Nam ... 415
20.1 Market share of Viet Nam’s fixed-line market, 2009 ... 420
20.2 Market share of Viet Nam’s mobile market, 2009 ... 421
20.3 Changes in fixed-line and mobile penetration rates in Viet Nam ... 426
20.4 Comparison of the fixed-line, Internet and mobile penetration rates of Viet Nam; the Philippines; and Indonesia ... 426
20.5 Comparison of selected retail tariffs between Viet Nam; the Philippines; and Indonesia ... 428
22 Logistics in Indonesia ... 446
22.1 The economic distance within Indonesia based on deregulated air ticket costs vs regulated sea transport costs... 449
22.2 Global ranking and scores for APEC economies ... 451
22.3 Indonesia’s ranking in the LPI 2010 compared with APEC, ASEAN 6 and lower middle income economies ... 451
22.4 Framework of the National Logistics Blueprint network ... 453
22.5 Institutional framework for implementing the National Logistics Blueprint ... 456
LIST OF TABLES
1 The impacts and benefits of structural reforms in the transport, energy and
telecommunications sectors in APEC economies ... 1
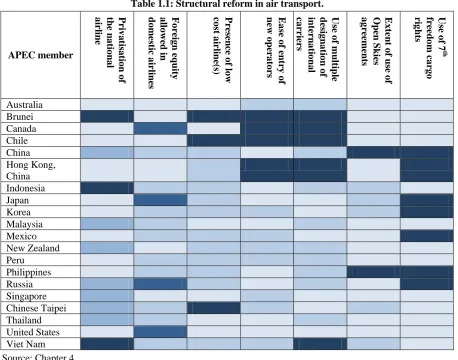
1.1 Structural reform in air transport ... 7
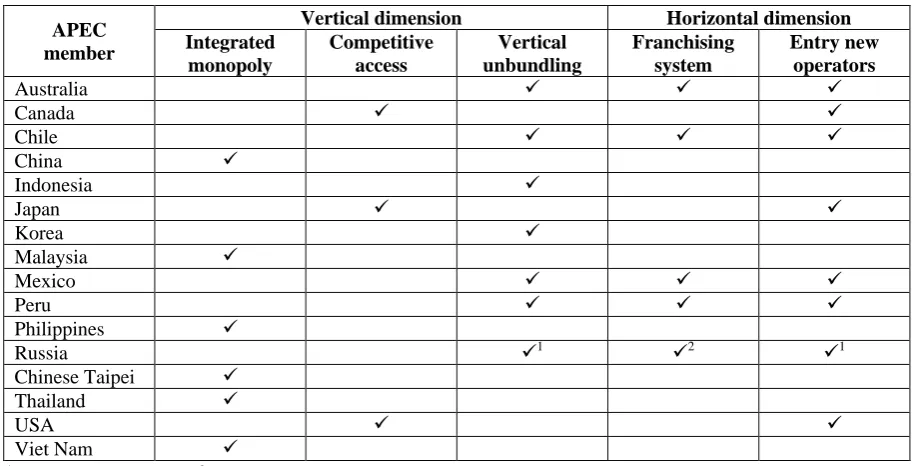
1.2 Main features of the APEC members’ rail networks ... 10
1.3 Structural reform in maritime transport ... 15
1.4 Summary of current regulation in APEC electricity markets, 2009 ... 17
1.5 Summary of current regulation in APEC gas markets, 2009 ... 19
2 Modelling the benefits of structural reforms in APEC economies ... 31
2.1 Index of policy restrictions in air transport ... 34
2.2 Index of policy openness in maritime transport ... 37
2.3 Index of policy openness in rail transport ... 38
2.4 Index of policy openness in electricity ... 40
2.5 Index of policy openness in gas ... 42
2.6 Index of policy openness in fixed-line telecommunications ... 44
2.7 Index of policy openness in mobile telecommunications ... 44
2.8 FTPA model sectors ... 54
3 Quantifying the impacts of structural reforms on international transport margins ... 69
3.1 Measures of restrictiveness and competition for APEC members, 2008 ... 72
3.2 Global Competitiveness Report on infrastructure rankings ... 72
3.3 Corruption perceptions index, APEC rankings, 2008 ... 73
3.4 Expected sign of determinants of transport costs ... 75
3.5 Transport cost regressions for ocean shipped goods ... 76
3.6 Transport cost regressions for air shipped goods ... 77
A1 Import weighted ad valorem transport costs, APEC members’ exports to the USA; Australia; Brazil; and Chile. ... 85
A2 Import weighted ad valorem transport costs by sea, APEC members’ exports by sea ... 85
A3 Import weighted ad valorem transport costs by air, APEC members’ exports by air ... 86
A4 Average ad valorem transport costs adjusted for commodity composition. ... 86
A5 Weighted and adjusted ad valorem freight to the USA; Australia; Brazil; and Chile ... 87
4 Quantifying the impacts of structural reforms on air traffic flows in APEC economies ... 88
4.1 Open Skies agreements signed by APEC economies ... 91
4.2 Policy indicators ... 94
4.3 Scores of the policy index components ... 95
4.4 The alternative policy index indicators ... 97
4.5 Scores of the alternative policy index components ... 98
4.6 Impact of the policy index ... 100
4.7 Impact of the alternative policy index ... 101
5 Quantifying the benefits from structural reforms in railway transport markets in APEC economies ... 103
5.1 The main features of APEC members’ rail networks ... 107
5.2 Productivity change ... 110
5.3 Efficiency change ... 112
5.4 Technical change ... 113
6 Quantifying the benefits from structural reforms in electricity and gas markets in APEC
economies ... 124
6.1 Summary of current regulation in APEC electricity and gas markets, 2009 ... 128
6.2 Electricity regulation in APEC economies, 2009 ... 145
6.3 Gas regulation in APEC economies, 2009 ... 155
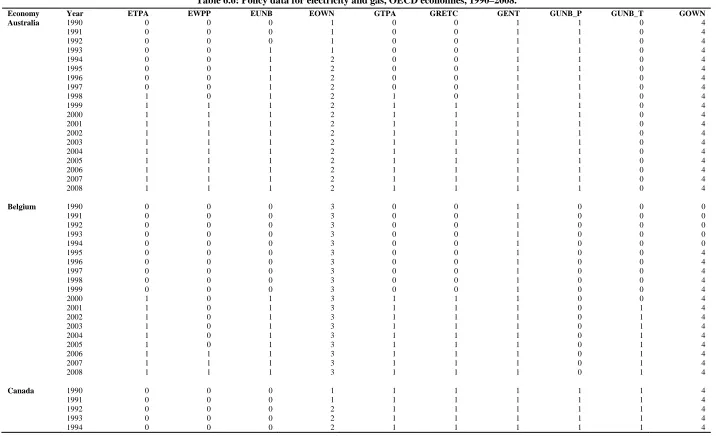
6.4 Economic and technological data for electricity, OECD economies, 1990–2008 ... 164
6.5 Economic and technological data for gas, OECD economies, 1990–2008 ... 164
6.6 Policy data for electricity and gas, OECD economies, 1990–2008 ... 165
6.7 Simple correlations between policy and performance in electricity ... 174
6.8 Simple correlations between policy and performance in gas ... 174
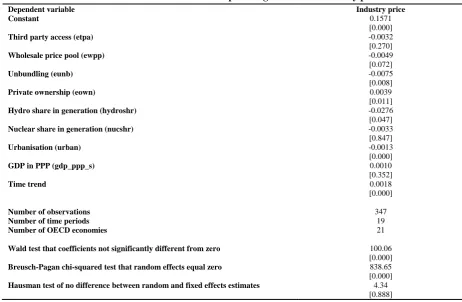
6.9 Results of random effects panel regression for electricity prices ... 175
6.10 Results of random effects panel regression for electricity efficiency ... 176
6.11 Results of random effects panel regression for gas prices ... 177
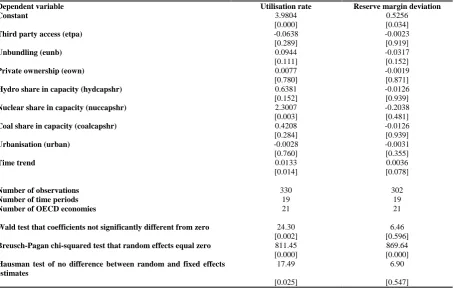
6.12 Results of random effects panel regression for gas efficiency ... 178
7 Quantifying the impacts of structural reforms in telecommunications markets in APEC economies ... 179
7.1 Key telecommunications indicators of APEC member economies ... 181
7.2 Growth rate for APEC economies’ mobile sector ... 186
7.3 Market access conditions of fixed-line networks in APEC economies, 2009 ... 190
7.4 Restrictions on fixed line network foreign investment in APEC economies, 2009 ... 191
7.5 Market access conditions of mobile networks in APEC economies, 2009 ... 192
7.6 Restrictions on mobile network foreign ownership in Mexico and the USA ... 192
7.7 Summary of APEC economies’ implementation of the WTO regulatory principles ... 196
7.8 Results of fixed-line penetration models ... 199
7.9 Results of mobile penetration models ... 199
7.10 Results of broadband penetration models ... 199
7.11 Teledensity and the impact of telecommunications investment – developed economies ... 201
7.12 Teledensity and the impact of telecommunications investment in mobile ... 201
Annex A7.1 Policy index ... 207
Annex A7.2 Policy index values ... 208
8 Quantifying the impacts of regulatory reform in infrastructure on economic performance in APEC economies ... 209
8.1 Results for the pooled OLS and fixed effects regression with FDI in infrastructure projects as the dependent variable ... 213
8.2 Results for the pooled OLS and fixed effects regression with economy-level FDI inflows as the dependent variable ... 214
8.3 Relating private involvement in telecommunications infrastructure projects to independence of telecom regulators ... 216
8.4 Relating private involvement in energy infrastructure projects to independence of electricity regulators ... 217
9 Air transport in Korea and Northeast Asia ... 219
9.1 Status of Korean low cost carriers ... 220
9.2 Status of Open Skies in Korea, January 2010 ... 221
9.3 Status of Korean Air Services Agreements (ASAs) ... 221
9.4 The EU action package for the integration of the air transport market ... 223
9.5 Aircraft movement after the Open Skies policy between Korea and China ... 224
9.6 Passenger performance after the Open Skies policy between Korea and China ... 224
9.7 Number of passengers on the Korea–Shandong route, 2005–07 ... 225
9.8 Number of passengers on the Korea–China route, 2005–07 ... 225
9.9 Aircraft Movements on the Korea–Shandong route, 2005–07 ... 225
9.10 Airfare changes on the Korea–Shandong route ... 225
11 Rail transport in Chile ... 254
11.1 Main railroads in Chile ... 257
11.2 Traffic operations by EFE ... 257
11.3 FERRENOR’S operations after privatisation ... 262
11.4 FEPASA’S operations after concessioning ... 263
12 Road transport in Thailand ... 267
12.1 The population of Bangkok, Bangkok Metropolitan Area and Chiang Mai, 2003–08 ... 268
12.2 Forecast population growth in Bangkok and nearby provinces ... 268
12.3 The number of in-use vehicles in Bangkok, 1994–2010 ... 269
12.4 The operation of passenger bus transport service by government and private sectors ... 271
12.5 Characteristics of the passenger transport industry ... 272
12.6 Characteristics of the largest passenger transport firms in terms of revenue, 2007 ... 273
12.7 Public bus pricing ... 273
12.8: Advantages of vans over buses by category ... 274
12.9 Characteristics of urban public transport modes in the Bangkok Metropolitan Region, 2008 ... 275
12.10 The number of passenger vans in the Bangkok Metropolitan Region ... 275
12.11 Characteristics of the six largest freight transport firms in terms of revenue, 2007 ... 277
12.12 The number of international transport operating licences issued per year, 2000–07 ... 279
12.13 The number of international transport operating licences for 2007 ... 280
12.14 Implementing and planning agencies ... 286
13 Maritime transport in Australia ... 290
13.1 Regulatory framework in maritime transport in APEC countries ... 291
13.2 Summary of the Australian registered trading fleet, 1999 and 2007 ... 296
13.3 Active shipping agreements by type, February 2010 ... 297
13.4 Market structure and capacities at the main Australian ports, early 2010 ... 302
13.5 Waiting time for vessels at major coal terminals, May 2009 ... 303
13.6 Waiting time for vessels at major iron ore terminals, May 2009 ... 304
13.7 New infrastructure projects – coal ... 304
13.8 ARTC coal infrastructure expansion projects in New South Wales ... 305
A13.1 Port regulatory regimes in various Australian states ... 311
A13.2 Recent policy changes in maritime transport ... 312
14 Maritime transport in the United States ... 313
14.1 US cargo reservation schemes ... 314
14.2 Support programs to the US maritime transport industry ... 315
14.3 Importance of various cargo preference schemes, since fiscal year 2005 ... 317
14.4 Daily operating expenses for US-flag vs foreign-flag vessels, in 2005 (USD) ... 318
14.5 Results of various assessments ... 318
14.6 Importance of each subsidy scheme ... 320
14.7 Results of various Jones Act impact assessments ... 321
14.8 Major US commercial shipbuilding programs and representative new building prices ... 321
14.9 Evolution of container throughput in the first 10 US ports ... 324
14.10 Landside annual traffic delay per container in surrounding urban areas, 2005 ... 326
14.11 US employment in water transport and related industries, 2003–08 ... 327
14.12 US public port capital expenditures by region, historical and projected ... 328
14.13 Container handling operators in the three main US ports ... 328
A14.1: Recent policy changes in maritime transport ... 333
15 Electricity in Korea ... 334
15.1 Trends in average prices per kWh ... 339
15.2 Trend of heat efficiency of generators, 1998–2004 ... 341
16 Electricity in Russia ... 345
16.1 Market concentration ... 348
16.2 Selected comparisons of international electricity prices, 2007 ... 352
16.3 Cost components of old and new generation plants, 2005 ... 352
16.4 Electricity tariff for 2006, and projected for 2007–20 ... 363
16.5 Recent changes in policy ... 364
17 Gas in China ... 370
17.1 The equity distribution in three state-owned enterprises ... 372
17.2 The characteristics of all facilities-based operating companies providing gas services ... 373
17.3 China’s imports of LNG ... 376
17.4 The planned international gas pipeline ... 377
17.5 China’s operating and under construction LNG projects ... 377
17.6 Major changes in market access policies, ownership rules and regulations since 2004 ... 379
17.7 Urban gas prices, August 2008 ... 381
18 Gas in Thailand ... 385
18.1 Gas supply and demand growth, 1986–2009 ... 394
19 Telecommunications in Chinese Taipei ... 398
19.1 Sequence of telecommunications reform in Chinese Taipei, pre-1996–2008 ... 399
19.2 Comparison of the market opening timetable and restrictions ... 400
19.3 Telecommunications service classification systems in Chinese Taipei ... 401
20 Telecommunications in Viet Nam ... 415
20.1 Examples of Business Corporation Contracts in Viet Nam ... 416
20.2 Sequence of telecommunications reform in Viet Nam ... 419
20.3 History of market opening in Viet Nam ... 420
20.4 SMP telecommunications enterprises, 2008 ... 422
21 Telecommunications in Papua New Guinea ... 433
21.1 Average call rates for domestic and international phone calls, 2008 ... 441
22 Logistics in Indonesia ... 446
22.1 Strategic environment and challenges of Indonesia ... 447
22.2 Structural reform agenda ... 449
22.3 Quality of Indonesia’s transport-related infrastructure ... 452
22.4 Implementation schedule of the National Logistics Blueprint, 2009–25 ... 454
LIST OF BOXES
1 The impacts and benefits of structural reforms in the transport, energy and
telecommunications sectors in APEC economies ... 1
1.1 Case studies ... 2
1.2 The six item structural reform agenda ... 5
1.3 Air transport market integration in Northeast Asia ... 8
1.4 Low cost carriers in Korea ... 8
1.5 Effects of rail privatisation in New Zealand ... 10
1.6 City rail in Auckland, New Zealand ... 10
1.7 Rail freight in southern Chile ... 11
1.8 Passenger vans in Bangkok ... 12
1.9 Road freight to Laos PDR ... 13
1.10 Cabotage in Australia ... 14
1.11 Cabotage in the USA ... 14
1.12 Electricity in Korea ... 16
1.13 Electricity in Russia ... 17
1.14 Gas in China ... 18
1.15 Gas in Thailand ... 19
1.16 Telecommunications in Chinese Taipei ... 22
1.17 Telecommunications in Viet Nam ... 22
2 Modelling the benefits of structural reforms in APEC economies ... 31
2.1 The FTAP model – GTAP with foreign direct investment ... 54
4 Quantifying the impacts of structural reforms on air traffic flows in APEC economies ... 4.1 Freedom of the air ... 90
7 Quantifying the impacts of structural reforms in telecommunications markets in APEC economies ... 179
7.1 Regulatory principles included in the WTO Reference Paper ... 195
10 Rail transport in New Zealand ... 230
10.1 Constrained by geography and population ... 237
10.2 Competition for Auckland Commuter Rail Services ... 243
12 Road transport in Thailand ... 267
12.1 Bilateral agreements on road freight transport services ... 279
12.2 Benefits from the GMS Economic Corridors development ... 283
12.3 Impacts from the GMS East–West Economic Corridor, Mukdahan checkpoint ... 284
13 Maritime transport in Australia ... 290
13.1 A typology of agreements in liner shipping ... 292
16 Electricity in Russia ... 345
16.1 RAB formula for distribution of tariffs ... 359
16.2 Barriers to market entry by new distributing companies ... 361
22 Logistics in Indonesia ... 446
ACKNOWLEDGEMENTS
The papers for this project were produced by a large team of authors coordinated by Christopher Findlay. While he is responsible for the content of the overview and the summary report, it should be recorded that those sections draw on the contributions of all the authors.
Particular thanks are due to Philippa Dee from the Australian National University for her support in the design and implementation of the project, and we are also indebted to the authors for their energy, advice, patience and persistence.
Nathan Zhivov from the APEC Policy Support Unit managed the project under the guidance of the Unit’s Director, Philip Gaetjens, who conceived the project. Once the work was under way, the Unit provided analytical support and critical commentary on its content. Unit members offered guidance, based on their own experience, on the translation and communication of the basic research results into lessons for policymakers, and they also managed communications with the APEC member economies.
A workshop was held in Singapore in the course of the work, with support from the Secretariat of the Pacific Economic Cooperation Council working with Valerie Clarke from the University of Adelaide. The papers were edited and formatted by Bernard O’Neil of O’Neil Historical & Editorial Services, Adelaide with assistance from Beverley Burke. Simon Firth of Adelaide Research and Innovation at the University of Adelaide worked with the APEC Policy Support Unit on the contracts for the project.
Professor Christopher Findlay
EXECUTIVE SUMMARY
This Executive Summary condenses more than 460 pages of detailed analysis and economic modelling into a digestible brief. We consider the material available in this summary and the main report can be used to develop easily communicated messages for APEC members to promote further structural reform. We also hope the Executive Summary will entice officials to read the more detailed analyses, as they contain useful examples of structural reforms and lessons on how to implement them effectively.
The study as a whole seeks to catalogue many of the substantial, tangible benefits for consumers and for small and medium businesses arising from APEC members’ structural reform efforts in recent years, focusing on the transport, energy and telecommunications sectors. As well, economic modelling was undertaken to provide empirical estimates of reform impacts in those sectors.
INFRASTRUCTURE AND STRUCTURAL REFORM
Structural reform in APEC economies refers to policy change related to ‘institutional frameworks, regulations and government policy [designed] so that barriers to market-based incentives, competition, regional economic integration and improved economic performance are minimized’.
Infrastructure is a significant and quantitatively important determinant of growth and development. Economies with fully open telecommunications and financial services sectors, for example, grow up to 1.5 percentage points faster than other economies. Improving destination infrastructure by a factor of 16% reduces transport costs by an amount equivalent to a reduction of 6500 sea km or 1000km of overland travel. Better infrastructure also contributes to better health outcomes, including key indicators in the Millennium Development Goals.
While competition in domestic markets and openness to foreign investors might usually be expected to lead to better quality services, the link is not straightforward in infrastructure industries where the nature of an asset that is essential in service delivery can cause market and competition failures.
The best way to achieve good outcomes is not only to design better policy, but also to match the most effective and least distorting policy instruments to the objectives being sought. Good microeconomic policy also requires policy coherence. The APEC Leaders’ Agenda to Implement Structural Reform is directed at exactly these issues.
PROGRESS TO DATE
Air transport
In air transport the initial instances of competition often occur in domestic markets through the introduction of low cost carriers (LCCs). For example, in Korea fares fell by 20–30% as a result of the entry of LCCs in 2006. The LCC share of the domestic market in Korea is now 25% and close to 30% on some routes.
Reform of international markets, which involve sovereign treaties as well as operating airlines, moves more slowly than that in domestic markets, but there is a shift towards liberalisation. For example, in 2006 Korea and China entered a more liberalised agreement for routes between Korea and China’s Shandong province. As a result, fares fell by an average of more than 8% on these routes and traffic grew much faster (by a factor of 2) compared to other routes between the two economies.
Other studies rank economies according to their degree of liberalisation in international markets. An economy moving from the bottom quarter of the ranking to the top quarter would see substantial benefits. Such a move would see traffic volumes between economies linked by direct air services increase by about 30%. Signing Open Skies agreements has lowered air cargo freight rates by 8%.
Regulations remaining in APEC economies, particularly in international markets, maintain barriers to the entry of new airlines. Econometric analysis undertaken for this project finds that conversion to full openness in air transport would lead to an average reduction in margins for all APEC economies of 15%. Exporters able to reap such benefits from more competitive world aviation markets would be able to capture these reduced margins and pass them on to consumers.
Rail transport
In rail transport the separation of track (below-the-rail) and train (above-the-rail) operations and the introduction of competition between train operators provide significant benefits. Free entry of new operators and the resulting dynamics of competition are critical for better performance. One study found that free entry adds over three times as much to productivity as separation.
The separation of track ownership and operations is increasingly common in APEC economies, along with the specification of regimes that provide access for new competitors. Financing challenges in relation to track investment, however, remain. Between 2001 and 2008 the annual average rate of productivity growth in the rail sector for APEC members was 3.5%. There is still room for improvement, since for non-APEC members, productivity grew by 4.8% a year over the same period.
competitive model. Services more than doubled between 2005 and 2009. Reliability also improved. In March 2005 only 77% of trains arrived on time. This figure exceeded 85% for most of 2009. Over 5 years 21 of the 41 stations on the network were upgraded. There were more services, higher frequencies, greater punctuality and better trains. Under this model, the government continued to invest in the track. It also subsidised fares on the grounds of rail’s contribution to the reduction in road congestion. The subsidy was transparent. Modelling suggests that this subsidy per passenger could be halved if further investment, including electrification, adds to service quality and attracts more passengers.
The process of privatisation in the New Zealand rail system in 1993 also had a significant effect on volumes and user satisfaction. Between 1994 and 1997 prices fell 7% per annum in the bulk goods sector and by more than 4% per annum for export goods. Significant improvements were found in customer satisfaction surveys, with recommendation rates improving from just over 30% to nearly 80%. Issues remained however in relation to investment in the rail track.
In Chile fares were 40% lower after the government-owned rail corporation divested its southern operations. The track remained in the hands of the state organisation which provided maintenance and facilities.
Road transport
Regulation of passenger and freight transport by road must juggle conflicting demands of avoiding congestion, bringing home to users the costs of road use and damage created, funding investment in the network, meeting safety targets and providing access to services. The package of regulations that is created, however, may induce a market response that in turn illustrates the opportunities available from better policy.
In Bangkok an opportunity was created for new entrants offering a differentiated passenger transport service at unregulated prices. When they began in the mid 1980s, these new services, or ‘vans’, were illegal, but later many were licensed. The vans were smaller than buses and charged higher prices but offered shorter and faster routes with guaranteed seats. Although passengers were required to go to terminals rather than usual bus stops, by 2008 there were more than 6500 vans operating in Bangkok. They provided consumers with more variety and wider access to services.
Freight rates fell by 20–30% when quotas on cross-border freight licences were removed between Thailand and Laos in 2004.
For international road freight, as for trade more generally as tariffs are lowered, greater importance now attaches to infrastructure and other regulatory constraints, such as arrangements for customs clearance.
Maritime transport
Shipping services markets are now regarded as largely competitive, but residual regulation of maritime services remains in some economies. The emerging issue is access to port services – in particular, access to ancillary services required to berth, load and unload.
been changed and greater flexibility is obtained through a permit system. Technological improvements and rationalisation of staffing scales resulted in a downward trend in real interstate non-bulk freight rates from the early 1980s. Regulatory changes sustained this trend. Rates were 40% lower in 2005 compared to the start of the 1990s. The Australian coastal fleet capacity was 60% lower in 2007 compared to 1999 but productivity more than doubled as a result of a rise in capacity utilisation.
New econometric work undertaken in this study finds that a movement from the current policy regime to full liberalisation for all APEC economies would on average reduce maritime freight rates by about 20%. This saves real resources and provides benefits to shippers and their customers.
Electricity
Regulatory reform in OECD economies has contributed to lower industrial electricity prices. Competitive wholesale markets and retail competition also reduced prices significantly in the United States of America: retail competition reduced prices by 5–10% for residential customers and by 5% for industrial customers.
Given the complexities involved, structural reforms that have taken place since 2004 in the energy sector in APEC economies have mostly been incremental – there have been few ‘big bang’ initiatives.
Russia is an exception. The extent of reform of the Russian electricity sector is remarkable. There has been a complete transformation of the system to separation and a wholesale market. The Californian experience of reform, where blackouts followed measures to increase competition, has not been a deterrent in Russia, where the reforms have been designed with lessons learned from earlier international experience.
The first stage of electricity reforms in Korea included the separation of generators from the distribution company. Utilisation of capacity increased: planned outages of 25 days across 109 units of generators in 2000 dropped after restructuring to about 19 days across 117 units in 2003. Productivity also increased through a substantial rise in the capacity utilisation rate of coal-fired plants – from 75% in 1999 to 89% in 2003.
Econometric analysis in this report shows that further structural reforms in APEC electricity markets would reduce prices and increase efficiency. In electricity markets:
• the introduction of competition through a third party access regime would be associated
with electricity prices being almost 5% lower than otherwise, on an indicative basis and holding all other factors constant;
• the introduction of a wholesale electricity market would be associated with electricity
prices being about 7% lower; and
• unbundling of generation from transmission would be associated with a fall in electricity
prices by more than 11%.
Gas
In general, reforms in natural gas have been less extensive than in electricity. In part, this is because the scope for competition in natural gas production depends on the range of sources of supply. A remarkable development in China began in 2005 with reform to the system for pricing gas. Gas prices had been based on a cost-plus formula, but from 2005 they were ‘hooked’ to the prices of other sources of energy. This began to correct the problem of pricing gas too low, which in 2009 had led to gas shortages.
Econometric analysis in this report identifies the effects that further structural reforms in APEC gas markets would have on prices and efficiency. The introduction of retail competition would be associated with gas prices being about 15% lower than otherwise, all other things being constant. The unbundling of gas production/import from distribution would lower gas prices by more than 23%.
Telecommunications
Telecommunications reform, which embraces information and communications technology as well as traditional telephony, leads to productivity improvements. A contributor is the greater use of the Internet for business transactions. Productivity improvements reduce costs in supply chains and enable goods to move to market more quickly and more cheaply.
As of 2009 the majority of APEC economies have adopted full market entry liberalisation. However, a common practice is to limit foreign investment from gaining dominant positions in fixed-line operators. This is a major issue in current telecommunications regulatory settings. As of 2009 all APEC economies have liberalised their mobile telecommunications sectors. In most economies new licences are granted based on market-oriented approaches unless limited by the availability of spectrum. APEC members have undertaken – as required by their respective General Agreement on Trade in Services (GATS) treaty commitments – to allocate spectrum in an objective, timely, transparent and non-discriminatory manner.
A liberalisation program began in Chinese Taipei in 1997, first in mobile then in fixed-line services. The subsequent change in performance has been remarkable in comparison with its APEC peers. Fixed-line penetration in Chinese Taipei exceeded that of Australia and Japan in 1998 and of the USA in 2003: it peaked at 65% in 2005. It has since been falling, as in many economies. Mobile penetration in Chinese Taipei exceeds 100%. Broadband penetration is at the same level as these comparator economies.
Fixed-line development in Viet Nam is outstanding when compared with other APEC economies with similar levels of economic/telecommunications development. Prior to 2003 Viet Nam had a similar level of fixed-line penetration as Indonesia and the Philippines of around 5%. Yet starting from 2003, access jumped. In fixed-line availability, Viet Nam is now at 35% and mobile penetration is at 80%. Monthly subscription charges for mobile services had fallen to zero by 2004, compared to $US17 in 1999. Structural reform efforts contributed to this outcome, including the establishment of the universal service fund.
THE NEXT STEPS AND THEIR EFFECTS
What are ‘the next steps’ to achieve greater benefits still? A common theme for all sectors is the introduction of more competition:
• air transport – through a range of reforms to air services agreements, to entry conditions
for domestic and foreign carriers, and ownership;
• maritime transport – by the dismantling of remaining entry restrictions, quotas or cargo
sharing arrangements and the granting of domestic-vessel treatment to foreign-owned carriers located domestically;
• rail transport – through free entry in freight operations in those economies that do not have
them;
• electricity and gas – by providing third party access, unbundling, wholesale prices set
through market arrangements and/or retail competition in economies that have not implemented them; and
• telecommunications – through the removal of remaining foreign equity limits.
A package of reforms based on the measures outlined above would have a significant effect. Across the whole APEC region, USD175 billion a year in additional real income (in 2004 dollars) could be generated relative to what would have accrued had these reforms not occurred. This is a snapshot of the gains projected after a 10-year adjustment period.
The reforms can be translated into productivity effects, and the estimated first round impacts of these reforms suggest that they could lead to weighted average productivity improvements in the range of 2–14% across the transport, energy and telecommunications sectors. The largest productivity gains (above 10%) would occur in Indonesia; Malaysia; Mexico; the Philippines; Chinese Taipei; and Viet Nam.
There is no compelling reason for an APEC economy to wait for others to start. In all economies an overwhelming proportion of these gains come from reforms domestically, rather than reforms in other economies. Of course, the gains from joint reforms are also considerable.
APEC-wide, the projected gains from these structural reforms are almost twice as big as the gains from further liberalisation of merchandise trade. Yet the sectors where the structural reforms occur are less than a quarter of the size of those engaged in merchandise trade. When structural reforms lead to lower real production costs, even by half as much as is estimated here, they create a return to reform effort that is much greater than that from trade reforms.
These findings, therefore, vindicate APEC Leaders’ decision to move beyond a ‘border’ focused trade reform agenda to one that focuses on ‘behind the border’ issues. Yet along with generating significant gains, structural reforms often require significant structural adjustments. These must be managed carefully and sensitively and often take a considerable transition period when implementing policy measures.
The essence of a productivity improvement is that an industry can produce more with less. To ensure that efficiency gains are passed on to consumers, competition is required. Competition also allows dynamic gains to be achieved as new ways of doing things are found and best practice is transmitted more widely across market players.
employment do so not as a result of their own productivity improvements but because the domestic industries that use their services lose their position as other economies reform. In the extreme cases, modelling indicates relative losses in unskilled employment in a particular sector after 10 years can accumulate to upwards of 30%. But this modelling result needs to be kept in perspective. Employment changes occur over time and can be addressed through targeted structural assistance measures. Secondly, as long as an economy grows overall employment will increase, so the modelling shows that structural reforms may require significant relative shifts of labour across sectors over time. Thirdly, the model projects the generation of higher real wages for all workers in all economies. Modelling and real world examples demonstrate that displaced workers earn higher real wages in their new occupations.
To reiterate, employment opportunities overall depend on the growth of an economy. Thus, one of the best ways that APEC economies can guard against any adverse employment effects of structural reform is to maintain healthy underlying rates of economic growth. Structural reform itself makes a contribution to this goal, since it adds to productivity, stimulates activity and increases the resilience of the economy, but prudent macroeconomic management is also crucial.
A STRONGER AGENDA FOR APEC
This research shows the value of the APEC Leaders’ adoption of an agenda to implement structural reform. It also reveals the importance of structural reform as providing strong bridges behind the border to capture the full benefits of improving regional economic integration. This study has found that:
• structural reform is challenging because it takes time amid the economic and political
complexities in all economies;
• structural reform can create winners and losers but yields more inclusive development
when it is carried out dynamically, with transitional measures and with other economic reforms; and
• structural reform is worth undertaking and provides potentially greater gains than trade
liberalisation and generates economic sustainability.
These results suggest the scope to build an even stronger APEC agenda and work program. Structural reform is a vital process to achieve growth and to provide greater flexibility and resilience with which to deal with and withstand shocks, both domestic and external. However, it requires changes in economic structures, innovation and the adoption of new technologies and market responses to shape effective regulation as well as transform APEC economies and their current regulatory systems.
Steady adaptation is required, not least because expectations will rise as development proceeds. Pressure from the rest of the world, both competition from other economies and new commitments for cooperation, creates further forces for change. APEC economies are at various stages of reform, and their experiences to date are valuable to other APEC members. The sharing of this experience remains a priority, not just to learn about what is possible but also about the strategies for implementation. This will enable economies to examine measures and strategies and then shape and adapt them to their own situation.
implemented policy measures is the design and implementation of reporting systems and monitoring arrangements for the progress of reform. The impacts of reform and their economy-wide effects are worthy of regular attention. Evidence of gaps between good practice, allowing for the varying stages of development, and the costs of those gaps are drivers of reform. But in the end what matters is the outcome.
A reform program focused on structural reform will create new sources of growth. This growth will be driven by productivity. Often these new sources of growth are unable to be identified or forecast because it is the dynamics of competition, the near limitless imagination of enterprise and the innovative use of changing technology that gives rise to new beginnings. Reform at the border remains significant for the efficiency and growth of member economies but the empirical work here demonstrates the significance of the productivity effects of even a modest set of ‘next steps’, all primarily focused on the introduction of competition.
Another consequence of reform will be economic resilience. More efficient market operations, macroeconomic stability and higher productivity all follow from structural reform and will contribute to higher standards of living. The concern with resilience and macroeconomic stability is even more relevant in the context of responding to the recent global financial crisis.
Chapter 1
THE IMPACTS AND BENEFITS OF STRUCTURAL REFORMS IN
THE TRANSPORT, ENERGY AND TELECOMMUNICATIONS
SECTORS IN APEC ECONOMIES
Christopher Findlay1
1.1 INTRODUCTION
APEC Leaders committed to a program of work on structural reform in August 2004 when they endorsed a significant reform program in this area: the Leaders’ Agenda to Implement Structural Reform (LAISR).
Structural reform in APEC, as defined by Leaders, relates to ‘institutional frameworks, regulations and government policy (designed) so that barriers to market-based incentives, competition, regional economic integration and improved economic performance are minimized’. The aim is to avoid ‘excessive regulation, poor economic legal infrastructure and governance arrangements (in both public and private sectors), unclear property rights and the lack of effective laws to foster competition’.
The purpose of this study is to demonstrate the benefits of structural reform and publicise a range of reforms in APEC economies. Strategies for success and bottlenecks to further progress are identified. It also develops a complementary program of work in APEC to support further reform.
Structural reform matters across the whole economy, but the focus of this study is the transport, energy and telecommunications sectors. These are valuable choices, given the significant economy-wide impacts of reform on these sectors. The effects of the reforms in these sectors are identified and the extent of their effects estimated. This includes the benefits for both consumers and small and medium enterprises.
The pace and success of reforms is expected to vary between economies and even between the three sectors within economies. It is useful to understand the reasons for the differences in degrees of success and degrees of impact on the key performance indicators. This understanding then helps define the ways in which APEC members may support each other in implementing and managing the reforms and improving their application in the three sectors.
Officials in earlier work on these issues have stressed the political economy challenges to be overcome. There are losers from policy change who oppose and seek to prevent its implementation. Often they constitute advantaged parties who have a monopoly or an excessive market power position, which can detract from overall economic welfare. Therefore, assessments of the overall benefits and transparency of effects are important contributions to sustaining reform.
1
Against this background, this study reports a range of structural reforms in APEC and the impacts in terms of price, choice and quality for a range of stakeholders. The study is based on a series of steps – review, case studies, estimation and modelling.
The first step was to review existing material on the foundations for structural reform, to identify the potential impacts and benefits of APEC’s structural reform agenda, to characterise different policy approaches and to discuss different measures of the contribution of structural reform to economic growth.
The next step was the selection of sectors in APEC member economies for further study, based on evidence of actual reform in sectors of interest, along with geographical and developmental diversity. The work on the case studies (Box 1.1) was guided by questionnaires on structural reforms that have been developed from existing templates available in work carried out by the OECD (OECD 2005, Conway, Janod & Nicoletti 2005) and the Australian Productivity Commission (Findlay & Warren 2000, Doove et al. 2001). The questionnaires were designed to cover the scope of the structural reform agenda as specified in the Leaders’ Agenda, in particular regulation, competition policy and legal infrastructure.
Box 1.1: Case studies. • Telecommunications in Viet Nam
• Telecommunications in Chinese Taipei
• Telecommunications in PNG
• Gas in Thailand
• Gas in China
• Electricity in Russia
• Electricity in Korea
• Rail transport in Chile
• Rail transport in New Zealand
• Maritime transport in Australia
• Maritime transport in the USA
• Air transport in Korea and Northeast Asia
• Road transport in Thailand
• Logistics in Indonesia
Initial impacts of the structural reforms on prices and productivity were also estimated. The use of econometric models for this purpose can correct for the influence of other changes that might have taken place at the same time as the structural reforms, and hence reduce the chance of incorrect attribution of impacts. Econometric models are already available for the air transport, maritime, electricity and telecommunications sectors (including Findlay & Warren 2000, Doove et al. 2001). New work was done here on air passenger traffic and freight, productivity in rail systems, cif/fob margins in international sea and air transport, penetration rates in telecommunications and prices and performance in electricity and gas.
The case for structural reform is outlined in section 1.2. Following that is a discussion of key issues that confront policy makers working on the infrastructure sectors followed by a review of the main results for the sectors targeted in this report. General messages for managing structural reform programs are outlined and the results of the modelling of the cross-sectoral effects are presented. The report concludes with a discussion of some areas for stronger cooperation among APEC members.
1.2 THE STRUCTURAL REFORM FRAMEWORK2
Effective structural reform requires two things. 3 The first is a commitment to the
entrenchment of well functioning markets and to letting market competition determine economic outcomes in all circumstances where competition is appropriate. The second is good regulations (rules) to guide economic outcomes when competition is not effective.
The choice of the rules will not be ‘black and white’ and will not involve the immediate adoption of something some may define as ‘global best practice’: it will depend on the circumstances of the economy involved. There will be a continuum of options and the important target will relate to the trajectory of the evolution of policy as development proceeds. The options will depend not only on domestic considerations but also on emerging ideas in the rest of the world, and in the context of events in the rest of the world.
The forces of competition can exert powerful pressure on producers to find the least costly way of serving customer needs and to innovate, in order to better serve those needs. Individual producers can benefit from any cost savings they make in the form of higher profit, and consumers and downstream using industries can also benefit as competition from other producers squeezes those profits and drives prices down towards costs. This dynamic process leads to prices that reflect production costs, and to costs that are as low as possible. Both types of efficiency ensure the highest possible levels of income. Not only do falling costs and prices matter but so too do choice, variety and quality. Many consumers always look for new options and better delivery.
Competition helps to maximise income levels, and in an administratively efficient way. Similar patterns of production and consumption could be achieved through a system of centralised decision-making. But the administrative requirements for such central planning are burdensome, and the information requirements for doing it successfully are prohibitive. By contrast, the market place achieves these outcomes as a result of the direct interaction between many producers and consumers. No bureaucrat needs to decide which individuals should run which companies producing which products at what price. For those economies where regulatory capacities are scarce, there can be significant benefits from letting the market place decide.
But there are administrative or legislative requirements for market competition to succeed. Basic laws are needed to set the boundaries of that competition (e.g., corporation law is needed to allow for limited liability companies), thus limiting the downside risks to shareholders from poor corporate performance. Accounting standards, disclosure requirements and good systems of corporate governance are all needed so that equity holders and creditors can assess the economic performance of companies in a transparent way.
2
Readers not interested in this overview of the reasoning that underlies structural reform might best go to section 1.3: Structural reform of infrastructure industries.
3