Research article
Gene expression profiles derived from fine needle aspiration
correlate with response to systemic chemotherapy in breast cancer
Christos Sotiriou
1,2, Trevor J Powles
3, Mitch Dowsett
3, Amir A Jazaeri
1, Andrew L Feldman
4,
Laura Assersohn
3, Chandramouli Gadisetti
1, Steven K Libutti
4and Edison T Liu
1,51Division of Clinical Sciences, Advanced Technology Center, National Cancer Institute, National Institutes of Health, Gaithersburg, USA 2Chemotherapy Unit, Microarray Facility, Jules Bordet Institute, Free University of Brussels, Brussels, Belgium
3Royal Marsden NHS Trust Hospital, London & Surrey, UK
4Surgical Branch, National Cancer Institute, National Institutes of Health, Gaithersburg, USA 5Genome Institute of Singapore, Singapore
Correspondence:Christos Sotiriou, Chemotherapy Unit, Microarray Facility, Jules Bordet Institute, Free University of Brussels, 121 Boulevard de Waterloo, 1000 Brussels, Belgium. Tel: +32 2 541 3748; fax: +32 2 538 0858; e-mail: [email protected]
Introduction
Chemotherapy given as adjuvant therapy after surgery to patients with primary operable breast cancer reduces the subsequent risk of relapse and death [1]. Although the
absolute reduction in mortality is only about 10–12%, most patients now receive adjuvant chemotherapy because it is not possible to identify, at the start of treatment, which patients might gain benefit. Our approach to this problem
COX = cytochrome coxidase; FNA = fine needle aspiration; HMG1 = high-motility group protein 1; PCR = polymerase chain reaction; RT = reverse transcriptase.
Abstract
Background:Drug resistance in breast cancer is a major obstacle to successful chemotherapy. In this study we used cDNA microarray technology to examine gene expression profiles obtained from fine needle aspiration (FNA) of primary breast tumors before and after systemic chemotherapy. Our goal was to determine the feasibility of obtaining representative expression array profiles from limited amounts of tissue and to identify those expression profiles that correlate with treatment response. Methods:Repeat presurgical FNA samples were taken from six patients who were to undergo primary surgical treatment. Additionally, a group of 10 patients who were to receive neoadjuvant chemotherapy underwent two FNAs before chemotherapy (adriamycin 60 mg/m2and cyclophosphamide 600 mg/m2) followed by another FNA on day 21 after the first cycle. Total RNA was amplified with T7 Eberwine’s procedure and labeled cDNA was hybridized onto a 7600-feature glass cDNA microarray.
Results:We identified candidate gene expression profiles that might distinguish tumors with complete response to chemotherapy from tumors that do not respond, and found that the number of genes that change after one cycle of chemotherapy was 10 times greater in the responding group than in the non-responding group.
Conclusion:This study supports the suitability of FNA-derived cDNA microarray expression profiling of breast cancers as a comprehensive genomic approach for studying the mechanisms of drug resistance. Our findings also demonstrate the potential of monitoring post-chemotherapy changes in expression profiles as a measure of pharmacodynamic effect and suggests that these approaches might yield useful results when validated by larger studies.
Keywords:breast cancer, cDNA microarray, chemotherapy, fine needle aspiration, gene expression Received: 27 November 2001
Revisions requested: 8 January 2002 Revisions received: 12 February 2002 Accepted: 4 March 2002
Published: 20 March 2002
Breast Cancer Res2002, 4:R3
This article may contain supplementary data which can only be found online at http://breast-cancer-research.com/content/4/3/R3
has been to give the chemotherapy before surgery (neoadju-vant therapy) to use the response in the primary tumor as a surrogate marker of subsequent survival benefit [2]. Predic-tions of response have been attempted on the basis of tumor expression of proliferation and apoptosis markers [3], endocrine and growth factors, and oncogenes [4]. However, no single tumor marker has been shown to possess a suffi-cient predictive value to render it clinically useful. To achieve a greater predictive value, multiple markers need to be exam-ined and correlated with the response of tumor cells to chemotherapy. The development of cDNA microarray tech-nology has provided such an opportunity. With this technol-ogy it has been possible to identify new classes in breast cancer according to their gene expression patterns and to correlate them with distinct clinical outcomes [5,6]. We have demonstrated previously that RNA amplification is suitable and reliable for the determination of gene expression profiles by using small amounts of RNA from core biopsies [7].
Our goal in this project was to determine the feasibility of obtaining representative cDNA expression array profiles from fine needle aspirations (FNAs) performed on breast carcinomas, which are known to have substantial hetero-geneity after RNA amplification. We also evaluated the correlation between such profiles and subsequent clinical responses after neoadjuvant chemotherapy to determine whether this might provide a useful approach to response prediction for testing in future prospective studies.
Patients and methods
Patients
All patients provided informed consent before any proce-dures. To evaluate the sensitivity and reproducibility of the FNA technique, repeat presurgical FNA samples were taken from six patients. For two patients in this group, correspond-ing surgical specimens were available. Additionally, a group of 10 patients with breast cancer, who were treated with neoadjuvant chemotherapy, were evaluated by using three FNAs, two performed one week apart and before chemotherapy (adriamycin 60 mg/m2 and cyclophos-phamide 600 mg/m2), and the third on day 21 after the first cycle of chemotherapy. A 23-gauge needle (Oncotech Inc, Irvine, California, USA) was used for FNA in all cases.
RNA sample and cDNA preparation
From each aspirate a single-cell suspension was made in 2.5 ml of normal saline. Each sample was snap-frozen in liquid nitrogen and stored at –80°C. All FNA samples con-tained more than 50% tumor cells as assessed by a cyto-logical examination of cytospin. The phenol/chloroform procedure (Trizol®; Gibco, Grand Island, New York, USA) was used to extract total RNA from each FNA sample. Total RNA isolated from the MCF10A human mammary epithelial immortalized cell line served as a common refer-ence. Two rounds of Eberwine’s RNA amplification proce-dure were performed, with minor modifications, with total
RNA from tumor FNA specimens and the MCF10A human mammary epithelial immortalized cell line as described previously [8]. Labeled cDNAs were prepared from 3µg of amplified RNA, hybridized onto a 7600-feature glass cDNA microarray (NCI) and scanned with a 10µm resolu-tion GenePix 4000 scanner (Axon Instruments, Inc, Foster City, California, USA) as described elsewhere [9].
Data analysis
Expression profiles were analyzed with BRB Array tools, version 1.03 (Molecular Statistics and Bioinformatics Section, National Cancer Institute, Bethesda, Maryland, USA). Only spot-filtered data were considered for the analysis as described in the Supplementary Material. To compare gene expression profiles generated from each FNA–FNA and FNA–surgical specimen pair, we per-formed an unsupervised hierarchical cluster analysis [10]. A compound covariate predictor algorithm was applied to find a set of predictors for classifying each patient into the two predetermined classes (good responders versus bad responders) [11]. A cross-vali-dated approach was performed to validate the class pre-diction: one patient was removed; the classifier was trained on the remaining patients and then tested for its ability to classify the withheld patient. To estimate the probability of obtaining the predicting membership purely by chance we performed random groupings of patients and we calculated the number of misclassifications (see Supplementary Material).
Real-time quantitative RT–PCR
Gene expression was measured with the GeneAmp 5700 Sequence Detector (Applied Biosystems, Foster City, Cali-fornia, USA). Primers and probes (BioServe Biotechnolo-gies, Laurel, Maryland, USA) were designed with Primer Express software (see Supplementary Material) (Applied Biosystems). The following mRNAs were evaluated: CD44, HMG1, COX17, and ACTB as a normalizing control. Gene expression in each patient sample was then compared with expression in the reference cell line, MCF10A.
Results
FNAs can be used to obtain representative and
reproducible gene expression profiles of breast tumors
when different distance-based clustering methods were used (data not shown).
Scatter plots were employed to investigate the level of sim-ilarity between the cDNA microarray results derived from various samples (Fig. 1b). When profiles from two FNAs from the same patient (obtained 1 week apart) were assessed (Fig. 1b, panels a and b), their Pearson correla-tion coefficient was very high (r= 0.88 and 0.94). This cor-relation is comparable to that observed between repeated hybridizations that we conducted with the same RNA (r= 0.90–0.94, data not shown). The comparison between surgical specimen and the corresponding FNAs also revealed a good correlation (Fig. 1b, panels c and d), albeit with lower correlation coefficients (r= 0.74, 0.70). In con-trast, FNA–surgical specimen and FNA–FNA samples from different patients, as expected, gave distinctly different expression profiles with Pearson correlation coefficients of
r= 0.38 and r= 0.57, respectively (Fig. 1b, panels e and f).
Pretreatment gene expression profiles are associated with response or lack of response to chemotherapy in breast carcinoma
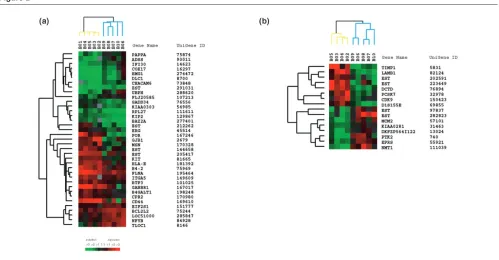
To assess whether cDNA microarray profiles obtained from FNAs before chemotherapy would be able to differ-entiate and associate with the response or non-response to treatment, we studied an additional group of 10 patients with breast cancer who were to receive neoadju-vant chemotherapy. Patient demographics are shown in Table 1. Three pretreatment FNA samples out of 20 (patients 1, 3 and 4) were discarded because of an insuffi-cient percentage of tumor cells. For each gene the average log expression ratio (ratio of the fluorescent inten-sities of the spots reflecting the relative level of gene expression) from the cDNA microarray experiments obtained from the two independent pretreatment FNAs was considered for analysis. Thirty-seven genes whose expression was most significantly different between good and poor responders were identified (P< 0.01; individual
t-test). These included genes involved in the promotion of cell death, and chemosensitivity. To define a prediction model for classifying each patient into the two predeter-mined classes (good responders versus bad responders) we used a compound covariate predictor algorithm based on the expression levels of these 37 genes (Fig. 2a). Using this compound covariate predictor set of genes and a cross-validated approach we were able to correctly iden-tify the response status of all 10 patients. Using 10,000 random permutations we confirmed that chance contribu-tion to this prediccontribu-tion model was unlikely (P< 0.009) (see the Methods section and Supplementary Material).
Early gene expression changes after one cycle of chemotherapy
We also investigated the changes in gene expression after one cycle of chemotherapy. For this purpose we
com-Figure 1
pared the gene expression of the FNA taken on day 21 after the first cycle of chemotherapy with the average
[image:4.612.57.556.117.306.2]gene expression of the two pretreatment samples avail-able for each patient. One post-treatment FNA out of 10
Figure 2
[image:4.612.58.557.366.626.2]Gene expression profiles distinguishing good from poor responders. (a)Hierarchical clustering of 37 genes that defined the class predictor and whose expression best differentiated good from poor responders before chemotherapy. Each row represents a single gene and each column represents the average of two available independent FNAs. Green and red squares indicate, respectively, overexpressed and underexpressed genes in a breast tumor compared with the MCF10A breast cancer cell line (color intensity is proportional to the magnitude of the expression level ratio). Black squares indicate genes with approximately equivalent expression levels and gray squares indicate missing or filter-excluded data. Branches representing good responders are shown in blue and those representing poor responders in yellow. (b)Hierarchical clustering of 16 genes whose change in expression best differentiated good from poor responders after one cycle of chemotherapy.
Table 1
Patient demographics
Patient Age Tumor Node ER PgR Clinical Pathological finding
no. (years) size (mm) status status status response (after chemotherapy)
1 42 7 + + n/a CR No surgery
2 37 50 + + n/a MRD No surgery
3 50 19 + + n/a MRD DCIS only
4 56 24 – – n/a MRD No surgery
5 56 50 + – n/a MRD DCIS only
6 48 50 + – n/a SD RID
7 64 40 + – – PR RID
8 47 30 – + n/a SD RID
9 51 50 – + n/a PR RID
10 67 30 – – – SD RID
CR, complete clinical response (no residual palpable disease); ER, estrogen receptor; MRD, minimal residual disease (residual palpable irregularity that was too small to be measured); n/a, not available; PgR, progestrogen receptor; PR, partial response (more than 50% reduction in
was discarded because of insufficient initial material (patient 1). In this analysis, outliers were defined as genes that showed at least a twofold change in their expression level (post-treatment compared with average pretreat-ment) in at least three out of five patients in each group. This was performed to select genes with consistently altered expression within each group. Using these strin-gent criteria, the numbers of outliers in the good respon-ders were more than 10-fold those in the poor responder group (56 versus 5, respectively). When we used less stringent gene selection criteria based on the intersect of the genes that appeared at least once as an outlier, the good responders again exhibited much greater changes in gene expression than the poor responders (data not shown).
To further identify early gene expression changes that best discriminated the two groups after one cycle of chemotherapy, we also performed a parametric t-test on each gene’s log-ratio change value from each patient. As shown in Fig. 2b, we identified 16 genes whose change in expression level best differentiated between the two groups (P< 0.01, individual t-test).
RT–PCR confirmation of microarray findings of selected genes
To validate our array data, we performed RT–PCR of selected genes (COX17, HMG1 and CD44) involved in different molecular pathways identified in Fig. 2a, in the remaining RNA of all available pretreatment FNA samples. As shown in Fig. 3, the RT–PCR experiments confirmed the relative abundances of each of the three tested genes between good and poor responders obtained in microar-ray experiments.
Discussion
This study is the first to test the feasibility of obtaining rep-resentative array profiles from FNAs of breast carcinomas in a clinical setting. Amplification of tumor RNA from FNAs was used to achieve adequate signal. Our results demon-strate that when amplified RNA is used as a template, array profiles derived from an FNA of a given tumor are highly reproducible and representative. In addition, the molecular profiles generated from FNAs of different breast tumors can be distinguished from one another. Although the profiles derived from the surgical specimen and the corresponding FNAs showed discernible differences, these discrepancies are in the same range as the histo-logic differences between FNAs and surgical specimens [2]. Specifically, FNAs are enriched for the less adherent carcinoma cells and reduced in the stromal components in comparison with the intact tumor. Therefore, the profile of FNA samples might be more representative of the biology of the pure cancer cells because the stromal components have been removed. Most importantly, however, the com-posite expression profiles remain intact with repeat FNAs,
such that comparisons between FNAs can be used to dis-tinguish between different forms of breast tumor.
Our results also suggest that gene expression profiles obtained before and changes after one cycle of chemotherapy correlate with response to treatment. In the analysis of the pretreatment expression profiles, we identi-fied 37 genes differentially expressed in pretreatment samples that together could segregate excellent respon-ders from the poorer responrespon-ders. Although the ‘leave one out’ cross-validation approach that we performed with the profiles from the pretreatment samples suggested that these 37 genes could correctly classify all patients, our numbers are small and the results should therefore be considered exploratory. Nevertheless, the comprehensive nature of array analysis permits the framing of hypothetical gene sets even with small sample sizes that can be
vali-Figure 3
dated with an independent and larger set of breast cancer patients in a prospective manner.
The change in gene expression as measured by the number of outliers when comparing the pretreatment and post-treatment samples seems to be more substantial in the responder than the non-responder group. This might be expected because changes in expression should be associated with the more effective cellular intervention. Thus, responders and non-responders could be differenti-ated both by specific gene changes and by the quantity of the change in expression.
An additional benefit of studying gene expression profiles is the identification of genes and/or gene pathways, which might associate with the response or intrinsic resistance to chemotherapy. Examination of the subset of genes identified before any treatment (Fig. 2a) revealed that these ‘discriminators’ are involved in a variety of cellular functions. This list included transcription factors (ERGand
NFYB), oncogene (DLC1), growth factor receptors (KIT), genes involved in the ubiquitin–proteasome pathway (UBPH) and DNA repair and cell death regulators
(HMG1, COX 17, PAPPA, BCL2-like2, GADD34, RPL27
and CD44).
One of these genes, HMG1 (for high-motility group protein 1), was more highly expressed in responders. This gene encodes a structure-specific HMG-domain protein that is evolutionarily conserved. HMG1 binds preferentially to cruciform DNA, cisplatin-modified DNA, and other dis-torted structures. Overexpression of HMG1 has been shown to sensitize cells to cisplatin and carboplatin by shielding its major DNA adducts from nucleotide excision repair [12]. Depleting HMG1 and HMG2 from cell extracts by immunoprecipitation enhances the excision repair of cisplatin-modified DNA. Furthermore, introducing HMG2 by transfection enhances the cisplatin sensitivity of a lung adenocarcinoma cell line [13]. Thus, overexpres-sion of HMG1 in the group of good responders might confer an increased sensitivity to the cytotoxic effect of chemotherapy.
Another interesting finding was the upregulated expres-sion of COX17 (for cytochrome c oxidase assembly protein) in the good responders group. This gene encodes a copper-binding chaperone for cytochrome c oxidase (COX), the terminal enzyme of the mitochondrial respira-tory chain. Dysfunction of the mitochondrial respirarespira-tory chain has been associated with apoptosis induction [14]. Interestingly, one of the cytotoxic mechanisms of doxoru-bicin is to inhibit COX activity [15]. Additionally, decreased COX expression was observed in doxorubicin-resistant leukemia K562 cells [16]. Thus, the overexpres-sion of this cytochrome oxidase would be consistent with the association with better responders.
Finally, CD44, a main cell-surface receptor for hyaluronic acid, was downregulated in the group of good respon-ders. CD44 is involved in matrix adhesion, lymphocyte activation, and the regulation of tumor proliferation. Several reports have shown an association between decreased CD44 expression and facilitation of apoptosis [17]. One of the mechanisms of this activity is thought to be the CD95/FAS-triggered induced shedding of CD44. Clinically, a decrease in CD44v6 expression has also been linked to a better response of neoadjuvant anthracy-cline-based treatment in cervical cancer [18].
Similar observations could also be made about genes whose expression was altered after one cycle of chemotherapy. For example, Cdk9, which encodes a cat-alytic subunit of TAK (cyclin T1/P-TEFb) and has been shown to have an antiapoptotic function during monocyte differentiation [19], was induced in the group of poor responders after the first treatment. TIMP-1, a collagenase inhibitor that was downregulated in the good responders, has been reported to control the cell growth phenotype during breast cancer development in an autocrine and paracrine manner [20]. Finally, DCTD, a gene that tran-scribes dCMP deaminase and is associated with increased resistance to cytarabine [21], was also induced in the poor responders. Taken together, these results indi-cate that the induction of genes associated with cellular resistance to chemotherapy seems to be associated with a poor clinical response, whereas a marker of cell growth seems to be downregulated in the good responders after one cycle of chemotherapy.
Our results indicate the complexity of genetic alterations involving various molecular pathways that might be associ-ated with intrinsic and/or acquired resistance to chemotherapy in breast cancer. However, these expres-sion profiles could represent a distinct signature for drug resistance in this particular small group of breast cancer patients. Interestingly, we have found that the dynamic changes after a single cycle of chemotherapy might further distinguish good responders from poor respon-ders. The small numbers in our study preclude the defini-tive assignment of association genes with response, but these results have identified a significant list of plausible candidate markers that should be validated in larger clini-cal data sets.
which could be involved in intrinsic chemoresistance and could prove to be useful in identifying targets for the treat-ment of drug-resistant carcinomas.
Acknowledgements
We are grateful to Dr Richard Simon and Dr Amy Peng, who provided the BRB ArrayTools software. This work was supported in part by the ‘Fonds National de la Recherche Scientifique’, Belgium, grant Ext 260, V6/5/2-ILF, 14773 to Christos Sotiriou.
References
1. Early Breast Cancer Trialists’ Collaborative Group: Poly-chemotherapy for early breast cancer: an overview of the ran-domised trials.Lancet1998, 352:930-942.
2. Chang J, Powles TJ, Allred DC, Ashley SE, Clark GM, Makris A, Assersohn L, Gregory RK, Osborne CK, Dowsett M: Biologic markers as predictors of clinical outcome from systemic therapy for primary operable breast cancer.J Clin Oncol1999, 17:3058-3063.
3. Ellis PA, Smith IE, McCarthy K, Detre S, Salter J, Dowsett M: Pre-operative chemotherapy induces apoptosis in early breast cancer.Lancet1997, 349:849.
4. Chang J, Ormerod M, Powles TJ, Allred DC, Ashley SE, Dowsett M: Apoptosis and proliferation as predictors of chemotherapy response in patients with breast carcinoma.Cancer2000, 89: 2145-2152.
5. Gruvberger S, Ringner M, Chen Y, Panavally S, Saal LH, Borg A, Ferno M, Peterson C, Meltzer PS: Estrogen receptor status in breast cancer is associated with remarkably distinct gene expression patterns.Cancer Res2001, 61:5979-5984. 6. Sorlie T, Perou CM, Tibshirani R, Aas T, Geisler S, Johnsen H,
Hastie T, Eisen MB, van de Rijn M, Jeffrey SS, Thorsen T, Quist H, Matese JC, Brown PO, Botstein D, Eystein Lonning P, Borresen-Dale AL: Gene expression patterns of breast carcinomas dis-tinguish tumor subclasses with clinical implications.Proc Natl Acad Sci USA2001, 98:10869-10874.
7. Sotiriou C, Chand K, Petersen D, Jazaeri A, Liu ET: Core biopsies can be used to distinguish differences in expression profiling by cDNA microarrays.J Mol Diagn2002, 4:30-36.
8. Eberwine J, Yeh H, Miyashiro K, Cao Y, Nair S, Finnell R, Zettel M, Coleman P: Analysis of gene expression in single live neurons.
Proc Natl Acad Sci USA1992, 89:3010-3014.
9. Wang E, Miller LD, Ohnmacht GA, Liu ET, Marincola FM: High-fidelity mRNA amplification for gene profiling.Nat Biotechnol
2000, 18:457-459.
10. Eisen MB, Spellman PT, Brown PO, Botstein D: Cluster analysis and display of genome-wide expression patterns.Proc Natl Acad Sci USA1998, 95:14863-14868.
11. Golub TR, Slonim DK, Tamayo P, Huard C, Gaasenbeek M, Mesirov JP, Coller H, Loh ML, Downing JR, Caligiuri MA, Bloom-field CD, Lander ES: Molecular classification of cancer: class discovery and class prediction by gene expression monitor-ing.Science1999, 286:531-537.
12. He Q, Liang CH, Lippard SJ: Steroid hormones induce HMG1 overexpression and sensitize breast cancer cells to cisplatin and carboplatin.Proc Natl Acad Sci USA2000, 97:5768-5772. 13. Arioka H, Nishio K, Ishida T, Fukumoto H, Fukuoka K, Nomoto T,
Kurokawa H, Yokote H, Abe S, Saijo N: Enhancement of cis-platin sensitivity in high mobility group 2 cDNA-transfected human lung cancer cells.Jpn J Cancer Res1999, 90:108-115. 14. Desagher S, Martinou JC: Mitochondria as the central control
point of apoptosis.Trends Cell Biol2000, 10:369-377. 15. Muller I, Niethammer D, Bruchelt G: Anthracycline-derived
chemotherapeutics in apoptosis and free radical cytotoxicity (Review).Int J Mol Med1998, 1:491-494.
16. Denis-Gay M, Petit JM, Mazat JP, Ratinaud MH: Modifications of oxido-reductase activities in adriamycin-resistant leukaemia K562 cells.Biochem Pharmacol1998, 56:451-457.
17. Naot D, Sionov RV, Ish-Shalom D: CD44: structure, function, and association with the malignant process.Adv Cancer Res
1997, 71:241-319.
18. Costa S, Terzano P, Bovicelli A, Martoni A, Angelelli B, Santini D, Ceccarelli C, Lipponen P, Erzen M, Syrjanen S, Syrjanen K: CD44 isoform 6 (CD44v6) is a prognostic indicator of the response to neoadjuvant chemotherapy in cervical carcinoma.Gynecol Oncol2001, 80:67-73.
19. Foskett SM, Ghose R, Tang DN, Lewis DE, Rice AP: Antiapop-totic function of CDK9 (TAK/P-TEFb) in U937 promonocytic cells.J Virol2001, 75:1220-1228.
20. Luparello C, Avanzato G, Carella C, Pucci-Minafra I: Tissue inhibitor of metalloprotease (TIMP)-1 and proliferative behav-iour of clonal breast cancer cells. Breast Cancer Res Treat
1999, 54:235-244.
21. Schroder JK, Seidelmann M, Kirch HC, Seeber S, Schutte J: Assessment of resistance induction to cytosine arabinoside following transfer and overexpression of the deoxycytidylate deaminase gene in vitro.Leukoc Res1998, 22:619-624. 22. Tukey JW: Tightening the clinical trial.Control Clin Trials1993,
14:266-285.
Supplementary material: patients and methods
Patients and collection of samples
At least three cytospin slides were made for each FNA with the Shandon Cytospin technique (Shandon, Pittsburgh, Pennsylvania, USA) on 0.5 ml of the cell sus-pension centrifuged at 500 rev/min for 5 min on 3-amino-propyltriethoxsilane slides. One of these slides was stained with May–Grünwald–Giemsa as a representative cytodiagnosis of the remaining 2 ml of the cell suspension to be used for RNA extraction. The remaining two slides were used to determine estrogen receptor and proges-terone receptor status receptors by immunohistochem-istry. RNA quality from each FNA was assessed by visualization of the ratio of 28S to 18S ribosomal RNA on 1% agarose gel. Clinical response was defined as plete or nearly complete response (good response) com-pared with partial or no response (poor response), which we have previously defined as the best prediction model for subsequent relapse or survival advantage and used as the criteria for response in our previous marker studies [2].
Data analysis
Spot filtering
For each fluorescent channel, the log ratios were normal-ized by subtracting the median log ratio from each experi-ment. Spots of any experiment that had a red and/or green intensity less than 250 units after subtraction of the back-ground, had a spot size less than 25 pixels, or were flagged for any experimental reason in more than 10% of the microarray experiments were filtered out.
Compound covariate predictor
Classification of specimens into one of two predetermined classes based on gene expression data was performed with a compound covariate predictor. The predictor was built in two steps. First, a standard two-sample t-test was performed to identify genes with significant differences (at level a) in log expression ratios between the two classes. Second, the log expression ratios of differentially expressed genes were combined into a single compound covariate [22] for each specimen; the compound covariate was used as the basis for class prediction. The compound covariate for specimen iwas defined as
where tj is the t-statistic for the two-group comparison of classes with respect to gene j, xijis the log ratio measured in specimen i for gene j, and the sum is over all differen-tially expressed genes. Then the specimen to be classified was removed from the data set and the remaining speci-mens (comprising the training set) were used to determine the differentially expressed genes between the two classes. Using the log expression ratios of these genes, the value of the compound covariate was computed for every specimen in the training set and a classification threshold was calculated (the midpoint of the means of the compound covariates for the two classes was used as the threshold). The class of the omitted specimen was then predicted by computing the value of the compound covariate for the specimen, and which side of the thresh-old it fell on (that is, which class mean it was closest to) was determined. The entire process was repeated so that every specimen was omitted once and its class member-ship was predicted; the number of misclassified speci-mens was tallied. To determine whether the accuracy for predicting membership of specimens in the two given classes (as measured by the number of correct classifica-tions) was better than the accuracy that could be attained for predicting membership in random groupings of speci-mens, we examined the distribution of the number of mis-classifications for data sets in which the class labels were permuted. Random data sets were created by permuting class labels between the specimens, and cross-validated class prediction was performed on the resulting data sets as described above. The percentage of permutations that resulted in no greater number of misclassifications than for the original labeling of specimens was reported. If fewer than 5% of the permutations resulted in as few or fewer misclassifications, the accuracy of prediction into the given classes was considered significant.
RT–PCR
Primers and probes (BioServe Biotechnologies, Laurel, Maryland, USA) were designed with Primer Express soft-ware (Applied Biosystems). Probes were 5′-labeled with 6-carboxyfluorescein (FAM) and 3′-labeled with 6-car-boxytetramethylrhodamine (TAMRA). Sequences were as follows. CD44: sense, 5′ -TCACCAAATGCACCATTTCCT-3′; antisense, 5′-GTGATCAACAGTGGCAATGGA-3′; probe, 5′-ACTTGCTGGCCTCTCCGTTGAGTCC-3′. COX17: sense, 5′-CGAGGCTGGCATAGATTTGG-3′; antisense, 5′-AACCAGACCCGGCATCTTTC-3′; probe, 5′ -TGTCTC-CGCTCATAGCTGCTTTTGGC-3′. HMG1: sense, 5′ -GCG-GACAAGGCCCGTTA-3′; antisense, 5′ -AGAGGAAGAA-GGCCGAAGGA-3′; probe, 5′ -AAAGAAGTTCAAGGA-TCCCAATGCACCC-3′. cDNA was generated from ampli-fied RNA samples (2 ng per assay) by using MultiScribe reverse transcriptase and random hexamers for priming (Applied Biosystems). Reaction conditions were 10 min at 25°C, 30 min at 48°C, and 5 min at 95°C. PCR reactions were conducted in a volume of 25µl by using AmpliTaq