R E S E A R C H A R T I C L E
Open Access
Analysis of medication consultation
networks and reporting medication errors:
a mixed methods study
Pattarida Janmano
1,3, Uraiwan Chaichanawirote
2,3and Chuenjid Kongkaew
3,4*Abstract
Background:To examine characteristics of verbal consultation about medication within social networks of hospital inpatient medication system, and their associations with medication error reporting.
Method:The setting was a 90-bed provincial district hospital with 4 wards, 7 physicians, 5 pharmacists, 44 nurses, 5 pharmacist assistants, and 4 unskilled ancillary workers. A mixed method comprising (i) a prospective observational study for investigating incidences and the nature of reporting medication errors, and (ii) a social network analysis for patterns of interaction.
Results:Out of 5296 prescriptions, 132 medication errors were reported during the one month study period: an incidence rate of 2.5%. Every incident of medication errors was formally documented through pharmacists. The most frequent medication errors were in pre-transcribing (n= 54; 40.9%). The pharmacists were central in the whole network of consultation on medication with the mean in-degree centrality of 35 (SD 14.9) and mean out-degree centrality of 15.4 (SD 11.1). Two bridging participants were identified who were influential communicators connecting the network (betweenness centrality). Medication error reporting were influenced by (i) participants whose advice is sought and viewed as trustworthy (in-degree centrality;p< 0.001), (ii) sex (p= 0.01), and (iii) level of education (p= 0.04).
Conclusion:In-degree centrality was the most important network characteristic. A culture of medication safety can be fostered by encouraging consultation about the medication of in-patients within the hospital network where reporting of medication errors is essential.
Keywords:Medication error, Social network analysis, Medication safety
Background
Patient safety is defined as the prevention of errors and adverse effects on patients related to their health care [1] and is an important aspect of healthcare policy worldwide [2–4]. Close attention to patient safety associates with lowered incidences of adverse events in hospitals [5], while a poor safety culture leads to increased error rates [6].
Previous studies demonstrated that poor communica-tion about patient medicacommunica-tion led to potentially harmful medication errors [7–9]. Miscommunication about
medications (e.g., medication errors) within social net-works of healthcare professionals [10, 11] including the effective reporting of errors has been an indicator that impinges on patient safety in healthcare settings [10] but also has provided enough information to develop an ef-fective risk-management plan [12].
Social network analysis reveals details about complex communications and interactions between members in a network [13,14] as applied to various healthcare settings (e.g., primary care, or hospital wards) [15,16]. In pharma-ceutical treatments, a unique pattern of social network in each healthcare setting can steer behaviours within orga-nizations towards risk reduction in such environments. We therefore sought to examine characteristics of com-munication in the form of consultation about medication * Correspondence:[email protected]
3
Research Centre for Safety and Quality in Health, Faculty of Pharmaceutical Sciences, Naresuan University, Phitsanulok 65000, Thailand
4Research Department of Practice and Policy, School of Pharmacy, University
College London, London, UK
Full list of author information is available at the end of the article
within social networks that are found in hospital inpatient medication systems, and their associations with medica-tion error reporting.
Method
Design, and study setting
A mixed methodology was employed: (i) a prospective observational study to investigate incidences and the na-ture of reporting medication errors; (ii) a social network analysis of patterns of interactions within a hospital medication system.
This study was undertaken within an inpatient department of a 90-bed district hospital in Thailand, which included male and female general medical wards, an intensive-care unit (ICU), and a private medical ward. The average occu-pancy rate was ~ 60 inpatients during the study period.
In this hospital, the flow of the medication process began with (i) prescribing (physicians) by a hand-written entry on to the order sheet, (ii) pre-transcribing (nurses) by electronic scanning of the order sheet and transferring its information on to the pharmacy computer terminal, (iii) transcribing and appropriate labels pertaining to the medicine (pharmacists), (iv) pre-dispensing (pharmacist assistants) by filling the medicine pack as per label, and the pharmacist verifying accordance between the pack contents, the label, and the prescription, (v) dispatching the dispensed medications (pharmacists) to the appropri-ate ward (vi) pre-administration (nurses) to verify a match between the medication and the corresponding order sheet (vii) the medication administered (nurses) to the patient.
Characteristic of participants
During the study period, 65 employees worked within the inpatient medication system: 7 physicians (1 medical specialist in internal medicine, and 6 junior physicians), 5 pharmacists, 44 nurses, 5 pharmacist assistants, and 4 unskilled ancillary workers.
Data collection and analysis
To understand social networks in the medication sys-tem, this study required data on both reports about medication errors, and the consultation networks. Reports of these medication errors were collected at every stage of the medication process [17] and were graded as A to I as defined by the National Coordinating Council for Medication Error Reporting and Prevention (NCCMERP) [18]. Such error reports were collected for the 1-month period through the hospital spontaneous reporting system [19]. Staff were encouraged to report any event to the risk management committee. Reporters were anonymised using a code according to the protocol of data collection on consultation networks. On
completing the data gathering, the reports were analysed using descriptive statistics.
Data on consultation networks in the medication sys-tem were collected from all 65 hospital participants by a structured face-to-face interview in a designated room to recall the previous months data collection period, in which data on medication errors were obtained. Two main questions were asked: (i) whether the participant consulted others about obstacles to medication use and medication-related problems. When the participant had consulted with others, they then provided the informa-tion about frequency of consultainforma-tions based on recall over the last month; and (ii) who was consulted. (Additional file1) Interview questionnaires were adapted from previous studies [15,20] and validated by three ex-perts in social network analyses and hospital medication systems. In this study, an ‘item objective congruence (IOC) index’ greater than 0.5 indicated an acceptable questionnaire content [21]. The information derived from the interview was then transformed to social net-work data (sociogram). Each pair of a relationship indi-cated a directed link from an informant to the consulting person in the network.
to another, those with high betweenness centrality seem to be a bridging person. An individual who provides a link between two different clusters demonstrates high be-tweenness centrality and is recognized as a‘bridger’. With-out a bridger, the network is disconnected. Therefore, finding bridgers is of importance because they represented those who often transfer information between groups and provide valuable opportunities for innovation [23].
Factors affecting the reporting of medication errors were analysed using linear regression [24] with the forward selection method using IBM SPSS Statistics version 23. Individual characteristics, in-degree, out-degree, and betweenness centrality were selected as the variables that influence reporting of medication errors. All statistical analyses were performed at a sig-nificance level of < 0.05.
Results
Characteristics of inpatient hospital staffs
Staff had an average age of 46.2 years (range 41–50) and were mostly female (n= 54; 83%). Healthcare professions included physicians (n= 7; 10.8%); nurses (n= 44; 67.7%), pharmacists (n = 5; 7.7%), pharmacist assistants (n = 5; 7. 7%); and unskilled workers (n = 4; 6.2%). The majority of staff were educated to Bachelor level (n= 50; 77%).
Characteristics of reporting medication errors
A total of 5296 prescriptions were dispensed and 132 medication errors were reported during the study period,
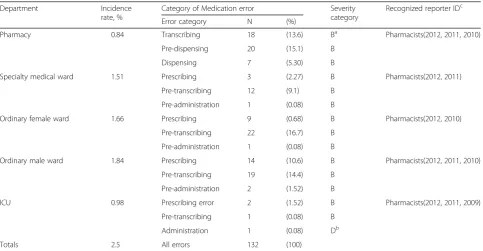
an incidence of 2.5% of prescriptions. All medication error incidents were documented by pharmacists. Nearly all were judged as category B (n = 131; 99.2%), and one of category D. There were 54 pre-transcribing errors (40. 9%), 28 prescribing errors (21.2%), and 20 pre-dispensing errors (15.2%). Medication errors tended to be higher in hospital wards (Table1).
Interactions among staff
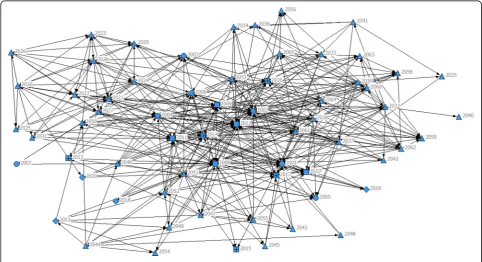
Consultation among the 65 staff showed that pharma-cists played the greatest role in consultations indicated by a mean in-degrees centrality of 35.0 (SD = 14.9) while for physicians, it was 17.3 (SD = 12.5), 10.8 (SD = 6.4) for pharmacist assistants, 7.0 (SD =4.7) for nurses, and 4 (SD = 2) for unskilled workers (Table 2).Figure 1 illus-trates networks of medication consultation among staff. Several arrows pointed towards the staff with IDs of 2009, 2010, 2011, and 2012 (squares), indicating high in-degree centrality and appeared to be recognized re-porters (Table1).
The frequency at which consultations were sought about medications from other practitioners within the inpatient medication network were more evenly balanced between the health professions: mean out-degree centrality for physicians was1.71 (SD = 2.4); 15.4(SD = 11.1) for pharmacists, 11.7 (SD = 9.3) for nurses, 10.8 (SD = 13.8) for pharmacist assis-tances, and 2.7 (SD = 0.6) for unskilled workers. Table 2
[image:3.595.57.541.454.705.2]shows the highest in-degree centrality for each profession in the medication system. By profession, (i) physicians had
Table 1Incidence rate, category of medication error, severity category and recognized reporter in each department
Department Incidence
rate, %
Category of Medication error Severity category
Recognized reporter IDc
Error category N (%)
Pharmacy 0.84 Transcribing 18 (13.6) Ba Pharmacists(2012, 2011, 2010)
Pre-dispensing 20 (15.1) B
Dispensing 7 (5.30) B
Specialty medical ward 1.51 Prescribing 3 (2.27) B Pharmacists(2012, 2011)
Pre-transcribing 12 (9.1) B
Pre-administration 1 (0.08) B
Ordinary female ward 1.66 Prescribing 9 (0.68) B Pharmacists(2012, 2010)
Pre-transcribing 22 (16.7) B
Pre-administration 1 (0.08) B
Ordinary male ward 1.84 Prescribing 14 (10.6) B Pharmacists(2012, 2011, 2010)
Pre-transcribing 19 (14.4) B
Pre-administration 2 (1.52) B
ICU 0.98 Prescribing error 2 (1.52) B Pharmacists(2012, 2011, 2009)
Pre-transcribing 1 (0.08) B
Administration 1 (0.08) Db
Totals 2.5 All errors 132 (100)
a
Category B: An error occurred but the error did not reach the patient;b
Category D: An error occurred that reached the patient and required monitoring to confirm that it caused no harm to the patient and/or required intervention to prevent harm;c
highest in-degree centrality in prescribing; (ii) pharmacists in transcribing, dispensing, dispensing, and administration, and (iii) nurses in transcribing, pre-administration, and administration.
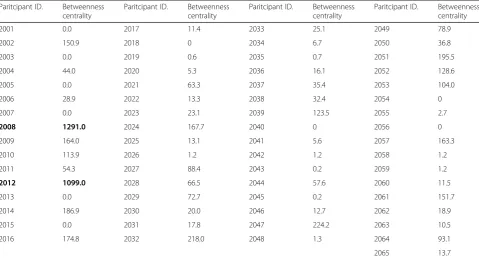
Two bridgers (participant IDs 2008 and 2012) were identified as important in the whole network by their high betweenness centrality (Table3).
Associations between characteristics of consultation on medication and medication error reporting
Three factors: in-degree centrality (β= 0.7; p < 0.001), sex (β=−0.3; p = 0.01), and education level (β=−0.2;
[image:4.595.57.539.99.250.2]p = 0.04), were associated with reporting of medication errors (Table 4). Individual staff having high in-degrees centralities were linked to greater incidences of initiating
Table 2Means of in-degree centrality and out-degree centrality for each type of profession from a workforce Profession Mean of in-degree centrality (S.D.) Mean of out-degree
centrality (S.D.)
Steps with highest in-degreea(IDb;
No. in-degreec) No. of reports
Physicians 17.3 (12.5) 1.71 (2.4) Prescribing (2002; 35) 0
Pharmacists 35.0 (14.9) 15.4 (11.1) Transcribing (2012; 20)
Pre-dispensing (2012; 10) Dispensing (2012, 18) Pre-administration (2012, 6)
132
Pharmacist assistants 10.8 (6.4) 10.8 (13.8) – 0
Nurses 7.0 (4.7) 11.7 (9.3) Pre-transcribing(2021, 4)
Pre-administration (2022, 6; 2023, 6) Administration(2021,5; 2028, 5; 2029, 5)
0
Health workers 4.0 (2.0) 2.7 (0.6) – 0
Whole network 10.4 (10.4) 10.4 (9.7) – 132
a
Steps in the medication system where each profession demonstrated the highest in-degree centrality;b
ID is anonymous code given to each person in the study cohort;c
Represent the highest in-degree in each step; in-degree centrality = a measure of the number of consultation the informant were asked for from other staff directed to an informant; out-degree centrality = the number of links that an informant sought consultation with other network members
[image:4.595.56.539.426.688.2]reports of medication errorsespecially females. In addition, staff with a bachelor degree were more to report errors than staff graduating at higher degree levels.
Discussion
This is the first study to examine the association be-tween characteristics of social network and reporting among staff in the inpatient medication systems. Our findings revealed that pharmacists were central for medication consultation in the inpatient medication sys-tem of the whole network, which accords with their pro-fessional training and their recognition as experts in pharmacotherapy. This tallies with a previous study from a renal ward at an Australian metropolitan teaching hos-pital [15]. However, each profession played its own cen-tral role in different steps of the medication system. Regular updating of their knowledge and skills in
medication use through continuing pharmacy education (CPE) programs is essential for safeguarding patients and making changes towards a safety culture in the process of medication use [25,26].
[image:5.595.58.538.99.358.2]Our findings about the role of bridgers in social net-works has important implications to the development of organisations since a bridger represents a connector to other members of the network. They usually provide im-portant information to others because this person is able to reach out and gain information from sub-networks better than other members in the network [23]. A brid-ger is perceived as an intermediary in the whole network for people seeking advice and to report any medication problems. In any healthcare setting, identification of bridgers, and support for their role will increase interac-tions among healthcare staff in medication consultation, thereby promoting a safety culture.
Table 3Betweeness centrality for each participant. The cells in bold show two bridger participants Paritcipant ID. Betweenness
centrality
Paritcipant ID. Betweenness centrality
Paritcipant ID. Betweenness centrality
Paritcipant ID. Betweenness centrality
2001 0.0 2017 11.4 2033 25.1 2049 78.9
2002 150.9 2018 0 2034 6.7 2050 36.8
2003 0.0 2019 0.6 2035 0.7 2051 195.5
2004 44.0 2020 5.3 2036 16.1 2052 128.6
2005 0.0 2021 63.3 2037 35.4 2053 104.0
2006 28.9 2022 13.3 2038 32.4 2054 0
2007 0.0 2023 23.1 2039 123.5 2055 2.7
2008 1291.0 2024 167.7 2040 0 2056 0
2009 164.0 2025 13.1 2041 5.6 2057 163.3
2010 113.9 2026 1.2 2042 1.2 2058 1.2
2011 54.3 2027 88.4 2043 0.2 2059 1.2
2012 1099.0 2028 66.5 2044 57.6 2060 11.5
2013 0.0 2029 72.7 2045 0.2 2061 151.7
2014 186.9 2030 20.0 2046 12.7 2062 18.9
2015 0.0 2031 17.8 2047 224.2 2063 10.5
2016 174.8 2032 218.0 2048 1.3 2064 93.1
2065 13.7
Betweeness centrality = the degree of shortest path of consultation seeking between all staff passing through the informant
Table 4Linear regression analyses to predict the association between the characteristics of consultation and medication error reporting
Model Unstandardized
Coefficients
Standardized Coefficients
tc p-value
Ba SE βb
Constant −5.4 1.9 −2.9 0.005
In-degree centrality 1.0 0.1 0.7 7.2 < 0.001
Sex −9.6 3.7 −0.3 −2.6 0.012
Highest education level −8.7 4.2 −0.2 −2.1 0.041
a
B is the predicted regression coefficient;βb
is Standardized Coefficients;c
t is the t-statistic. The correlation coefficient (R2
[image:5.595.57.538.622.715.2]Three factors that significantly associated with report-ing of medication errors were (a) in-degree centrality, (b) sex, and (c) level of education. In-degree was the most influential factor for reporting medication errors in the hospital, because staff with higher in-degree would report more medication errors than those with a lower in-degree. Noteworthy in our study, was that staff who first identified an error did not always directly enter the event into the system but rather consulted with a staff member having a high in-degree and appeared to be members of the risk management committee who were responsible for dealing with risks. This is probably be-cause (i) staff who identify errors (‘whistle-blowers’) tend to worry about offending the co-worker and of reprisals [10] in spite of error reporting being specified in the guidelines and guaranteed anonymity; (ii) staff with high in-degree’s characteristics included both approachability by others and an official role according to the organizational structure. This reflects a hospital policy of only enforces the reporting of medication errors that have not been success-fully implemented. Our findings strongly suggest that pro-moting consultation among staff including pharmacists provides greater error detection rates and minimises the risk of errors escaping detection. Thus, a positive working environment that deals with errors is thereby promoted and may lead to higher reporting of medication errors [27]. A qualitative study (e.g. focus group interview) should be performed to further confirm the reasons why errors are identified but fail to be reported.
Female staff showed higher reporting rates of medica-tion errors than males. The explanamedica-tion for this may be because most male staff in this study (physicians and pharmacy heads)had more managerial roles than front line staff who are more likely to be female (eg, nurses, pharmacists).
Staff at bachelor level appeared to report more medi-cation errors compared to those with either higher or lower education levels: high educational achievement again equated with more managerial roles, while low at-tainment was associated with unskilled front line staff (eg, pre-packing medications or packing medications as labelled) who were not required to double-check label-ling, etc., and thus unlikely to detect errors.
This study has much strength. All health professionals and workers contributed thus representing the whole network. Interviews using a validated questionnaire in a dedicated private room was employed to gain complex details of interaction between relevant staff. This con-tributes to a better quality of network data [28, 29]. Re-call bias was minimized by asking staff about the consultations with colleagues on medications during just the previous month, whereas asking after 12 months of experiences may increase the probabilities of biases [15,
20]. This study also applied a sociocentric data collection
methodology to assess the overall network performance rather than pinpointing individuals.
There were some study weaknesses. Although all staff were involved, the participant complement of the net-work was rather small which may contribute to less vari-ability of reporting or reduce the relivari-ability of the linear regression. In addition, this study could only detect errors found by recognized reporters, while staff are re-luctant to report their own errors. [10,30]. Furthermore, future studies should also audit medical records. This study could not analyse egocentric data which otherwise reveals the root cause of error because it breaks ano-nymity and violates study ethics [31].
Conclusion
In-degree centrality was the most influential charac-teristic for reporting medication errors in the hospital inpatient medication system. Both the discovery and reporting of medication errors can be improved by creating an environment where consultation about medication regimes are promoted between members of a network and with pharmacists.
Additional file
Additional file 1:Interview guide for consultation networks in the medication system. (DOCX 12 kb)
Abbreviations
ICU:intensive care unit; NCCMERP: National Coordinating Council for Medication Error Reporting and Prevention
Acknowledgements
We would like express our appreciation to Pipat Munkong for guidance in data analysis and Dr. Norman Scholfield for reviewing this manuscript.
Funding
Research Fund for Postgraduate Thesis, Faculty of Pharmaceutical Sciences, Naresuan University.
Availability of data and materials
Data for this study is available upon request.
Authors’contributions
CK conceived and supervised the study; PJ, UC and CK contributed in the design of the study. PJ performed data acquisition/the interview and analysed the data. PJ, UC and CK interpreted and drafted the manuscript. UC and CK critically reviewed and revised the manuscript. All authors read and approved the final manuscript.
Competing interest
The authors declare that they have no competing interests.
Ethics approval and consent to participate
The study was approved by the Naresuan University Institutional Review Board (IRB No.449/57). A written informed consent indicating consent to participate in the study was obtained from every participant.
Consent for publication
Publisher’s Note
Springer Nature remains neutral with regard to jurisdictional claims in published maps and institutional affiliations.
Author details
1Department of Pharmacy, Phrasamutchedisawatyanon Hospital,
Samutprakan 10290, Thailand.2Faculty of Nursing, Naresuan University, Phitsanulok 65000, Thailand.3Research Centre for Safety and Quality in Health, Faculty of Pharmaceutical Sciences, Naresuan University, Phitsanulok 65000, Thailand.4Research Department of Practice and Policy, School of Pharmacy, University College London, London, UK.
Received: 2 March 2017 Accepted: 20 March 2018
References
1. Patient Safety: World Health Organization Regional offer for Europe.http:// www.euro.who.int/en/health-topics/Health-systems/patient-safety. Accessed 24 Mar 2018.
2. 10 facts on patient safety. World Health Organization. 2014.http://www. who.int/features/factfiles/patient_safety/en/. Accessed 24 Mar 2018. 3. 2010-2015 government policy: patient safety. Department of Health, UK.
2015. https://www.gov.uk/government/publications/2010-to-2015- government-policy-patient-safety/2010-to-2015-government-policy-patient-safety. Accessed 24 Mar 2018.
4. Patient Safety in Primary Health Care- a review of the literature 2015. Australian commission on safety and quality in health care. 2015.https:// www.safetyandquality.gov.au/publications/patient-safety-in-primary-health-care-a-review-of-the-literature-2015/. Accessed 24 Mar 2018.
5. Najjar S, Nafouri N, Vanhaecht K, Euwema M. The relationship between patient safety culture and adverse events: a study in palestinian hospitals. Saf Health. 2015;1:1–9.
6. Safety Culture. U.S. Department of Health and Human Services. 2016.
https://psnet.ahrq.gov/primers/primer/5/safety-culture. Accessed 24 Mar 2018.
7. Leonard M, Graham S, Bonacum D. The human factor: the critical importance of effective teamwork and communication in providing safe care. Qual Saf Health Care. 2004;13(Suppl 1):i85–90.
8. Brock D, Abu-Rish E, Chiu CR, Hammer D, Wilson S, Vorvick L, et al. Interprofessional education in team communication: working together to improve patient safety. BMJ Qual Saf. 2013;22:414–23.
9. Frydenberg K, Brekke M. Poor communication on patients’medication across health care levels leads to potentially harmful medication errors. Informa healthcare. 2012;30:234–40.
10. Nieva VF, Sorra J. Safety culture assessment: a tool for improving patient safety in healthcare organizations. Qual Saf Health Care. 2003;12 Suppl(2):ii17–23.
11. Cox SJ, Cheyne AJT. Assessing safety culture in off shore environments. Saf Sci. 2000;34:111–29.
12. Kaldjian LC, Jones EW, Wu BJ, Forman-Hoffman VL, Levi BH, Rosenthal GE. Reporting medical errors to improve patient safety. Arch Intern Med. 2008; 168:40–6.
13. Knoke D, Yang S. Social network analysis. 2nd ed. California: Sara Miller McCune,SAGE Publications; 2008. p. 6–15.
14. Scott J. Social network analysis a handbook. 2nd ed. London: SAGE Publications; 2009. p. 1–2.
15. Creswick N, Westbrook JI. Social network analysis of medication advice-seeking interactions among staff in an Australian hospital. Int J Med Inform. 2010;79:e116–25.
16. Scott J, Tallia A, Crosson JC, Orzano AJ, Stroebel C, DiCicco-Bloom B, et al. Social network analysis as an analytic tool for interaction patterns in primary care practices. Ann Fam Med. 2005;3:443–8.
17. Lisby M, Nielsen LP, Mainz J. Errors in the medication process:frequency, type, and potential clinical consequences. Int J Qual Health Care. 2005; 17:15–22.
18. Type of Medication error. National Coordinating Council for Medication Error reporting and Prevention. 2014. http://www.nccmerp.org/types-medication-errors. updated November 20, 2014; Accessed 24 Mar 2018. 19. Anderson DJ, Webster CS. A systems approach to the reduction of
medication error on the hospital ward. J Adv Nurs. 2001;35:34–41.
20. Bradley FL. Exploring interactions between General Practitioners and Community Pharmacists: a novel application of social network analysis. Manchester: University of Manchester; 2012.
21. Turner RC, Carlson L. Indexes of item-objective congruence for multidimensional items. Int J Test. 2003;3:163–71.
22. Borgatti SP, Everett MG, Freeman LC. Ucinet 6 for windows 2002. 23. Hoppe B, Reinelt C. Social network analysis and the evaluation of leadership
networks. Leadersh Q. 2010;21:600–19.
24. Montgomery DC, Peck EA, Vining GG. Introduction to linear regression analysis. 5th ed. Simutaneously: A JOHN WILEY & SONS; 2012. p. 67–128. 25. Phillips J, Beam S, Brinker A, Holquist C, Honig P, Lee LY, et al. Retrospective
analysis of mortalities associated with medication errors. Am J Health Syst Pharm. 2001;58:1835–41.
26. Lesar TS, Briceland L, Stein DS. Factors related to errors in medication prescribing. JAMA. 1997;277:312–7.
27. Wolf ZR, Hughes RG. Patient safety and quality: an evidence-based handbook for nurses. Rockville (MD): Agency for Healthcare Research and Quality (US); 2008. Available from:https://www.ncbi.nlm.nih.gov/books/NBK2652/
28. Braun V, Clarke V. In: Carmichael M, editor. Successful qualitative research: a practical guide for beginners. London: SAGE; 2013. p. 90–2.
29. Mark SL. In: Foster DS, editor. How to Measure Survey Reliability and Validity. California: SAGE; 1995. p. 33–5.
30. Paul B. D SS. Reporting and preventing medical mishaps: lessons from non-medical near miss reporting systems. Br Med J. 2000;320:759–63. 31. World Medical A. World medical association declaration of Helsinki:
ethical principles for medical research involving human subjects. JAMA. 2013;310:2191–4.
• We accept pre-submission inquiries
• Our selector tool helps you to find the most relevant journal • We provide round the clock customer support
• Convenient online submission • Thorough peer review
• Inclusion in PubMed and all major indexing services • Maximum visibility for your research
Submit your manuscript at www.biomedcentral.com/submit