Open Access
Research article
On the validity of area-based income measures to proxy household
income
Gillian E Hanley*
1,2and Steve Morgan
1,2Address: 1Centre for Health Services and Policy Research, University of British Columbia, Vancouver, BC Canada and 2Department of Health Care
and Epidemiology, University of British Columbia, Vancouver, BC Canada
Email: Gillian E Hanley* - ghanley@chspr.ubc.ca; Steve Morgan - morgan@chspr.ubc.ca * Corresponding author
Background: This paper assesses the agreement between household-level income data and an area-based income measure, and whether or not discrepancies create meaningful differences when applied in regression equations estimating total household prescription drug expenditures.
Methods: Using administrative data files for the population of BC, Canada, we calculate income deciles from both area-based census data and Canada Revenue Agency validated household-level data. These deciles are then compared for misclassification. Spearman's correlation, kappa coefficients and weighted kappa coefficients are all calculated. We then assess the validity of using the area-based income measure as a proxy for household income in regression equations explaining socio-economic inequalities in total prescription drug expenditures.
Results: The variability between household-level income and area-based income is large. Only 37% of households are classified by area-based measures to be within one decile of the classification based on household-level incomes. Statistical evidence of the disagreement between income measures also indicates substantial misclassification, with Spearman's correlations, kappa coefficients and weighted kappa coefficients all indicating little agreement. The regression results show that the size of the coefficients changes considerably when area-based measures are used instead of household-level measures, and that use of area-based measures smooths out important variation across the income distribution.
Conclusion: These results suggest that, in some contexts, the choice of area-based versus level income can drive conclusions in an important way. Access to reliable household-level income/socio-economic data such as the tax-validated data used in this study would unambiguously improve health research and therefore the evidence on which health and social policy would ideally rest.
Background
Measures of income are often central to health and health policy research. Among many potential implications, income can be a non-medical determinant of health [1-3]
an enabling factor for access to care[4], or a consideration when judging equity of policies and programs[5]. As important as this variable may be, it is often difficult for health and health policy researchers to obtain reliable,
Published: 10 April 2008
BMC Health Services Research 2008, 8:79 doi:10.1186/1472-6963-8-79
Received: 4 December 2007 Accepted: 10 April 2008
This article is available from: http://www.biomedcentral.com/1472-6963/8/79 © 2008 Hanley and Morgan; licensee BioMed Central Ltd.
individual-level income information for the populations they study. In the absence of individual-level income data, investigators often supplement health research datasets with group-based measures such as area-based average income constructed from national census data[6]. Such measures are used as proxy for individual-level income data on the assumption that household incomes will be reasonably homogeneous within small enough residen-tial areas. If, however, there is significant heterogeneity in the areas used, then the aggregate measures can result in ecological fallacy–when an association observed between variables at an aggregate level does not represent the asso-ciation that exists at an individual level[7].
Prior studies have investigated misclassification of income and other socio-economic variables by comparing individual versus area-level survey responses for small samples of the population[8,9] and by comparing survey-based measures for different sized census areas[10,11]. Using a unique dataset that contains validated household income data for approximately 78% of the population of British Columbia (BC), we investigate the level of misclas-sification that can occur when census-defined, area-based income is used as a proxy for an individual's actual house-hold-level income. As the question of most interest to researchers concerns how well aggregate variables perform when they are entered in health outcomes equations, we then assess the sensitivity of the analysis of health related inequities in total prescription drug costs to whether income is measured as an area-based variable or an house-hold-level variable.
Methods
Data
Our primary datasets are administrative files for the pro-vincially administered, universal public medical and hos-pital health insurance program, Medical Services Plan (MSP) of BC. This program covers virtually all 4.2 million residents of BC, excluding only those residents covered by federal health insurance programs (collectively about 4% of the population). We restrict our attention to house-holds for which one or more member resided in BC for at least 275 days per year from 2001 to 2004, inclusive.
Household income was obtained from the 2004 registra-tion files for provincially administered, universal public pharmaceutical insurance program, BC PharmaCare. In addition to programs for social assistance recipients and other select populations, BC PharmaCare began offering income-based public drug coverage to all residents of the province in May 2003. Terms such as deductibles and co-insurance are based on household income, with more generous but still income-based coverage offered to senior citizens (residents aged 65 and older). For all households that registered to receive coverage, the BC Ministry of
Health obtains net, pre-tax income information from the Canada Revenue Agency. Because of differences in cover-age offered and avercover-age needs, 95% of households with one or more senior member were registered for Fair Phar-maCare in 2004 whereas only 73% of non-senior house-holds were registered.
The area-based income variables used in this study are based on linking MSP registry postal codes to average household income in the area as recorded in the 2001 Census. Statistics Canada collates average household income and composition for over 7,000 Census Dissemi-nation Areas comprised of 400 to 700 persons. For research purposes, these areas are sorted by income and aggregated into 1,000 strata. Income strata contain an average of 1,700 households, with some variation due to variations in populations by postal code. Both the house-hold level and area-based income variables are based on the same income concept, gross income prior to any deductions.
Total individual expenditures on prescription drugs were obtained from BC PharmaNet. BC PharmaNet is an administrative dataset in which every prescription dis-pensed in the province must be entered by law–it is designed to support drug dispensing, drug monitoring and claims processing. These individual expenditures were aggregated at the household level according to regis-tration files for the MSP program to create a variable indi-cating total household spending on prescription drugs.
The research data were extracted for this study from the British Columbia Linked Health Database and the BC PharmaNet database with permission of the BC Ministry of Health and the College of Pharmacists of BC. Ethics approval was obtained from the Behavioural Research Ethics Board at the University of British Columbia.
Statistical methods
The household-specific and area-based income measures were each aggregated into deciles (ordered from lowest to highest income). We assess the discrepancy between the two measures using the CRA validated, household-spe-cific incomes as the standard. We calculated the Spear-man's rank correlations of the various income measures, and both the kappa and weighted kappa to measure the degree of non-random agreement and partial agreement between the measures.
neighbour-hood level income. As measurement error is accommo-dated more easily in regression analysis than in descriptive analysis, we also include a series of dummy variables for both versions of the income variable in an OLS regression in order to determine whether both area-based income and household income generate meaning-fully different results when applied in a research context. We perform regressions of income on total drug expendi-tures with and without covariates controlling for the pres-ence of one or more seniors in the household as well as household size. Through the comparison of coefficients between household-level income variables and area-level income variables, one can reach some conclusions about the appropriateness of substituting an area-based measure for a missing household-level variable in a regression equation. By including regressions with and without cov-ariates, we can determine whether multivariate models influence the discrepancy between area-based and house-hold-level variables.
Results
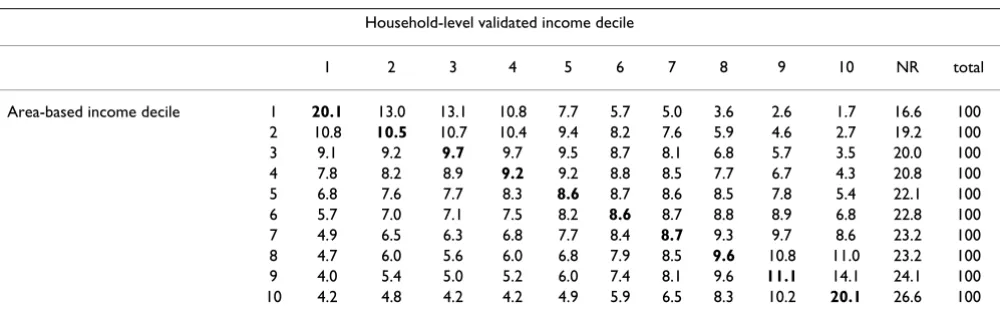
A total of 1.74 million households were registered for MSP and had valid postal codes for linkage with area-based income strata. This cohort accounts for 95% of the total population in the province. Of these households, 1.36 million were registered for the Fair PharmaCare pro-gram. Cross-tabulations of the household-level and area-based income measures are shown in Table 1, where NR indicates the percentage of households in each area-based decile who were not registered for the Fair PharmaCare program at the time of data collection. This table confirms that rates of participation with the income-based program are lower in higher income neighbourhoods. This concen-tration of low incomes for the household-level income variable is because the registration for income-based drug coverage involves a degree of self-selection bias. To adjust for this, our tables below present a "best case" scenario wherein all non-registered households are assigned a
hypothetical household-level income variable that is identical to their area-level income.
Table 2 shows the level of discrepancy between the house-hold-level and based income measures. The area-based measures classify 15.6% of senior households and 14.9% of non-senior households as being within the same income-decile as is determined by tax-reported household income. Approximately a third of non-senior households and two fifths of senior households are classified by area-based measures to be within one decile of the classifica-tion based on household-level incomes. In the "best-case" scenario, just over half of non-seniors and approximately 43% of seniors are within one decile of their household-level income.
Statistical evidence of the disagreement between income measures can be found in Table 3. The Spearman's corre-lations between the actual household-level income and area-based measures are always less than 0.40, suggesting little agreement. The kappa coefficient of non-random, complete agreement never exceeds 0.31 indicating very lit-tle complete agreement between area-based and actual household-level deciles even under the assumption of perfect correlation between area-based and household-level measures for all non-registrants. Again, when exam-ining the weighted kappa coefficients, incorporating par-tial agreement, we see that they never exceed 0.5, even in the best-case scenario.
[image:3.612.55.555.561.718.2]To examine whether these discrepancies result in any meaningful differences in an applied research context, we start by examining the distribution of total prescription drug expenditures by income deciles stratified by senior and non-senior households, first using household-level CRA validated income and then using aggregate neigh-bourhood level income (Table 4). Table 4 indicates that total prescription drug expenditures appear more equally
Table 1: Entire BC population, 2003. Agreement between household-level validated income deciles and area-based income deciles
Household-level validated income decile
1 2 3 4 5 6 7 8 9 10 NR total
Area-based income decile 1 20.1 13.0 13.1 10.8 7.7 5.7 5.0 3.6 2.6 1.7 16.6 100 2 10.8 10.5 10.7 10.4 9.4 8.2 7.6 5.9 4.6 2.7 19.2 100 3 9.1 9.2 9.7 9.7 9.5 8.7 8.1 6.8 5.7 3.5 20.0 100 4 7.8 8.2 8.9 9.2 9.2 8.8 8.5 7.7 6.7 4.3 20.8 100 5 6.8 7.6 7.7 8.3 8.6 8.7 8.6 8.5 7.8 5.4 22.1 100 6 5.7 7.0 7.1 7.5 8.2 8.6 8.7 8.8 8.9 6.8 22.8 100 7 4.9 6.5 6.3 6.8 7.7 8.4 8.7 9.3 9.7 8.6 23.2 100 8 4.7 6.0 5.6 6.0 6.8 7.9 8.5 9.6 10.8 11.0 23.2 100 9 4.0 5.4 5.0 5.2 6.0 7.4 8.1 9.6 11.1 14.1 24.1 100 10 4.2 4.8 4.2 4.2 4.9 5.9 6.5 8.3 10.2 20.1 26.6 100
distributed when we rank households by neighbourhood income than by household-level income, suggesting that neighbourhood level income masks variation in the underlying household-level income variable.
In Table 5 we estimate the effect of household income on total prescription drug expenditures by using both house-hold-level income and neighbourhood level income in separate regressions. The dummy variable for the highest income decile was not included in the regression; thus, the coefficients can be interpreted as the difference in total prescription drug costs between each income decile and the highest income decile. The regression results also reflect the pattern noted in Table 4. While the signs never differ, the household-level variables pick up a substan-tially larger coefficient than the corresponding neighbour-hood-level variable. This again suggests that the neighbourhood-level variables are smoothing the distri-bution of total prescription drug expenditures across income deciles. While the coefficients on income deciles differ substantially between the two models, it is interest-ing to note that the coefficients on presence of seniors and household size do not. Both coefficients are in the same direction and are of the same magnitude indicating that the difference in income variable does not have a large effect on other coefficients in the model. The model based on household-level income also reports a higher adjusted
R[2] statistic than that using the area-based measure, indi-cating that the goodness of fit is higher in the regression using household-level variables. We also find that the inclusion of covariates in the model does not attenuate the bias between the variables substantially (Table 5).
Discussion
We found a sufficient level of discrepancy between the area-based and household-level income measures. Using validated household income as the standard, area-based measures misclassified the income decile for eighty-five percent or more of the households in the data. We also found that these discrepancies did affect the size of coeffi-cients in regression analyses, suggesting that very different conclusions can be reached regarding the 'same' issue depending on which income variable we use. Thus, these results indicate that, at least in some contexts, the choice of neighbourhood versus household income can drive conclusions in an important way. Our results are consist-ent with a large amount of work indicating substantial dis-crepancy between area-based and household SES measures[2,6,8,10].
[image:4.612.53.558.100.204.2]There are also a couple of important caveats. The first is that our study did not examine the inclusion of income as simply one of several control variables, but rather only looked at the difference between household-level and Table 2: Percentage of discrepancy by decile between area-based and household-level income measures
Area-based Measure Group None One Two Three Four Five Six Seven Eight Nine
Actual household-level income All 14.9 22.5 18.5 14.5 10.8 7.7 5.3 3.3 1.8 0.7 Non-seniors 14.9 21.8 18.2 14.7 11.2 7.9 5.4 3.4 1.8 0.7 Seniors 15.6 23.9 19.1 14.4 10.4 7.2 4.7 2.7 1.4 0.6
Best-case scenario All 33.4 18.3 14.4 11.4 8.3 5.4 4.1 2.6 1.4 0.7 Non-seniors 37.8 16.0 13.3 10.7 8.2 5.8 3.9 2.5 1.3 0.5 Seniors 20.2 22.7 18.0 13.6 9.8 6.8 4.4 2.6 1.3 0.6
Note: In Best-case scenario, non-registered households are assigned a hypothetical household-level income decile that is identical to their area-based measure.
Table 3: Spearman's correlation, Kappa and weighted Kappa coefficients for the association between the area-based income measures and the household income measure
Area-based measure Group rs Kappa Weighted Kappa
Actual household-level income All 0.322 0.055 0.322 Non-seniors 0.316 0.054 0.315 Seniors 0.382 0.060 0.382
Best-case Scenario (including non-registrants) All 0.469 0.260 0.469 Non-seniors 0.497 0.309 0.496 Seniors 0.420 0.113 0.420
Note: rs = Spearman's correlation coefficient.
[image:4.612.56.552.595.699.2]area-level income when applied as the primary variable of interest. Thus, results cannot be extended to the use of income as a control in much larger regression equations. Second, these results are not meant to suggest that the use of neighbourhood income is inferior in all contexts. An author particularly concerned with measuring permanent income free of yearly fluctuations may find that neigh-bourhood income provides a better measure. When meas-uring access to health care, it might also be true that low-income families living in high-low-income neighbourhoods
have better access to care than other similar low-income families simply because of where they live. Thus, an argu-ment could be made for including both measures in this type of work.
[image:5.612.57.554.98.576.2]While the level of agreement between area-based and household-level SES measures has frequently been stud-ied, our work adds to the knowledge base for several rea-sons. It encompasses a larger number of Canadians, a sample of 78% of all households in British Columbia, of Table 4: Total drug costs by income decile
Entire BC population Non-senior population Senior population
Mean total drug costs
Percent of total drug costs
Mean total drug costs
Percent of total drug costs
Mean total drug costs
Percent of total drug costs
Deciles measured by CRA validated income
1 ($900–3,750) 743.27 10.39 826.46 15.24 894.61 6.99 2 ($3750–12,000) 615.16 8.60 456.26 8.41 942.67 7.37 3 ($12,000–
16,000)
605.19 8.46 332.54 6.13 1059.92 8.28
4 ($16,000– 20,000)
681.31 9.53 334.55 6.17 1178.95 9.21
5 ($20,000– 29,375)
534.48 7.47 358.74 6.61 1280.50 10.01
6 ($29,375– 39,584)
653.91 9.14 411.01 7.58 1352.22 10.57
7 ($29,584– 51,250)
705.15 9.86 503.90 9.29 1420.86 11.11
8 ($51,250– 67,917)
821.07 11.48 654.20 12.06 1499.01 11.72
9 ($67,917– 91,667)
881.27 12.32 741.34 13.67 1565.45 12.24
10 ($91,667– 475,000)
912.01 12.75 804.41 14.83 1599.72 12.50
100 100 100
Deciles measured by neighbourhood income
1 ($4,200–20,100) 726.63 10.16 615.32 11.35 1109.80 8.67 2 ($20,100–
23,800)
653.33 9.13 499.71 9.21 1189.72 9.30
3 ($23,800– 26,500)
697.09 9.75 511.38 9.43 1245.68 9.74
4 ($26,500–29,00) 700.24 9.79 510.90 9.42 1273.95 9.96 5 ($29,00–31,300) 707.28 9.89 523.97 9.66 1271.18 9.94 6 $31,300–33,900) 711.68 9.95 531.67 9.80 1309.01 10.23 7 ($33,900–
36,900)
720.97 10.08 540.98 9.97 1323.70 10.35
8 ($36,900– 41,300)
722.07 10.09 545.90 10.07 1343.11 10.50
9 ($41,300– 48,900)
728.69 10.19 554.05 10.22 1349.44 10.55
10 ($48,900– 310,900)
784.83 10.97 589.86 10.87 1378.30 10.77
100 100 100
which 95% of all senior households are analyzed. Also, while other studies have tended to compare area-based measures to household-level survey data[6,8,9] or have compared two or more different sized area-based meas-ures[10,11] we have used highly reliable household-level income data validated with the Canada Revenue Agency. Therefore, we have been able to avoid all self-reporting bias, we have a great deal of confidence in our household-level income variable, and we have been able to analyze almost an entire population of a Canadian province.
Conclusion
While many authors have argued that household-level income should be used whenever possible, census-based aggregate measures will continue to be necessary for health research until household-level data become more readily available. Two suggestions can be made based on these research results. The first is that researchers should be cautious when interpreting the results of studies using aggregate measures as proxies for individual and house-hold income. Area-based measures are approximations that are best suited to investigating major differences in incomes (e.g., differences of two or more quintiles) or to studying context in which someone lives rather than their specific income. The second suggestion is perhaps obvi-ous to researchers but important for governments and sta-tistical agencies to fully understand: access to reliable individual-level income/socio-economic data, as well as the neighbourhood level income data that is currently available, would unambiguously improve health research and therefore the evidence on which health and social policy would ideally rest.
Competing interests
The author(s) declare that they have no competing inter-ests.
Authors' contributions
GH participated in conception of the study and study design, performed the statistical analysis and drafted the manuscript. SM participated in conception of the study and study design and participated in drafting the script. Both authors read and approved the final manu-script.
Acknowledgements
This research was supported by a CIHR operating grant. Steve Morgan is supported by a New Investigator award from the Canadian Institutes of Health Research (CIHR) and Scholar Award from the MSFHR.
References
1. Adler NE, Boyce WT, Chesney MA, Folkman S, Syme SL: Socioeco-nomic inequalities in health. No easy solution. JAMA 1993,
269:3140-3145.
2. Braveman PA, Cubbin C, Egerter S, Chideya S, Marchi KS, Metzler M, Posner S: Socioeconomic Status in Health Research One Size Does Not Fit All. JAMA 2005, 294:2879-2888.
3. Marmot MG, Rose G, Shipley M, Hamilton PJ: Employment grade and coronary heart disease in British civil servants. Br Med J
1978, 32(4):244-9.
4. van Doorslaer E, Masseria C, Koolman X: Inequalities in access to medical care by income in developed countries. Can Med Assoc J 2006, 174:177-183.
5. Culyer AJ: Health, Health Expenditures and Equity. University of York, Centre for Health Economics; 1991.
6. Geronimus AT, Bound J, Neidert LJ: On the Validity of Using Census Geocode Characteristics to Proxy Individual Socioe-conomic Characteristics. J Am Stat Assoc 1996, 91:529-537. 7. Last JM: A Dictionary of Epidemiology. Oxford: Oxford
Univer-sity Press; 1995.
8. Demissie K, Hanley JA, Menzies D, Joseph L, Ernst P: Agreement in measuring socio-economic status: area-based versus individ-ual measures. Chronic Dis Can 2000, 21(1):1-7.
9. Diez-Roux AV, Kiefe CI, Jacobs DR Jr, Haan M, Jackson SA, Nieto FJ, Paton CC, Schulz R: Area characteristics and individual-level socioeconomic position indicators in three population-based epidemiologic studies. Ann Epidemiol 2001, 11:395-405. 10. Geronimus AT, Bound J: Use of census-based aggregate
varia-bles to proxy for socioeconomic group: evidence from national samples. Am J Epidemiol 1998, 148:475-486.
11. Southern DA, Ghali WA, Faris PD, Norris CM, Galbraith PD, Graham MM, Knudtson ML: Misclassification of income quintiles derived from area-based measures: A comparison of enu-meration area and forward sortation area. Can J Public Health
[image:6.612.56.555.100.264.2]2002, 93:465-469.
Table 5: Results for the regression of dummy variables indicating income decile against total drug costs
Explanatory Variables Household income Neighborhood Income Household income (without covariates)
Neighborhood Income (without covariates)
Income decile 1 -169.00 (-30.27) -59.162 (-10.57) -68.22 (-9.87) -14.57 (-2.65) Income decile 2 -297.08 (-53.20) -128.26 (-22.92) -405.50 (-58.67) -96.59 (-17.61) Income decile 3 -305.05 (-54.63) -91.67 (-16.38) -289.43 (-41.87) -80.34 (-14.65) Income decile 4 -232.39 (-41.62) -85.20 (-15.22) -179.73 (-26.00) -72.91 (-13.29) Income decile 5 -378.51 (-67.78) -77.08 (-13.77) -41.74 (-6.04) -67.03 (-12.22) Income decile 6 -257.56 (-46.13) -74.33 (-13.28) -40.48 (-5.85) -54.49 (-9.94) Income decile 7 -207.80 (-37.21) -64.83 (-11.58) -34.68 (-5.02) -44.99 (-8.21) Income decile 8 -89.99 (-16.12) -62.60 (-11.18) -53.00 (7.67) -39.09 (-7.13) Income decile 9 -32.60 (-5.84) -57.38 (-10.25) -14.63 (-2.12) -34.05 (-6.21) Presence of seniors 787.81 (250.77) 790.37 (267.87) Not included Not included Household size 105.43 (89.26) 104.65 (92.14) Not included Not included
Adjusted R2 0.101 0.06 0.01 0.01
Publish with BioMed Central and every scientist can read your work free of charge "BioMed Central will be the most significant development for disseminating the results of biomedical researc h in our lifetime."
Sir Paul Nurse, Cancer Research UK
Your research papers will be:
available free of charge to the entire biomedical community
peer reviewed and published immediately upon acceptance
cited in PubMed and archived on PubMed Central
yours — you keep the copyright
Submit your manuscript here:
http://www.biomedcentral.com/info/publishing_adv.asp
BioMedcentral
Pre-publication history
The pre-publication history for this paper can be accessed here: