R E S E A R C H A R T I C L E
Open Access
Prediction of the service life of surgical
instruments from the surgical instrument
management system log using radio
frequency identification
Takeki Yoshikawa
1*, Eizen Kimura
2, Emi Akama
3, Hiromi Nakao
3, Toshihiro Yorozuya
4and Ken Ishihara
5Abstract
Background:Bar code- or radio frequency identification (RFID)-based medical instrument management systems
have gradually been introduced in the field of surgical medicine for the individual management and identification of instruments. We hypothesized that individual management of instruments using RFID tags can provide
previously unavailable information, particularly the precise service life of an instrument. Such information can be used to prevent medical accidents caused by surgical instrument failure. This study aimed to predict the precise service life of instruments by analyzing the data available in instrument management systems.
Methods:We evaluated the repair history of instruments and the usage count until failure and then analyzed the data by the following three methods: the distribution of the instrument usage count was determined, an
instrument failure probability model was generated through logistic regression analysis, and survival analysis was performed to predict instrument failure.
Results:The usage count followed a normal distribution. Analysis showed that instruments were not used uniformly during surgery. In addition, the Kaplan–Meier curves plotted for five types of instruments showed significant differences in the cumulative survival rate of different instruments.
Conclusions:The usage history of instruments obtained with RFID tags or bar codes can be used to predict the probability of instrument failure. This prediction is significant for determining the service life of an instrument. Implementation of the developed model in instrument management systems can help prevent accidents due to instrument failure. Knowledge of the instrument service life will also help in developing a purchase plan for instruments to minimize wastage.
Keywords:RFID, Tracking data, Probability model, Service life of surgical instruments, Prevention of medical accidents
Background
Major medical accidents are caused by human error [1], which can be mitigated with double-checking by more than one person or the use of computerized order entry. For ex-ample, medication errors caused by the incorrect combin-ation of drugs and patients are mostly due to human error [2–4]. Bar codes [5, 6] or radiofrequency identification
(RFID) tags [7, 8] have been used to identify patients and drugs in order to avoid medication errors. Studies have also investigated the prevention of medical accidents through using verification systems for drug identification, blood transfusion products, and medical instruments as individual healthcare materials [9–11].
Analysis of log data such as the location and use his-tory of individual medical resources, e.g., drugs, which enable follow-up, is considered valuable for the retro-spective determination of the cause of medical accidents [12]. However, conducting follow-up surveys for
© The Author(s). 2019Open AccessThis article is distributed under the terms of the Creative Commons Attribution 4.0 International License (http://creativecommons.org/licenses/by/4.0/), which permits unrestricted use, distribution, and reproduction in any medium, provided you give appropriate credit to the original author(s) and the source, provide a link to the Creative Commons license, and indicate if changes were made. The Creative Commons Public Domain Dedication waiver (http://creativecommons.org/publicdomain/zero/1.0/) applies to the data made available in this article, unless otherwise stated. * Correspondence:takeki@m.ehime-u.ac.jp
1Surgical division, Ehime University Hospital, Shitsukawa, Toon city, Ehime
791-0295, Japan
instruments using the log data has been difficult because of the limitation of individual management of surgical instruments.
As RFID tag information can be read wirelessly, med-ical staff handling surgmed-ical instruments can easily read information obtained from RFID tags attached to surgi-cal instruments for individual management [13]. How-ever, washing and sterilization of the instruments at high temperatures can damage or contaminate the integrated circuit (IC) chip in the RFID tag and thereby limit the readability of RFID tag information. Therefore, RFID tags have not been adopted extensively in the manage-ment of steel surgical instrumanage-ments. Ceramic-coated RFID tags attached to or embedded in surgical instruments can resolve this problem [14, 15]. Although the RFID-based medical instrument management system has grad-ually been introduced in the field of surgical medicine [16], the system has yet to gain popularity. In 2011, we developed an RFID-based medical instrument manage-ment system using ceramic-coated RFIDs [17].
The instrument management system facilitates individ-ual management and identification of instruments by bar codes or RFID tags as well as collection of informa-tion about instrument use history and locainforma-tion (i.e., tracking data). We hypothesized that the individual management of instruments using RFID tags or bar codes can provide new insights into surgical instrument usage. For example, we anticipate that the precise service life of instruments can be determined with these data, which can be then implemented to prevent medical acci-dents caused by surgical instrument failure. Prior to this study, the precise service life of instruments could not be determined because of the lack of clear data on the frequency of usage and fault occurrence. Therefore, this study aimed to predict the precise service life of instru-ments based on evidence obtained by analyzing the data accumulated in the instrument management system we developed. Today, the use of RFID tags and bar codes can enable the identification of individual surgical in-struments. Therefore, the aim of this study was to evalu-ate the potential of using RFID tags to gain useful information based on the identification of individual sur-gical instruments. To the best of our knowledge, a simi-lar analysis that is concerned with surgical instruments actually used in clinical practice, has not been published yet.
Methods Target data
We developed a surgical instrument traceability system using RFID tags [17] and deployed the system at the Jap-anese Red Cross Wakayama Medical Center in July 2013. We retrieved the instrument-related data accumu-lated in the system from September 1, 2013 to April 30,
2017. The data from all surgeries that were performed in 15 surgical departments in the center (general surgery, ophthalmology, otolaryngology, orthopedic surgery, gynecology, cardiovascular surgery, pediatric cardiac gery, urology, neurosurgery, thoracic surgery, plastic sur-gery, pediatric surgery, breast surgery, emergency department, and dental and oral surgery) were included. There have been 34,390 surgical operations during data collection. No medical accidents related to surgical in-struments occurred at the medical center during this period. System errors occurred on an average of 1.6 cases per month. We removed the patients’personal in-formation from the acquired data through unlinkable anonymization. We have not used any patient data in this study. This study has been approved by the Ethics Committee of Ehime University Hospital.
RFID-based surgical instrument traceability system
System structure
The traceability system that we developed comprises three elements. The first is a ceramic-coated RFID tag [18], which is attached to the instrument by welding (in-dicated by the arrow in Fig. 1). Every RFID tag has a unique ID that is adopted as the instrument’s ID. The second element is an RFID reader that wirelessly reads the ID in the RFID tag. The reader can read the infor-mation using 13.56 MHz radio frequency wave and within the upper 20 cm of the instrument. The third element is a surgical instrument management program installed on a personal computer connected to the RFID reader. We assign IDs to each computer and collect in-formation on the location. Using the computer program, the staff members routinely record the history of ment preparation before surgery, the number of instru-ments used during surgery, and the number and type of instruments used after surgery. When an instrument ID is read from the RFID tag, the program simultaneously records the time, the name of the staff member logged into the computer, and the location where the RFID tag is read. This information is stored for use in the infor-mation model developed to collect the inforinfor-mation needed for a retrospective study, as described in the next section [19].
Entity-relationship diagram of the database for the traceability system
We designed the database for this system based on an information model. Here, we present part of the entity-relationship diagram (ERD) of this system, shown in
Fig. 2. An ERD is used to describe the structure of a
used. We also collected information about the instru-ment ID, set ID, and type of operation performed. Be-cause surgeons do not always use all prepared instruments in the operative field during surgery, we tracked the use of each instrument during surgery. For example, in one case, only 5 of 10 pairs of sterilized for-ceps were actually used during surgery. The “repair re-quest record” includes data on failed instruments, persons requesting repairs, repair request dates, repair request details, and repair completion dates.
Assembly
Assembly is a preoperative task during which the staff pre-pares the instruments that will be used in surgery. The staff members assemble washed instruments according to a preliminary list showing the numbers and types of in-struments needed for surgery. The collected inin-struments are then placed in a container for sterilization.
In our system, assembly is performed using an elec-tronic list displayed on the system. Referring to the list, the staff member passes the instruments over the RFID reader, confirms the result, then matches the RFID tag with the list, and places the instrument into the container.
An RFID tag is attached to the container, and the ID of the RFID tag is regarded as the container ID. The “set” comprises the container and the instruments placed in the container. A set ID is allocated to each set and linked with the container ID and the IDs of the
instruments in the set. The set ID is accompanied by assembly-related information (i.e., assembly time, loca-tion, and staff). This assembly-related information is re-corded in the database.
Data analysis
We analyzed the repair history of instruments. We used the parameter “usage count,” which is the number of times an instrument is used until fault occurrence. We performed three types of analysis. We assessed the dis-tribution of the usage count for the instruments (analysis I), created an instrument failure probability model (ana-lysis II), and performed survival ana(ana-lysis to assess instru-ment failure (analysis III).
Statistical analyses were performed using SPSS soft-ware (ver. 22). The significance level was set atp< 0.05.
Analysis I: distribution of the usage count of instruments (distribution analysis)
To visualize the distribution of the usage counts and usage rate for instruments of the same type, we used the history data for Cooper scissors, which contain repair re-cords. Usage rate is calculated as (usage count)/ (sterilization count); this is because some sterilized in-struments may not be used during a surgical procedure, as mentioned above.
We assumed that there was a bias in the usage count for instruments because the“Assembly process” showed no instrument replacements; that is, only specific
[image:3.595.59.540.85.354.2]instruments were used. Therefore, we tested the normal-ity of the two distributions using the Kolmogorov–Smir-nov test.
Analysis II: logistic regression analysis (instrument failure probability model)
We conducted a follow-up study with the data of instru-ment use, repair request, and instruinstru-ment discard history. With the aim of estimating the durability period for each instrument, we calculated the incidence of instrument fail-ure for each instrument type. For this analysis, we selected the Cooper scissors, which had the highest number of
repair requests, and created an instrument failure probabil-ity model.
Extraction of instrument repair history data
We collected information about the instrument repair history data, including data on failed instruments, repair request details (i.e., the reason for repair), and usage count (before the failed instrument was repaired).
Instrument failure probability model
We created a failure probability model from the history data of 136 Cooper scissors for which repairs had been
[image:4.595.62.538.86.557.2]requested. We considered the issuance of a repair re-quest as the occurrence of instrument failure. Because the occurrence of failure is a dependent variable expressed with a binary number, we performed logistic regression analysis with the parameter usage count as an independent variable [21]. We defined the regression
curve asy¼ 1
1þe−ðb0þ
P
bixiÞ [21], where x is the covariate, y
is the probability, b is the partial regression coefficient, and b0is a constant. Finally, we evaluated the model by calculating the coefficient of determination and the p-value for the Hosmer–Lemeshow test.
Analysis III: Kaplan–Meier survival analysis for instrument failure
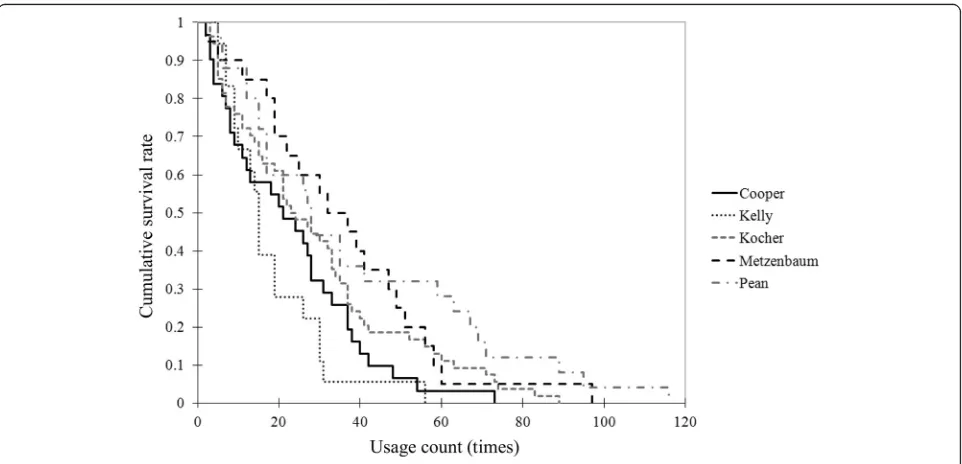
We performed Kaplan–Meier survival analysis on data for two types of surgical scissors (Cooper;N= 35, Metzenbaum; N= 28) and three types of forceps (Kelly; N= 20, Kocher; N= 58, Pean;N= 28) using the log-rank test. We plotted a Kaplan–Meier curve using the repair history data and then calculated the cumulative survival rates of every instrument from the usage count when the instruments failed.
Results
Analysis I: distribution of the usage count of instruments (distribution analysis)
Figure3 shows the histogram of the usage count for the 136 Coopers. Thex-axis shows the usage count with bins representing 10 uses, while the y-axis shows the number of instruments at each value ofx. The Kolmogorov–Smir-nov test indicates that the usage count follows a normal
distribution (p= 0.2). Therefore, surgical instruments were not used uniformly throughout the study period. Figure4 shows the histogram of the usage rate for the 136 Coo-pers. The x-axis shows the usage count with bins repre-senting 2%, while the y-axis shows the number of instruments at each value ofx. The Kolmogorov–Smirnov test indicates that the usage count follows a normal distri-bution (p= 0.098). Therefore, the ratio of the usage and sterilization counts is not uniform, indicating that not all sterilized instruments were used during surgery.
Analysis II: logistic regression analysis (instrument failure probability model)
Table1shows the results of logistic regression analysis of the failure probability for the 136 Coopers. The instru-ments were used multiple times per surgery. An increase in the usage count caused a 1.026-fold increase in the risk of instrument failure occurrence. The coefficient of deter-mination is 0.032 and thep-value for the Hosmer–Leme-show test is 0.117. Figure 5 shows the regression curve and its 95% confidence interval. The probability of failure (y-axis) is plotted against the usage count (x-axis). When the usage count exceeded 169, the probability of failure exceeded 0.5. Furthermore, when the usage count exceeded 224, the probability of failure exceeded 0.8.
Analysis III: Kaplan–Meier survival analysis of instrument failure
Figure 6 shows the Kaplan–Meier curves for five types of instruments. The cumulative survival rate (y-axis) is plotted against the usage count (x-axis). Table 2 shows
[image:5.595.58.540.475.703.2]the results of the log-rank test and the p-value pair for each instrument. There were significant differences be-tween (1) Kelly and Kocher, Metzenbaum, and Pean, (2) Cooper and Metzenbaum, and (3) Cooper and Pean.
Discussion
Non-uniformity in the distribution of the usage count for the instruments
We confirmed that there was non-uniformity in the usage count among individual Cooper scissors. After the first surgical operation, the same instruments tend to be used repeatedly, and the combination of instru-ments is unlikely to be rearranged. If all Coopers are used the same number of times, we can estimate the service life of the instrument by simply dividing the total period between the start of use and disposal with the total usage counts for all instruments. In reality, however, the usage counts for individual struments are not uniform; therefore, individual in-struments should be tracked for accurate prediction of the instrument’s service life.
This kind of non-uniformity can lead to economic loss (as some instruments are left unused). In addition,
incorrect prediction of an instrument’s service life may fail to prevent an accident due to a broken piece of the failed instrument during surgery. Previously, the identifi-cation and follow-up of individual surgical instruments and the replacement of instruments based on the history of use were not possible. We can identify individual in-struments and obtain the usage count of each individual instrument using bar codes or RFID tags. Furthermore, by implementing an instrument failure probability model in this system in the future, we can be develop an effect-ive warning system that can indicate either replacement or disposal of instruments before the occurrence of fail-ure, and thereby prevent accidents due to broken instru-ments during surgery.
Instrument failure probability model
We created the model that estimates the probability of instrument failure based on the usage count (results of analysis II). The model can be rendered more accurate with the inclusion of other factors. For example, al-though the manufacturers of surgical instruments per-form endurance tests on the instruments, obtaining data about which instruments are used in practice is benefi-cial because of the inclusion of information such as the differences in the manner the instruments are used by surgeons, across departments, and across facilities. In this study, we used only the usage count for our analysis. However, data collected over a longer period with more categories can enhance the accuracy of the model. We believe this model will facilitate precise prediction of the service life of instruments.
[image:6.595.58.539.86.316.2]Fig. 4Distribution of the usage rate. The histogram of the usage rate for the 136 Coopers is plotted, with the x-axis showing the usage count with bins representing 2% and the y-axis showing the number of instruments at each value of x
Table 1Results of logistic regression analysis
B SE p Odds ratio
Usage count 0.025 0.004 < 0.001 1.026
Constant −4.213 0.163 < 0.001 0.015
[image:6.595.57.290.672.715.2]Frequency of differences in instrument failure among different types of instruments
Surgeons use Cooper scissors more frequently than Metzenbaum scissors to cut harder tissues. Moreover, sur-geons use Cooper scissors, but not Metzenbaum scissors, to cut sutures and surgical drapes. Consequently, there was a significant usage count difference between Cooper and Metzenbaum scissors (p= 0.036). In contrast, the usage
count difference between Kocher and Pean forceps (p= 0.106) was not significant. However, there were significant differences between Kelly and Kocher forceps (p= 0.017) and between Kelly and Pean forceps (p= 0.004). Surgeons use Kelly forceps for tissue ablation. Since Kelly forceps are dainty and elaborate, they tend to fail more frequently. We will obtain more information from surveying further types of instruments in the future.
Fig. 5Regression curve for failure probability of Cooper scissors. The regression curve and its 95% confidence interval are plotted for the probability of failure (y-axis) against the usage count (x-axis)
[image:7.595.58.538.84.322.2] [image:7.595.58.539.474.706.2]Future possibilities for individual management with RFID tags
We can obtain information about the use history of instru-ments, which was unavailable prior to the implementation of RFID tags and bar codes. Using this information, we can predict the probability of instrument failure, which is sig-nificant information for determining the service life of in-struments and developing an instrument purchase plan that can reduce wastage.
We were able to acquire new information concerned with the surgical instruments using the tracking technol-ogy (RFID, bar code). This approach of using the new information may lead to more effective management of instruments in terms of prevention of medical errors, re-duction of waste, and instrument purchase planning. As surgical operations need aseptic operations, we proposed that RFID tags are more suitable for surgical instruments than bar codes. However, identification of individual in-struments is important rather than comparison of identi-fication abilities between RFID tags and bar codes. In other words, once the instruments are identified, either RFID tags or bar codes can be acceptable as tracking tools. In the present study, we evaluated the potential of obtaining new information based on the tracking data, although we did compare the identification abilities be-tween RFID tags and bar codes. Instruments equipped with RFID tags are significantly more expensive (~ 5 US dollars per instrument) than instruments without tags; however, more accurate cost management would be fa-cilitated owing to the use of tags, and thus unnecessary costs concerned with instruments may be reduced. How-ever, we believe that it is difficult to present merits in terms of costs of using tags compared with costs of introducing the system. Costs of medical litigation vary with cases, thereby making it difficult to assess effective-ness in preventing medical accidents in terms of cost. In this regard, we believe that the use of tags for surgical instruments has more merit than the use of surgical in-struments without tags.
Conclusions
We hypothesized that individual management of instru-ments using RFID tags can provide useful information. To correct non-uniform usage of instruments, individual
devices should be tracked. Implementation of instru-ment manageinstru-ment systems with the instruinstru-ment failure probability model may help prevent accidents caused by instrument failure. The instrument failure probability model and survival analysis of instruments can help us determine the precise service life of instruments.
Abbreviations
APAMI:Asia Pacific Association for Medical Informatics; ERD: Entity-relationship diagram; IC: Integrated circuit; RFID: Radio Frequency Identification
Acknowledgements
Special thanks to Dr. Masahiro Hiraoka and all staff at the Japanese Red Cross Wakayama Medical Center. The authors are indebted to KRD Corporation and Pal Software Service for their cooperation with this study. The authors would like to thank Enago (www.enago.jp) for the English language review.
Authors’contributions
All authors have read and approved this manuscript. TY1 analyzed the data and wrote this manuscript. EK and KI supported the decision regarding the concept and design of this study. EA and HN contributed to the conception and acquired the data. TY2 supported the revision of this manuscript.
Funding
None.
Availability of data and materials
The data that support the findings of this study are available from Ehime University but restrictions apply to the availability of these data, which were used under license for the current study, and so are not publicly available. Data are however available from corresponding author upon reasonable request and with permission of Ehime University.
Ethics approval and consent to participate
This study has been approved by the Ethics Committee of Ehime University Hospital.
Consent for publication
Not applicable
Competing interests
The authors declare that they have no competing interests.
Author details
1Surgical division, Ehime University Hospital, Shitsukawa, Toon city, Ehime
791-0295, Japan.2Department of Medical Informatics, Ehime University Graduate School of Medicine, Shitsukawa, Toon city, Ehime 791-0295, Japan. 3Japanese Red Cross Wakayama Medical Center, 4-20 Komatsubara-dori,
Wakayama City, Wakayama 640-8558, Japan.4Department of Anesthesia and Perioperative Medicine, Ehime University Graduate School of Medicine, Shitsukawa, Toon city, Ehime 791-0295, Japan.5Department of Medical Informatics, Ehime University Graduate School of Medicine, Shitsukawa, Toon city, Ehime 791-0295, Japan.
Received: 22 November 2017 Accepted: 20 September 2019
References
1. Kohn LT, Corrigan JM, Donaldson MS. To err is human: building a safer health system. Washington DC: National Academy of Science Institute of Medicine; 2000. 2. Aspden P, Wolcott J, Bootman JL, Cronenwett LR. Preventing medication
errors. Washington: National Academies Press; 2007.
3. Bates DW. Using information technology to reduce rates of medication errors in hospitals. BMJ. 2000;320(7237):788.
4. Lisby M, Nielsen LP, Mainz J. Errors in the medication process: frequency, type, and potential clinical consequences. Int J Qual Health Care. 2005;17(1):15–22. 5. Johnson CL, Carlson RA, Tucker C, Willette C. Using BCMA software to
[image:8.595.56.289.99.182.2]improve patient safety in veterans administration medical centers. JHIM. 2001;16(1):46–51.
Table 2Log-rank test (p-value)
Cooper Kelly Kocher Metzenbaum Pean
Cooper 0.316 0.159 0.036 0.024
Kelly 0.316 0.017 0.003 0.004
Kocher 0.159 0.017 0.328 0.106
Metzenbaum 0.036 0.003 0.328 0.559
Pean 0.024 0.004 0.106 0.559
6. Shojania KG, Duncan BW, McDonald KM, Wachter RM, Markowitz AJ. Making health care safer: a critical analysis of patient safety practices. Evid Rep Technol Assess (Summ). 2001;43(1):668.
7. Sun PR, Wang BH, Wu F. A new method to guard inpatient medication safety by the implementation of RFID. J Med Syst. 2008;32(4):327–32. 8. Pérez MM, Cabrero-Canosa M, Hermida JV, García LC, Gómez DL, González
GV, et al. Application of RFID technology in patient tracking and medication traceability in emergency care. J Med Syst. 2012;36(6):3983–93.
9. Fosso Wamba S, Barjis J, Takeoka CA, Bendavid Y, Boeck H, Philippe R. Redesigning the replenishment process of medical supplies in hospitals with RFID. BPMJ. 2010;16(6):991–1013.
10. Hohberger C, Davis R, Briggs L, Gutierrez A, Veeramani D. Applying radio-frequency identification (RFID) technology in transfusion medicine. Biologicals. 2012;40(3):209–13.
11. Turner C, Casbard A, Murphy M. Barcode technology: its role in increasing the safety of blood transfusion. Transfusion. 2003;43(9):1200–9. 12. Bendavid Y, Boeck H, Philippe R. RFID-enabled traceability system for
consignment and high value products: a case study in the healthcare sector. J Med Syst. 2012;36(6):3473–89.
13. Weinstein R. RFID: a technical overview and its application to the enterprise. IT Prof. 2005;7(3):27–33.
14. Yamashita K, Iwakami Y, Imaizumi K, Yasuhara H, Mimura Y, Uetera Y, et al. Identification of information surgical instrument by ceramic RFID tag. In: World Automation Congress 2008; 2008. p. 1–6.
15. Sampaio AM. Product design and development of products with embedded microelectronics–surgical instruments traceability. In: Semana da Escola de Engenharia, A362; 2011.http://www3.dsi.uminho.pt/seeum2011/ cd/Resumos/A562.pdf, (cited 2017-07-29).
16. Yamashita K, Kusuda K, Iwakami Y, Tanaka K, Tokuda Y, Tanaka S, et al. Development of system for managing individual surgical instruments by RFID. 5th EMBEC; 2012. p. 725–8.
17. Yoshikawa T, Kimura E, Kobayashi S, Akamatsu K, Yorozuya T, Ishihara K. Evaluating assembly time with RFID-based surgical instrument management system. In: Proceedings of The 7th Asia Pacific Association for Medical Informatics (APAMI), China, CD-ROM (submission 29); 2012. 18. HIROHIDE K (2011-01-11) IC TAG. US7868767 B2.
19. Yoshikawa T. Constructing the informative model to ensure the traceability of surgical instruments. JJMI. 2014;84(3):369–79.
20. Teorey TJ, Yang D, Fry JP. A logical design methodology for relational databases using the extended entity-relationship model. CSUR. 1986;18(2):197–222. 21. Hosmer DW Jr, Lemeshow S. Applied logistic regression. New York: Wiley; 2004.
Publisher’s Note