Effect of a Drawing Task on Cortical
Excitability
Mona Lucia Thorpe
A report submitted as a partial requirement
for the degree of Bachelor of Science with
Honours
I declare that this report is my own original work and that contributions of others have been duly acknowledged.
Signature: ... Date: ...
Acknowledgements
Many thanks to Dr Mike Garry, for generosity with his time, patience, and teaching, in matters technical, statistical and neurophysiological. Additional thanks to Paola Reissig for timely and generous assistance with ‘troubleshooting’ in the lab. For in-house ‘tech support’, around the clock for decades, thank you James. And for the background music of Debussy, Mozart and Haydn, with demonstration of
Abstract 1
Introduction 2
TMS mechanisms and EMG measures 4
Motor learning 6
Task complexity and novelty 6
M1/corticospinal activity associated with well-practised tasks 9
Temporal relationship of motor activity with TMS application 9
The current study: aim, experimental task, hypothesis 10
Method 13
Participants 13
Materials
Electromyographic recording 14
Transcranial magnetic stimulation 15
Procedure 16
Experimental task 17
Design and Analysis 17
Results
Background EMG activity 19
Corticospinal excitability 21
Intracortical inhibition 23
Discussion 27
Task-dependent changes in M1/corticospinal excitation-inhibition 28
Influence of muscle preactivity 29
M1/corticospinal excitability changes associated with 30 handwriting/drawing
Cortical representational shift in early and late stage learning 34 M1/corticospinal excitability changes associated with activities of 34 daily living
Variability of TMS measures and contributory factors 35
References 43
Table/Figure Title Page.
Figure 1. Timeline of the experimental protocol 17
Figure 2. Background EMGRMS activity for FDI and APB muscles 20
Figure 3. EMGMEP recruitment curves for levels of time for FDI 22
and APB
Figure 4. FDI recruitment curves for intracortical inhibition 24
Table 1. MEP mean amplitudes for time x TMS type interaction 26
for APB
Figure 5. MEP amplitudes across time and TMS type, for FDI 27
Effect of a Drawing Task on Cortical Excitability
Abstract
The present study examined the effects of a well-practiced motor skill on measures
of primary motor cortex (M1) and corticospinal activity in a small sample of eight
individuals. A drawing/geometric symbol copying task served as the model for a
complex overlearned motor task, commonly performed in the course of daily life.
Measures of post-task M1 activity were obtained using transcranial magnetic
stimulation (TMS)-evoked electromyographic measures from two intrinsic hand
muscles. These were evaluated with respect to the magnitude, time-course and
variability of changes that reflect modulation of M1/corticospinal
excitation-inhibition. Results of the study indicated that the drawing task had minimal influence
on measures of M1/corticospinal excitability or variability, up to 15 minutes
post-task. The practical implication of this study finding is that routine activities of daily
living involving hand muscle use, including those that are complex in nature, appear
to have minimal influence on TMS measures of M1/corticospinal excitability.
Therefore, the usual daily activities that individuals engage in prior to participation in
TMS studies do not appear to significantly bias TMS-evoked baseline measures of
Activities of daily living are invariably complex in nature, but, by virtue of being
well-practised and having reached the level of procedural automaticity, are executed
with fluency and without explicit cognitive effort. Extensive use of the hands is a
defining feature of the majority of these activities, which include tasks such as
writing, drawing, keyboard and mouse use, and the manipulation of a variety of tools
and utensils. Functional task-specific use of the hands requires, for well-practised as
well as unfamiliar tasks, complex, synchronised and integrated sensorimotor activity
across a distributed network of brain regions, including the primary and secondary
sensorimotor cortices, premotor cortex, dorsolateral prefrontal cortex, posterior
parietal cortex, cerebellum, thalamic nuclei and basal ganglia (Reis et al, 2008).
Whilst there is little known about the influence of motor activities performed in the
course of daily life on primary motor cortex (M1) excitability, there is consensus that
M1 provides the majority of cortical output to descending motor commands for
planning, integration, control and execution of motor tasks, with additional roles in
cognition and the early (skill acquisition) and late (consolidation) phases of motor
learning (Muellbacher et al., 2002; Reis et al., 2008). M1 is thus extensively engaged
in the execution of all motor activities, both well-learned and novel, but differs in
quantitative and qualitative ways in this engagement (Kouchtir-Devanne, Capaday,
Cassim, Derambure & Devanne, 2012; Lehericy et al., 2005; Pascual-Leone et al.,
1994, 1995; Stinear & Byblow, 2003; Stinear, Coxon & Byblow, 2009; Ungerleider,
Doyon & Karni, 2002). Consequently, M1, by virtue of its anatomical accessibility
and central role in cortical output for motor activities, has been the focus of extensive
investigation using several non-invasive imaging modalities, including transcranial
An implicit assumption in many TMS studies is that, when called upon for motor
task performance, rapid and extensive M1 engagement occurs, followed by equally
rapid disengagement on task completion. The corresponding changes in indices of
M1 excitation-inhibition accompanying task execution, likewise, are assumed to
return to baseline and a state of readiness for subsequent activation. In human studies
there is remarkably little empirical evidence directly addressing this assumption, yet
the assumption informs, at a practical level, the conduct of TMS experiments such as
occur in the Motor Control Laboratory in this university (and many others).
Typically the majority of participants in such studies are undergraduate students who
have been engaged in extensive writing/typing or other activities using their hands in
the hours prior to participation in an experimental study, followed by further
handwriting for informed consent, medical questionnaires and such like prior to
study commencement. Consequently, activation of at least two principal intrinsic
hand muscles, abductor pollicis brevis (APB) and the first dorsal interosseus (FDI),
both of which commonly feature as target muscles for subsequent TMS-evoked
electromyographic (EMG) measures of M1/corticospinal activity, has been present
essentially right up until the start of the experimental protocol. The assumption that
cessation of writing/hand use corresponds with rapid decay of M1 activity and
restoration of TMS-derived measures to baseline is clearly central to proceeding with
experimental protocols that subsequently evaluate the same (or adjacent) muscles.
Empirical verification of this assumption has important practical implications for the
conduct of TMS protocols in all applications, investigative through to therapeutic
TMS mechanisms and EMG measures
Cortical motor neuronal excitability changes, assessed in-vivo with animal studies
(Nudo, Milliken, Jenkins, & Merzenich, 1996; Sanes & Donoghue, 2000), can be
assessed non-invasively in humans using TMS, to a high degree of temporal
resolution and reasonable spatial resolution (Walsh & Pascual-Leone, 2003). TMS
uses a magnetic field generated from a rapidly changing electrical current in a metal
coil (Barker, Jalinous & Freeston, 1985). This magnetic field can pass through the
scalp, skull and meninges with minimal impedence, and induce an electrical current
in the underlying cortical tissue, activating motor neurons and resulting in electrical
activity descending along the neurons of the corticospinal pathway. If this electrical
activity is of sufficient intensity, a ‘twitch’ or contraction of the corresponding
(contralateral) peripheral muscle is evoked (Di Lazzaro et al., 2004). Surface EMG
over the target muscle(s) enables measurement of the muscle twitch (contraction) by
the motor evoked potential (MEP) recorded.
The MEP gives information about several aspects of M1 and the descending motor
pathway. MEP latency, the interval between TMS stimulus delivery and the twitch
response in peripheral muscle, reflects the total motor conduction time from cortex to
target muscle (Badawy, Loetscher, Macdonell & Brodtmann, 2012). Motor threshold
(MT) reflects the global excitability of the motor corticospinal pathway, and is
defined as the minimum TMS intensity required to elicit an identifiable MEP of
≥50µV amplitude in ~50% of trials. MT is used for setting subsequent TMS stimulus
intensities as a percentage of the resting (RMT) or active threshold (AMT) value.
The small muscles of the hand have the lowest MT, reflecting the greater cortical
MEP amplitude reflects the sum of M1 and corticospinal pathway excitation, and is a
key measure of net excitation in TMS studies (Hallett, 2007). Amplitude reflects the
influence of a number of intrinsic and extrinsic factors. Intrinsic factors include (i)
the density of cortico-motor neuronal projections onto spinal motor neurons,
reflected by different muscles differing in the density of these projections, and
correspondingly in MEP amplitude for a given TMS intensity (Rossini, Rossini &
Ferreri, 2010), and (ii) the physiological state of M1, which is characterised by
dynamic fluctuations within a physiological range, enabling maintenance of
homeostasis as well as a preparedness for rapid response when called upon for
diverse tasks (see Muller-Dalhaus & Ziemann, 2014, and Rossini et al., 2010 for
reviews).
Extrinsic factors impacting MEP amplitude include (i) the intensity of the magnetic
stimulation, and (ii) the different stimulation paradigms that manipulate the timing
and frequency of the TMS stimuli delivered through the scalp, enabling varying
degrees of excitation or inhibition to be evoked in the corticospinal and intracortical
pathways (Kujirai, 1993). Aside from TMS-related variables, a number of other
factors can impact M1 activity, to a lesser or greater extent for a given individual,
setting or experimental paradigm, and contribute to changes or variability in MEP
amplitudes and related measures (Orth, Snijders, & Rothwell, 2003; Ridding &
Ziemann, 2010; Wasserman, 2002). An additional measure, the cortical silent period
(CSP), defined as the period of EMG silence that occurs after the MEP when TMS is
delivered to M1 during muscle contraction, is a measure of intracortical inhibition1
(ICI). Overall, TMS stimuli can evoke either excitation or inhibition of brain activity,
with both likely occurring to a different extent and time course for each stimulus.
The ensuing magnitude and pattern of responses enables localisation and
measurement of brain activity in space and time (Hallett, 2007).
Motor learning
The principal focus in TMS studies in humans has been motor learning, using a range
of paradigms focussed on investigating skill acquisition and motor adaptation (see
Tanaka, Sandrini & Cohen, 2011 for a review). These studies have invariably used
simple novel tasks that afford a high degree of experimental control, but are often
lacking in ecological validity. Whilst novel task learning paradigms have shed
substantial light on the mechanisms of M1 and corticospinal activity related to
learning and memory (Classen, Liepert, Wise, Hallett & Cohen, 1998; Muellbacher
et al., 2002; Pascual-Leone, Grafman & Hallett, 1994), there is an emerging body of
evidence highlighting the substantial differences between the cortical processing and
activity associated with simple compared to complex tasks (Boisgontier, Wittenberg,
Fujiyama, Levin & Swinnen, 2014; Carey, Bhatt & Nagpal, 2005;Pascual-Leone et
al., 1995), and novel compared to well-practised motor tasks (Boisgontier et al.,
2014; Meister et al., 2005). In considering the influence of routine motor tasks on M1
excitability, these dimensions of complexity and novelty become important.
Task complexity and novelty
Simple tasks can be considered to be those comprised of simple motor responses, for
example, isolated muscle contraction, repetitions of thumb abduction, thumb-index
tasks can be considered to be those requiring extensive motor, somatosensory or
cognitive input and integration, for example, complex digit or limb sequencing tasks,
choice reaction time tasks, visual tracking and pointing tasks, or their naturalistic
equivalents - writing, drawing, or playing a musical instrument. While the difference
between prototypes of simple versus complex, and novel versus well-practiced tasks
is clear, for many motor activities and settings these distinctions are not clear-cut.
Routine activities of daily living, for instance, are well-practiced and therefore
executed with fluency and ease, but are fundamentally complex skilled procedures
requiring integration of multiple motor and cognitive subroutines (Carey, Bhatt &
Nagpal, 2005).
There is general consensus across experimental findings that complex tasks are more
effective at inducing motor cortical reorganisation (an early change indicative of
brain plasticity and learning) than simple tasks. Pascual-Leone and colleagues
(1995), reported increased (TMS-evoked) cortical excitability in M1 following the
learning and execution of a complex novel fine motor skill (a one-handed, five-finger
exercise on the piano, for 2 hour practice sessions/day for 5 days) compared to a less
complex task (unstructured piano practice for the same duration/day), and concluded
that the cognitively demanding aspect of the task (i.e. explicit finger sequencing) was
the dimension that evoked M1 excitability rather than the purely motor dimensions
of the task. Boisgontier and others (2014), using reaction time (RT) as an index of
the processing complexity underlying upper and lower limb movements, found that
the limb interactions mediating frequently executed “daily activities”, were complex2
but also highly optimised, especially for the upper limbs, and this was reflected in
lower processing times compared to novel (non-functional3) combinations of limb recruitment and selection. As with the Pascual-Leone et al. (1995) study, the
task-dependent sequencing of limb (or digit) interactions was found to be the variable that
indexed complexity, with evidence of this complexity manifest as increased M1
cortical representation (plasticity) and increased choice RT measures for these
studies respectively.
Simple tasks, nonetheless, do influence M1 excitability, particularly if they are novel
and undertaken in the context of learning, with robust evidence of changes including
increased MEP amplitudes and decreased ICI mediating task-specific muscle
selection and task execution (Stinear & Byblow, 2003; Garry, Kamen & Nordstrom,
2004). In simple tasks, however, these changes are transient and generally revert to
baseline within 20-30 minutes (Classen, Liepert, Wise, Hallett & Cohen, 1998; Garry
et al., 2004).
Background level of motor skill training (‘expertise’) is a salient factor, and interacts
with task demands, altering effects on M1 activity. Meister and colleagues (2005),
using functional magnetic resonance imaging (fMRI), found that complex movement
sequences on a keyboard showed greater fMRI activation of motor cortical areas than
simple sequences in novices when compared to trained musicians. These findings,
reflecting training-related adaptations (i.e., lower thresholds for induction of
task-dependent excitation and inhibition, across different task types), have been replicated
across a number of TMS studies (Nordstrom & Butler, 2002; Rosenkranz,
Williamon, & Rothwell, 2007). Therefore, task demand (noveltyand/or complexity)
and baseline level of experience interact in shaping extent and magnitude of motor
cortical activity.
M1/corticospinal activity associated with well-practised/overlearned tasks
The impact of routinely performed well-practiced motor activities on the baseline
functional state of M1 activity is relatively understudied in contrast to the extensive
investigations into learning and memory. What can be inferred from studies of
memory mechanisms is that practice-dependent increases in MEP amplitude (M1
excitation)become attenuated once a skill has been overlearned (Muellbacher et al.,
2001), with imaging findings showing dynamic changes in activation patterns across
cortical and subcortical regions with skill acquisition, reflected in a shift away from
M1 when levels of skill automaticity increase (Lehericy et al., 2005; Puttemans,
Wenderoth & Swinnen, 2005). These findings, however, have emerged from studies
utilising simple, novel tasks. Empirical data documenting the time-course of intra-
and post-task M1 excitability changes with performance of complex and/or
well-practiced naturalistic tasks are lacking.
Temporal relationship of motor activity with TMS application
Proximity of simple motor activities, such as brief duration hand muscle contraction,
to subsequent TMS application is an area of active research. This relationship has
been investigated in a number of recent studies, prompted in part by the observation
by some research groups of antecedent hand muscle activity eliciting greater
variability in measures of intracortical excitatory networks when compared to
experimental cohorts with no motor pre-activity (Goldsworthy, Muller-Dalhaus,
have reported reversal of responses to TMS plasticity-inducing protocols (facilitation
becoming inhibition, for instance) attributable to motor activity pre-stimulation
(Gentner et al., 2008; Iezzi et al., 2008). These findings, however, are not consistent
across the TMS literature. Sale, Ridding and Nordstrom (2007) found that the
voluntary hand muscle contraction performed for the CSP measure did not
significantly affect the extent of motor evoked potential (MEP) facilitation in an
intrinsic hand muscle. Doeltgen and Ridding (2010), in examining the influence of
routine activities over the course of the day on a range of TMS measures of M1
activity, found no evidence of change in motor thresholds (RMT or AMT), MEP
amplitudes, intracortical inhibition or facilitation. Their study participants reported,
in addition to usual activities of daily living during the day, at least 4 hours of
keyboard and mouse use, as well as hand muscle contraction at the commencement
of the TMS study to establish the AMT value. Thus robust engagement of M1, in a
largely naturalistic manner, was undoubtedly present in the time period between
measures. The precise temporal relationship of muscle activation to subsequent TMS
testing, however, was unclear, so this study left unresolved the question of whether
these types of motor activities, performed in close temporal proximity to TMS
application, result in effects on M1 that are of sufficient magnitude and duration to
alter or bias TMS-evoked baseline measures.
Study aim
Given these discrepant findings and unresolved issues, the current study sought to
investigate the time-course of M1-related effects elicited by a complex,
well-practiced naturalistic task performed routinely in the course of daily life. The
activation underpinning execution of a well-practised task is sustained beyond task
execution.
Experimental task
A symbol drawing/copying task was selected to test our study question. In the
experimental literature, drawing tasks serve principally as control/contrast conditions
in studies evaluating language or higher-order cognition, with drawing considered to
comprise of predominantly motor and non-linguistic elements (Horovitz, Gallea, Ali
Najee-ullah & Hallett, 2013; Papathanasiou, Filipovic, Whurr, Rothwell &
Jahanshahi, 2004). Whilst a cognitive processing ‘load’ is clearly required for
execution of drawing/geometric symbol copying, empirical findings suggest that this
load is of lesser magnitude (Horovitz et al., 2013), and more bilaterally distributed at
a cortical network level than the strongly dominant hemisphere localised processing
demands of a language-based handwriting task (Brown & Kosslyn, 1993;
Harrington, Farias, Davis & Buonocore, 2007; Sturz, Edwards & Boyer, 2014).
Additionally, a substantial component of automatic task execution is known to be
mediated at cerebellar and subcortical (basal ganglia) levels (Lehericy et al., 2005),
so in sum, the load imposed on M1 from the cognitive aspects of this task were
minimised as much as feasibly possible.
The drawing/symbol copying task fulfilled the following criteria: (i) complexity, by
virtue of the underlying dynamic interaction of the motor, cognitive and visual
systems required for drawing execution, with corresponding modulation of M1
excitability as the output mechanism (Filipovic, Papathanasiou, Whurr, Rothwell &
procedural automaticity, with literate individuals having ~15 or more years
experience in handwriting/drawing by adulthood (Horovitz, Gallea, Ali Najee-ullah
& Hallett, 2013), (iii) a task that is engaged in daily (or has analogues such as
typing/texting that are practised daily), (iv) a lack of novelty, achieved by the use of
familiar symbols for the copying dimension of the task – a tick, cross and circle
(üû○), ensuring that no new learning was required, and thus avoiding a
confound-related increase in M1 activity attributable to task novelty, (v) activation of the
intrinsic hand muscles that are the prime effectors in handwriting, FDI and APB, via
the ‘tripod’ grip required for pen holding, (vi) task duration of sufficient length
(several minutes) to replicate the extent of intrinsic hand muscle use that precedes a
typical TMS study, and (vii) minimal linguistic load, due to the known effects of
language (receptive or expressive) in enhancing M1 excitation (Bracco et al., 2009;
Papathanasiou, Filipovic, Whurr, Rothwell & Jahanshahi, 2004; Walsh &
Pascual-Leone, 2003).
Hypothesis
On the basis of findings from the available literature, it is hypothesised that a
well-practiced motor task (drawing/symbol copying), due to its inherent complexity, will
elicit robust M1 activation during task execution (i.e., increased MEP amplitudes and
decreased ICI), with evidence of this activation present immediately post-task (i.e.,
resolution to baseline not as rapid as for a simple motor task). But, given that the task
is well-practised and no new learning is occurring, these M1-related changes will not
be sustained beyond the immediate post-task period, and will have returned to
Methods
Participants
Eight healthy right-handed participants (4 females/4 males, mean age = 31.1 years,
range = 23-48 years) underwent testing for theexperimental drawing task in the
Motor Control Laboratory at the University of Tasmania (UTAS). All participants
were volunteers, with the majority recruited from the undergraduate student
population on campus. A standard medical screening questionnaire was used to
exclude individuals with neurological or neuromuscular disorders or other TMS
contraindications (Keel, Smith & Wasserman, 2001; Senior, 2002).
Handedness was screened for by: (1) asking subjects which hand they used for
writing, and (2) completion of a handedness inventory (Oldfield, 1971). Use of a
conventional ‘pencil grip’ (i.e., pencil held in a stable position between the thumb,
index and middle fingers in a ‘dynamic tripod grip’)was verified in all participants
given the focus on activation of the first dorsal interosseus (FDI; index finger) and
abductor pollicis brevis (APB; thumb) muscles in the experimental task.
Additionally, participants were questioned regarding (1) the activities they had
performed in the hour prior to study participation, to screen for excessive
hand-related musculoskeletal activity (for example, sustained writing/typing, musical
instrument practice or other repetitive activities), (2) duration of hours awake prior to
testing, (3) nicotine use, and (4) medication use, as these factors have been reported
to have variable effects on cortical excitation-inhibition in the TMS literature
(Chipchase et al., 2012; Ridding & Ziemann, 2010). No participants were excluded
on the grounds of excessive activity, sleep deprivation, or nicotine dependence. One
Fagerstrom criteria (Fagerstrom, 1978). No participants were taking prescribed
psychotropic, anticonvulsant, GABA-agonist or dopaminergic drugs. One
participant, post-renal transplant ~10 years earlier, was on a long-term stable regime
of immunosuppressant medication which included a corticosteroid
(methylprednisolone).
The experimental procedures were approved by the Social Sciences Human Research
Ethics Committee at UTAS (Ethics Approval no. HOOO9261; see Appendix A1) in
accordance with the Declaration of Helsinki. All subjects gave written informed
consent prior to study participation.
Electromyographic recording and MEP measurement
Electromyographic (EMG) activity was recorded throughout the experiments via
Ag/AgCl surface electrodes placed over the right FDI and APB muscles in a
belly-tendon arrangement. The reference electrode was located over the distal process of
the ipsilateral radius. The raw EMG signal was amplified (1000x) and filtered
(bandwidth: 20-1000 Hz) with a CED1902 amplifier (Cambridge Electronics Design,
Cambridge, UK), and sampled at 5kHz using a CED 1401 data acquisition system.
Sweeps were collected from 100ms pre- to 400ms post-test pulse delivery. Data was
stored on a laboratory computer for on-line visual display and subsequent off-line
analysis (Signal 4.09 software, Cambridge Electronics Design). TMS-evoked
parameters were measured in the target muscles in the resting state, defined as absent
or minimal background EMG activity. Verification of target muscle relaxation was
achieved by: (i) visual inspection of muscle EMG activity off-line, and (ii)
measurement of the maximum EMG excursion (peak-to-peak) in the interval 55 –
transformed EMG amplitudes <25µV defining an acceptable level of muscle
relaxation (Carson et al., 2004).
Transcranial magnetic stimulation
Participants were seated in a comfortable chair in front of a desk throughout the
experimental procedure, with their right arm maintained in a relaxed position. TMS
was administered using two Magstim 2002 (Magstim Co., Whitland, UK) stimulators
through a single figure-of-eight coil (70mm external wing diameter) connected to a
BiStim module. The magnetic coil was positioned tangentially to the scalp of the left
hemisphere (contralateral to the dominant right hand), with optimal coil location
designated as the site consistently yielding the largest MEPs in the FDI or APB
muscle using a moderately suprathreshold intensity. This site (the ‘motor hand area’)
was marked on the scalp using an indelible marker to facilitate consistent coil
placement throughout the experiment. Induction of posterior-to-anterior current flow
was achieved by orientation of the coil handle posteriorly and laterally at
approximately 30-45° from the mid-sagittal line, optimising trans-synaptic activation
of the corticospinal tract.
The resting motor threshold (RMT), defined as the minimum stimulus intensity
eliciting MEPs of ≥ 50µV on ≥ 3 of 5 consecutive trials in the resting target muscle,
was determined by a standard protocol (Garry & Thomson, 2009). This measure
formed the basis of the subsequent single-pulse (TS) and paired-pulse (CS) stimulus
intensity calculations. Excitability of the corticospinal system4 was indexed by
recruitment curves (RC), depicting the relationship between MEP amplitude and
TMS intensity (Ridding & Rothwell, 1997). Intracortical inhibition (ICI) was
indexed via two measures: (i) the cortical silent period (CSP), defined as the period
of EMG silence following the MEP when TMS is administered to the motor cortex
during active muscle contraction, and (ii) change (attenuation) in MEP amplitude
elicited by a paired-pulse TMS protocol with an interstimulus interval (ISI) of 3ms
(Kujirai et al., 1993). The paired-pulse conditioning stimulus (CS) was set at 70%
RMT and paired with each of the four suprathreshold increments in test TMS
intensity (CS:TS) as follows: 70:120% RMT, 70:130% RMT, 70:130sp% RMT
(defined below) and 70:140% RMT.
Procedure
The experiment comprised two conditions – a writing task and a drawing task – each
separated by at least one week, with participants randomised to order of task
completion. Only the data from the drawing task condition will be analysed for this
thesis as the writing task data is the subject of a concurrent Honours thesis.
TMS-evoked EMG measures for the two target hand muscles were taken at: (i) four time
points: pre-task baseline 1 (B1) and 2 (B2), and post-task at 0 (P0) and 15 (P15)
minutes, and (ii) at four intensities for each time point: 120, 130, 130sp, and 140%
RMT (see below), with each intensity delivered in both a single-pulse (TS) and
paired-pulse (CS) mode (Figure 1). The ordering of the four intensities was
randomised for each participant. A measure for CSP duration was collected during
active target muscle contraction at a single intensity (130% RMT; denoted ‘130sp’),
at each of the 4 time points. For this measure, participants were instructed to hold the
pen used in the experimental drawing task using a conventional ‘pencil grip’, and
calibrate the force/pressure exerted on the pen to approximately 10% of maximal
voluntary contraction (MVC). Thus for each time point (B1, B2, P0, P15) and
intensity (120, 130, 130sp, 140% RMT), a total of 10 single and 10 paired TMS
by customised software. The recruitment curves (RC; test intensity versus MEP
amplitude) generated for each muscle at each of the 4 time points therefore
[image:24.595.114.527.159.219.2]represented the 10 MEPs from each TMS mode and intensity.
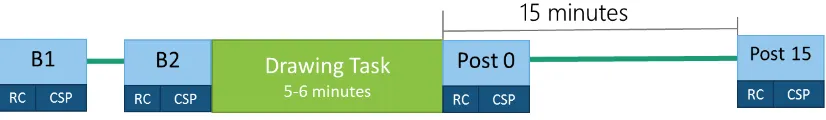
Figure 1. Timeline of the experimental protocol for pre- and post-task measurement
of TMS-evoked EMG indices. Motor cortex excitation and GABAA-mediated
intracortical inhibition are captured in the recruitment curves, and GABAB-mediated
inhibition in the CSP measure.
Experimental Task
Following the baseline measures, the pen-and-paper (drawing) task was completed.
Participants were instructed to copy a sequence of 3 simple geometric symbols
(○ûü) onto a grid of 200 squares on a sheet of A4 paper, resulting in a total of 600
symbols being copied. This matched the number of letters participants wrote in the
writing task. Participants were encouraged to complete the task using a relaxed
non-fatiguing handwriting speed. The task took 5-6 minutes to complete.
Design
This study employed a 2 x 4 x 4 repeated measures design, with TMS type (TS and
CS), time (B1, B2, P0, P15) and intensity (120, 130, 140, 130sp% RMT) as the
within-subject factors. The dependent variables were MEP amplitude and ICI across
all conditions, and CSP during active muscle contraction. The CSP data was
Data Analysis
Individual MEP peak-to-peak amplitude was measured in the interval 15-60ms
post-TMS stimulus, as per standard protocols (Garry & Thomson, 2009). Mean
peak-to-peak amplitude of single-pulse (TS) and paired-pulse (CS) MEPs for each target
muscle was calculated for each participant at each level of time and intensity.
Statistical Analysis
Statistical analyses were performed using IBM SPSS Statistics 21 (IBM SPSS,
Armonk, NY, USA). Prior to analysis, data were visually inspected for normality.
For each muscle, three-way repeated measures ANOVA was used for analysis of
EMGRMS(background) and post-stimulus MEP amplitudes, with TMS type (2 levels),
time (4 levels) and intensity (4 levels) as the within-subject factors. Inclusion of the
‘130sp’ data set as a level of intensity enabled examination of the effect of muscle
activation on M1 excitability. The Greenhouse-Geisser epsilon correction was used
to adjust for violations of sphericity. Where indicated by a significant F, post-hoc
pairwise comparisons were conducted with Bonferroni correction for multiple means
to control for type I errors. Results were considered significant at p<0.05 for all
analyses. All values (MEP amplitude, EMGRMS amplitude) are expressed as mean ±
Results
Analyses were performed and will be reported for both hand muscles. The
experimental findings were essentially mirrored in both muscles, but in instances
where discrepant findings occurred, FDI will be considered the primary muscle for
interpretation of findings, as this was the muscle for which all TMS parameters were
set.
1. Background EMG activity
Intrinsic hand muscle relaxation in the resting muscle conditions (120, 130, and
140% RMT) and muscle contraction in the 10% MVC condition (130sp% RMT)was
verified through analysis of the EMGRMS data in the interval 55-5 ms pre-TMS
stimulus onset.
Background resting EMGRMS activity was consistently less than 0.025mV (see
Figure 2), the threshold generally accepted as indicating an absence of muscle
activation (Carson et al., 2004). This finding was confirmed through three-way
repeated measures ANOVAs for both muscles, with no significant differences in
extent of background EMG activity across levels of TMS type or time:
FDI: FTMStype(1,7) = 1.72, p = .231, ηp2 = .20
FDI: Ftime(1.93, 13.49) = .65, p = .532, ηp2 = .09
APB: FTMStype(1,7) = .66, p = .443, ηp2 = .09
APB: Ftime(1.53,10.71) = .22, p = .746, ηp2 = .03
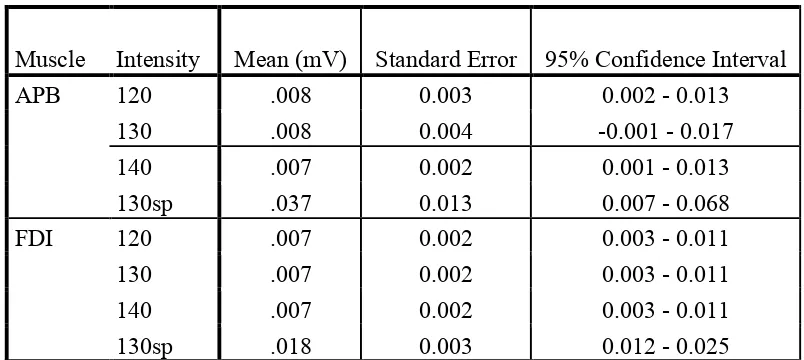
For EMGRMS activity across the levels of intensity, a significant difference was
expected between the intensities requiring muscle relaxation (120, 130, 140% RMT)
confirmed with ANOVA for FDI: Fintensity(1.02,7.14) = 15.13, p = .006, ηp2 = .68, and
reached near significance for APB: Fintensity(1.02,7.13) = 4.68, p = .066, ηp2 = .40,
with higher background MEP amplitude means for both muscles for the 130sp level
(see Appendix C2, Table 1.2 for means). These results indicated that participants
performed the muscle contraction task as instructed, and validated the data set for the
[image:27.595.114.521.240.663.2]subsequent analyses.
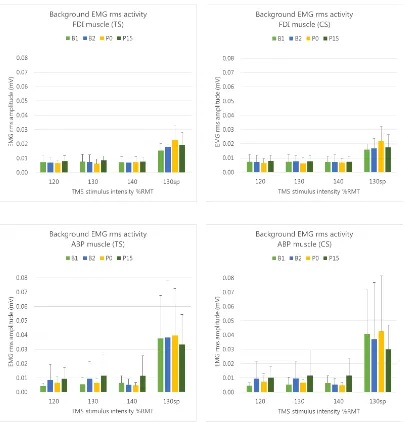
Figure 2. Background EMGRMS activity (in the 55-5ms interval pre-TMS stimulus
onset) for FDI (upper panels) and APB (lower panels) muscles, across intensities
P0: post-task0min, and P15: post-task15min) for single-pulse (TS) and paired-pulse (CS)
TMS type. Across both muscles, stimulus types, time points and intensities
(excepting 130sp% RMT) the EMGRMS activity was < 0.025mV. The error bars
indicate the upper limit of the 95% CI.
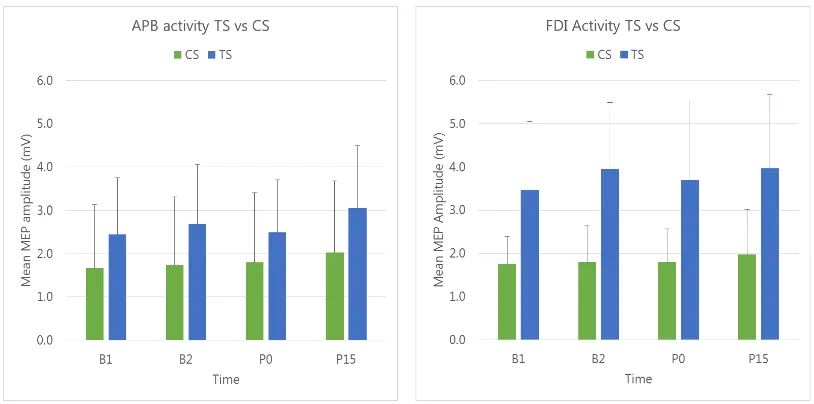
2. Corticospinal excitability
2.1. Recruitment curves
MEP amplitudes from the FDI and APB muscles were obtained over a range of TMS
intensities to generate recruitment curves5 at each level of time. The changes in the
height of each bar reflect the effect of TMS intensity (and muscle activity in the
130sp condition) on MEP amplitude. These changes are compared in Figure 3, for
each TMS type and hand muscle, with the four levels of time each represented by a
different bar. The means, standard error (SE) and confidence intervals (CI) for both
muscles can be found in Appendix C2, Table 1.2.
2.2. FDI muscle
As expected, a clear relationship between MEP amplitude and stimulus intensity was
evident across all levels of time, with the largest MEP amplitudes elicited in the
‘130sp’ condition where the target muscle was actively contracted6. The effect of
intensity was confirmed with three-way repeated measures ANOVA, with a
significant main effect of intensity, Fintensity(2.1,14.6) = 23.20, p < .001, ηp2 = .77.
Contrary to our hypothesised prediction (MEPB1 = MEPB2 = MEPPost15 < MEPPost0),
no significant difference was evident in the MEP amplitude means across time (see
Figure 3), indicated by the similarity in the height of the bars for each level of time at
5 depicted as bar graphs
each level of intensity for the respective TMS types. This lack of significant change
was confirmed using a three-way repeated measures ANOVA, with a non-significant
effect of time, Ftime(2.4,16.9) = .74, p = .514, ηp2 = .096.
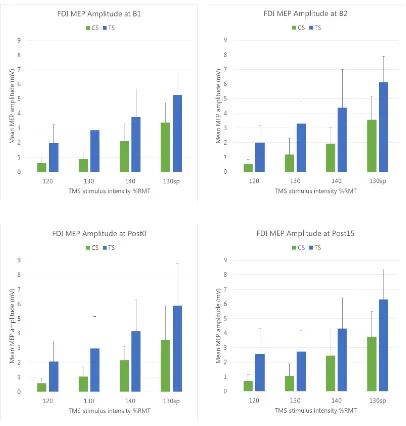
Figure 3. EMGMEP recruitment curves for each level of time (B1, B2, Post0, Post15)
for the FDI (upper panel) and APB (lower panel) muscles, for single-pulse (TS) and
paired-pulse (CS) TMS types. The error bars indicate the upper limit of the 95% CI.
2.3. APB muscle
As for FDI, a significant main effect of intensity was present, Fintensity(1.3,9.2) = 8.58,
p = .013, ηp2 = .55. Again, there was no significant main effect of time,
Ftime(2.1,14.8) = 3.33, p = .062, ηp2 = .32.
3. Intracortical inhibition
Intracortical inhibition (ICI) was elicited by paired-pulse TMS and indexed by the
difference in amplitudes between the conditioned MEPs (MEPCS) and unconditioned
MEPs (MEPTS), across time and intensity. As the main experimental concern with
respect to inhibition was change in magnitude of inhibition across time (pre- versus
post-task), the primary analysis was focussed on ascertaining a main effect of TMS
type (MEPTS > MEPCS means), and the presence of any TMS type x time interaction.
3.1. Primary analysis
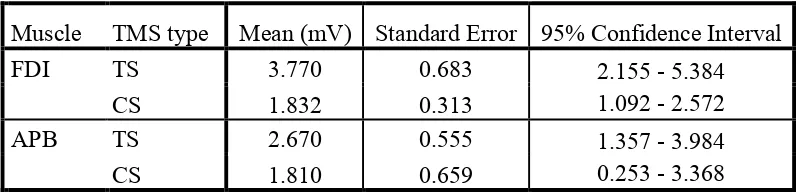
3.1.1. FDI muscle: A significant main effect of TMS type, F(1,7) = 8.39, p = .023, ηp2
= .55 indicated that MEPCS amplitudes were attenuated relative to MEPTS, consistent
with activation of inhibitory circuits by the conditioning TMS stimulus (see
Appendix C2, Table 1.1 for means). All second-order interaction effects involving
TMS type were non-significant: TMS type x time: F(1.44, 10.09) = 1.95, p = .194, ηp2
= .218; and TMS type x intensity: F(2.17, 15.22) = 1.59, p = .236, ηp2 = .185,
indicating that the extent of inhibition in this muscle did not vary significantly across
the conditions of time and intensity. As per Figure 4, the bar graphs depicting FDITS
and FDICS activity7 show that the pattern of MEP activity for conditioned versus
unconditioned stimuli is essentially the same for each level of time, indicating a
similar magnitude of inhibition at all intensities and at each level of time.
Figure 4. FDI recruitment curves reflecting the magnitude and pattern of intracortical
inhibition elicited by the conditioned TMS stimulus (MEPCS) compared to the
unconditioned stimulus (MEPTS), across four levels of intensity, and at four time
points (pre-task upper panels, post-task lower panels). The error bars indicate the
upper limit of the 95% CI.
3.1.2. APB muscle: As for FDI, attenuation of MEP size was observed in the CS
condition, and confirmed with ANOVA with a significant main effect of TMS type,
respect to second order effects, the TMS type x intensity interaction was
non-significant (F(1.37, 9.55) = 3.53, p = .083, ηp2 = .34), however the TMS type x time
interaction was found to be significant, F(1.85, 12.92) = 4.15, p = .043, ηp2 = .37 (see
Table 1 for means, SE and CI). The nature of this interaction was clarified through
follow-up simple effects ANOVAs of the effect of time for each TMS type (TS vs
CS), via two-way repeated measures ANOVA. A significant main effect of time was
found for TMSTS: FTS (2.08, 14.57) = 4.80, p = .024, ηp2 = .37, but not for TMSCS:
FCS(1.94, 13.57) = 1.77, p = .207, ηp2 = .20, indicating that the TMS type x time
interaction was produced by changes elicited by the unconditioned TMS stimulus
(TS; indexing excitation), and not by the conditioned TMS stimulus (CS; indexing
inhibition).
3.2. Secondary analysis
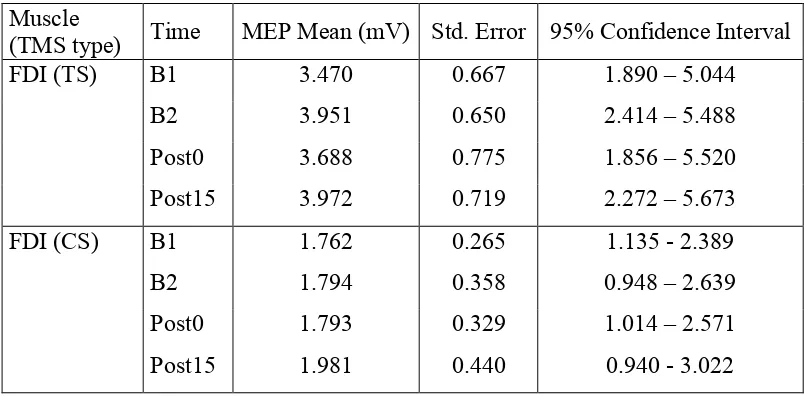
Effect of time on MEPAPB_TS: As per Table 1 (below), the MEPTS amplitude means for
APB muscle varied in magnitude at both pre-task and post-task time points. To
clarify the significant main effect of time for TMSAPB_TS , post-hoc pairwise
comparisons (with Bonferroni correction for multiple means) were performed for all
the levels of time. These comparisons, however showed no significant differences
between or within the pre-task and post-task time points (see Appendix C2, Table 2
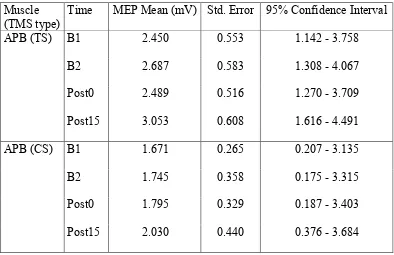
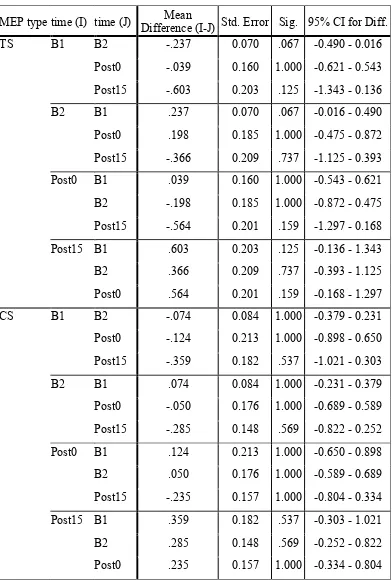
Table 1.
APB muscle: Effect of time on single-pulse (TS) (upper panel) and paired-pulse (CS)
(lower panel) TMS-elicited MEP mean amplitudes (mV), ± SE, and CI. A significant
main effect of time was found for TMSTS but not for TMSCS.
Muscle (TMS type)
Time MEP Mean (mV) Std. Error 95% Confidence Interval
APB (TS) B1 2.450 0.553 1.142 - 3.758
B2 2.687 0.583 1.308 - 4.067
Post0 2.489 0.516 1.270 - 3.709
Post15 3.053 0.608 1.616 - 4.491
APB (CS) B1 1.671 0.265 0.207 - 3.135
B2 1.745 0.358 0.175 - 3.315
Post0 1.795 0.329 0.187 - 3.403
Post15 2.030 0.440 0.376 - 3.684
Given the discrepant results for FDI and APB muscles for the TMS type x time
interaction analysis, the FDI analysis will take precedence due to it being the target
muscle. On this basis, given the non-significant TMS type x time interaction for FDI,
it was concluded that inhibition was unchanged across the levels of time (see
Appendix C2, Table 1.4 for FDI means, SE and CI).
As depicted in Figure 5, the pattern in MEP activity across time for each TMS type is
[image:33.595.113.507.200.455.2]Figure 5. MEP amplitude change across time, for TS and CS TMS types, for both FDI (left panel) and APB (right panel) muscles. The error bars indicate the upper limit of
the 95% CI.
Discussion
The primary aim of the present study was to investigate the effects of a simple task
of daily living on motor cortex excitability. The drawing task served as our model of
an overlearned motor skill routinely performed as an activity of daily living. A
secondary aim was to consider whether any effects on M1 excitability of this task
might account for some of the variability that characterises particular TMS measures.
Primary motor cortex (M1) and corticospinal activity pre- and post-task were
indexed via MEPs elicited by TMS.
Corticospinal excitability is reliably reflected by rapid changes in magnitude and
direction of MEP amplitudes at time of measurement. It was hypothesised that a
routine over-learned motor activity such as handwriting (in the form of a drawing
task) would have a transient effect on measures of motor corticospinal excitability
and intracortical inhibition (ICI), with increased MEP amplitudes and decreased ICI
baseline levels by 15 minutes post-task completion. The results of the study,
however, did not support the hypothesis.
With respect to corticospinal excitation, the main effect of time was non-significant
for the target FDI muscle, with the MEPs demonstrating no significant change in
amplitude between the pre-task and post-task levels. Rapid and complex integrative
responses involving recruitment and disengagement of effector and non-effector
muscles (in the order of milliseconds or less) are a characteristic of corticospinal
system activity and require intra-task measurement to quantify. Our post-task time
point of measurement was not designed to capture any intra-task excitation given the
study question was focussed on post-task changes. Our findings clearly indicated that
if there were any immediate post-task excitability changes, they were not sustained.
Task-dependent changes in M1/corticospinal excitation-inhibition
Modulation of M1/corticospinal excitability has been shown to be task-dependent,
and influenced by the dimensions of task complexity and novelty (Carey, Bhatt &
Nagpal, 2005). Complex and/or novel task execution has been demonstrated to elicit
more extensive M1 activation than simple or overlearned tasks (Boisgontier,
Wittenberg, Fujiyama, Levin, & Swinnen, 2014; Kouchtir-Devanne, Capaday,
Derambure & Devanne, 2012; Pascual-Leone et al., 1995). M1 activity elicited by
complex but clearly overlearned tasks is less clear. Our hypothesised increase of
immediate post-task corticospinal excitability and decreased inhibition was derived
from experimental findings demonstrating selective short-term induction of M1
excitation in response to relatively brief duration motor activity associated with novel
task execution. These studies all reported effects (behavioural and/or
time (typically less than 20 minutes) before returning to baseline (Classen et al.,
1998; Garry, Kamen & Nordstrom 2004; Muellbacher et al., 2002). The hypothesised
decrease in ICI derived from findings indicating that inhibition mediates hand muscle
selectivity and specificity for the pending task (Liepert, Classen, Cohen & Hallett,
1998; Stinear & Byblow, 2003; Stinear, Coxon & Byblow, 2009). These findings,
however, were from novel task settings, and are potentially not generalisable to the
overlearned task setting. Given that CS-elicited inhibition remained unchanged
across time in the present study, there was insufficient evidence to support the
hypothesis relating to intracortical inhibition. Overall, drawing task complexity did
not elicit sufficient M1/corticospinal activity to be reflected in measurable sustained
changes of excitation or inhibition immediately post-task.
Influence of muscle preactivity
The temporal relationship between low-grade hand muscle contraction and its
potential influence on TMS-elicited measures of M1 excitability was also evaluated
from our data. The phenomenon of variability in cortical measures or responses,
attributed to muscle activity pre-TMS application, has been reported by some
(Gentner, Wankerl, Reinsberger, Zeller & Classen, 2007; Goldsworthy,
Muller-Dalhaus, Ridding & Ziemann, 2014; Goldsworthy, Pitcher & Ridding, 2012; Huang,
Rothwell, Edwards & Chen, 20088; Iezzi et al., 2008), but not all investigators (Sale,
Ridding & Nordstrom, 2007; Doeltgen & Ridding, 2010). The mechanisms
responsible for this effect elicited by a preceding voluntary muscle contraction are
unclear, but intriguing, given that hand muscle contraction is procedurally simple and
8 the protocol investigated was continuous theta burst stimulation (cTBS), a well-characterised technique for inducing neuroplastic changes in M1 (Huang et al., 2008)
automated, therefore theoretically the least likely task to elicit substantial
effect/influence on M1 indices of excitation-inhibition.
Muscle contraction of this extent/duration is remarkably common, often performed
below the level of conscious awareness (for example, as involuntary hand muscle
contraction evoked by mild anticipatory anxiety) or integral to activities performed
prior to TMS study participation (for example, handwriting, carrying a briefcase,
gripping a car steering wheel or bicycle handles). Our drawing task, completed in
approximately 6 minutes, and requiring low-grade contraction (~10% MVC) of
intrinsic hand muscles for pencil grip, exceeded the duration of muscle contraction
eliciting the effects on variability reported in the literature. There was no evidence of
increased variability across the MEP amplitude means at either of the post-task time
points in our data. This finding of minimal/insignificant change with respect to
cortico-motor activity post-drawing does not, however, definitively exclude indirect
or remote effects of the preceding motor activity on later M1 activity/response
(Muller-Dalhaus & Ziemann, 2014); these types of effects, however, were not
measured in this study. The potential impact of antecedent muscle activity on
plasticity-inducing protocols, whether in the form of learning paradigms (with
behavioural outcome measures) or TMS-based investigations or interventions is,
however, of increasing practical and clinical relevance given the prevalence and
breadth of TMS applications.
M1/corticospinal excitability changes associated with handwriting/drawing
Naturalistic tasks performed in the course of daily living (for example,
communication via typing, email, texting, handwriting, or symbolic drawing) have
automated when skill is proficient (Plamondon, O'Reilly, Rémi & Duval, 2013). Due
to difficulties in controlling for the varied dimensions of these types of tasks they
have had less empirical study than simpler tasks. Of the imaging studies evaluating
writing or reading, the majority have measured within-task changes in
excitation-inhibition, principally to gain understanding of M1 mechanisms of task
differentiation and execution. Therefore, empirical evidence with which to directly
compare our study findings is severely limited.
Two studies (Filipovic, Papathanasiou, Whurr, Rothwell & Jahanshahi, 2008;
Papathanasiou, Filipovic, Whurr, Rothwell & Jahanshahi, 2004), evaluating the
effects of handwriting and low-level cognitive tasks on M1 excitation-inhibition,
reported findings relevant to the outcomes of the present study. An important caveat
in consideration of these findings is that of state-dependence, i.e., the change in the
nature and dynamics of physiological interactions in different behavioural state
settings, for instance, resting muscle versus active task execution states (Reis et al.,
2008). These studies evaluated intra-task changes compared to our pre- and post-task
time points, so extrapolation of conclusions requires caution. These studies, however,
represent the few conducted with naturalistic tasks, so will be discussed from that
perspective.
Filipovic and colleagues (2008) compared writing and drawing tasks on measures of
M1 excitation-inhibition during task execution. They found a comparable level of
increased corticospinal excitatory activity (indexed by MEP amplitudes) mediating
the motor aspects of task execution across the three conditions (drawing, writing and
a control/pen-squeezing task) of their study, but no significant additional change in
conditions. A change in cortical silent period duration9 was reported for the writing task alone, and interpreted as mediating task-execution for the task with greatest
linguistic ‘load’ (the writing task) compared to the tasks with minimal or no
linguistic load (the drawing and control tasks). The focus of their study, however was
measurement of indices of task differentiation, so the presence of post-task
excitation-inhibition was not measured. Notwithstanding this, their finding of no
significant additional or differential change in corticospinal excitability during
performance of a well-practiced procedural skill (writing and drawing) is generally
consistent with our finding of minimal impact of a well-practised task on
corticospinal excitability.
In contrast, Papathanasiou and colleagues (2004), in a study seeking to separate out
the motor and cognitive components contributing to M1 excitation in tasks such as
writing and drawing, compared M1 activity from both hemispheres across a range of
non-motor cognitive tasks. The tasks were designed to correspond with the
‘low-level’ cognitive elements underpinning reading and writing – both well practiced
activities performed on a daily basis for literate individuals. A visual search-match
paradigm was utilised with linguistic, numerical and geometric symbols as the
different conditions. They found that MEP amplitudes from the right (dominant
hand) FDI muscle were elevated across all tasks, with a significant difference
between each task when individually compared to a control condition involving no
cognitive activity. In comparisons between the tasks, no significant difference was
found, however, between the linguistic and geometric symbol conditions. That study
highlighted the ready facilitation of M1 by non-motor tasks, for both the
well-practised aspects (discrimination between letters and geometric shapes) as well as
9 a measure of GABA
the novel aspects (visual search-match), as well as the difficulties of evaluating novel
versus well-practised dimensions of tasks and their respective contributions to
cortical excitability responses. Compared to the finding by Filipovic et al. (2008), the
finding of no inter-task difference on MEP amplitude measures was the same.
Filipovic and colleagues, however, measured ICI in addition to M1 excitability, and
it was only in this dimension that significant differences were found and attributed to
the feature (‘linguistic load’) that distinguished the tasks. The absence of a measure
of inhibition potentially limited the likelihood of Papathanasiou and colleagues
detecting any task difference.
Notwithstanding some of the similarities discussed, drawing tasks do differ from
writing tasks in important ways. Whilst both are skilled fine-motor tasks sharing
visuo-spatial and symbolic representational dimensions, there are well established
differences relating to cortical representation, with drawing more widely distributed
and bilaterally represented in contrast to the strongly lateralised language processing
regions in the dominant hemisphere (Bracco et al., 2009; Brown & Kosslyn, 1993;
Sturz, Edwards & Boyer 2014). This clear delineation has been confirmed with
functional neuroimaging, however different studies (and imaging modalities) have
identified differing cortical areas (primary motor cortex versus non-motor cortices)
as mediating significant drawing-writing differentiation (see Harrington, Farias,
Davis & Buonocore, 2007 for a review). Extrapolating from the findings of
non-TMS neuroimaging (given the paucity of non-TMS studies examining drawing), it is not
surprising that drawing may not elicit a substantial intra-task (and corresponding
post-task) response from M1 other than the background corticospinal drive required
encoding. More studies are needed to clarify, both intra- and post-task, the nature and
extent of M1 activity associated with drawing.
Cortical representational shift in early and late stage learning
In line with the discussion regarding cortical representation of drawing is the
phenomenon of shift in memory encoding as tasks become well consolidated and
stored in long-term memory. M1 has a critical role in early motor (Classen et al.,
1998; Muellbacher et al., 2002) and non-motor learning (Sanes & Donoghue, 2000),
however a shift occurs to more widely distributed network of cortical regions when a
task is well-learned (Squire & Wixted, 2011; Walsh & Pascual-Leone, 2003).
Correspondingly M1 becomes relatively less important, and theoretically less
responsive with respect to excitation-inhibition when called upon to perform tasks
that have reached the level of procedural automaticity (Rosenkranz, Kacar &
Rothwell, 2007). Whilst some evidence for this shift has been demonstrated using
simplified experimental tasks and other imaging modalities (Puttemans, Wenderoth
& Swinnen, 2005; Ungerleider, Doyon & Karni, 2002), there is little empirical
evidence from well-learned complex procedural tasks such as drawing. Nonetheless,
this anatomical shift underpinning distributed storage in long-term memory likely
contributed, in part, to the absence of sustained M1/corticospinal activity following
the drawing task.
M1/corticospinal excitability changes associated with activities of daily living
The influence of time of day, whether attributable to circadian neuroendocrine
effects, or other incompletely understood mechanisms that up- or down-regulate the
capacity for plasticity-induction, has important practical implications with respect to
evaluated this factor (Doeltgen & Ridding, 2010; Koski, Schrader, Wu & Stern,
2005), in largely naturalistic settings, with the aim of identifying underlying
biological or other variables (e.g., muscle activity) that systematically bias measures
of M1 activity. Koski and colleagues evaluated serial changes in RMT and CSP
(obtained from FDI and APB) over seven TMS sessions, from both hemispheres, in a
ten hour period in the same subjects. They chose not to control for variables such as
test session time of commencement, fatigue, food or caffeine intake, or hand muscle
use in writing/typing, on the basis that in a clinical setting these factors are largely
outside the clinician’s control. Hand muscle contraction preceded each CSP measure,
as per standard protocol. Their findings confirmed the relative stability of MT and
CSP in the group as a whole over the 10 hour period, with these measures robust to
the influence of activities of daily living and hand muscle pre-activity. Doeltgen &
Ridding (2010) examined time of day influence across a number of TMS indices and
likewise found no significant effects in their participants (see earlier discussion in
Introduction). Their findings highlighted the minimal influence, on a broad range of
TMS measures, of cumulative hand muscle activity over the course of a day.
The ecological validity of both studies enables practical application of the finding
that time of day (at least between the hours tested) does not appear to bias the values
acquired over a wide range of TMS measures. Drawing, like the majority of activities
of daily living, involves significant, dexterous and task-dependent recruitment of the
hand muscles and corresponding engagement of the hand area of M1. The drawing
task of our study has findings in accordance with Doeltgen & Ridding10, with the
practical implication that hand use, to the extent required by drawing, does not
significantly influence the peripheral TMS-derived measures of M1
excitation-inhibition obtained from the intrinsic hand muscles.
Variability of TMS measures and contributory factors
Variability of TMS measures informed our research question, and was evident in our
data, but most importantly, was not substantially increased post-drawing task. There
is general consensus that resting motor threshold (Koski, Schrader, Wu & Stern,
2005) and MEP onset latency (Kiers, Cros, Chiappa, & Fang, 1993) are least affected
by variability, with MEP amplitudes the most extensively impacted, with a high
degree of intertrial, inter- and intra-individual variability (Boroojerdi et al., 2000;
Darling, Wolf & Butler, 2006; Wasserman, 2002). Intrinsic physiological
fluctuations in excitability at cortical, subcortical and spinal segmental levels are
considered to underlie variability, and comprise the ‘normal’ dynamic state of central
and peripheral nervous system activity (Ridding & Ziemann, 2010; Wasserman,
2002). Standardised protocols were adopted to minimise variability attributable to
methodological factors (as per Boroojerdi, 2000; Kamen, 2004; Moller, Arai, Lucke
& Ziemann, 2009; Schmidt et al., 2009; & Wasserman, 2002). Variability
attributable to use of a hand-held TMS coil was likely to have been minimal. Whilst
alterations in the position of a hand held TMS coil on the scalp are known to result in
variations in MEP responses, the use of external apparatus (e.g., navigational systems
or stereotactic frames) to clamp/stabilise the coil relative to head position and
optimise stimulation site localisation has not been shown to significantly decrease
MEP variability (Jung et al., 2010; Schmidt et al., 2009).
Other factors potentially contributing to variability include circadian effects on
cortical excitation-inhibition (Lang et al, 2011). High cortisol levels are theorised to
increased in the afternoon when endogenous cortisol levels are low (Sale, Ridding &
Nordstrom, 2007, 2008).
Our experimental testing was performed in the morning and early afternoon (9am to
4pm). Plasma cortisol levels are maximal in the morning immediately post-waking,
decrease rapidly in the initial 1-2 hours, and further decrease to a trough level 14
hours post-waking (Ranjit, Young, Raghunathan & Kaplan, 2005). Seven of our
eight participants had been awake for two or more hours prior to testing, and all eight
were tested within 10 hours of waking, thus any cortisol-mediated circadian effects
were minimised. The sole participant who had been awake less than one hour was
also the sole cigarette smoker. Nicotine has been reported to have variable effects on
TMS-elicited indices of excitation-inhibition (Lang, Hasan, Sueske, Paulus &
Nitsche, 2008). For this participant, the data collected did not represent extremes of
the MEP amplitude range, so the influence and/or interaction between a diurnal
cortisol peak and nicotine-related effects on the measures collected are unlikely. An
additional participant was on a long-term post-renal transplant regime of
immunosuppressant and corticosteroid drugs. The testing for this individual occurred
~8 hours post-corticosteroid ingestion, was therefore remote from any
pharmacologically-derived cortisol ‘peak’, and elicited measures in the mid-range of
the group values.
Motor cortex and corticospinal activation, independent of muscle activity, are also
responsive to multiple influences including attention (Kiers, Cros, Chiappa, & Fang,
1993; Rosenkranz & Rothwell, 2004; Thomson, Garry & Summers, 2008), varying
sensory inputs (Rosenkranz & Rothwell, 2004, 2012), mental imagery (Alaets et al.,
movement preparation (van Elswijk, 2007). These factors variably influence
excitability of the motor corticospinal pathway and subsequent responses to TMS
stimuli. Some of these factors may operate below the level of conscious awareness,
so experimental controls to minimise their influence vary in efficacy.
Notwithstanding attention to extraneous and methodological variables, MEP
amplitude variability was still evident in our data, to an extent that attained statistical
significance for one of the intrinsic hand muscles (APB, the non-principal target, for
TMSTS mode alone).
Study limitations
The subjective calibration of force production in the muscle activation condition
(10% MVC, 130sp% RMT) was an intentional decision. In clinical settings there is
substantial reliance on an individual’s subjective report/perception of force exertion
as direct measurements are not always available to objectively quantify the
magnitude of forces being exerted (Koski, Schrader, Wu & Stern, 2005). Whilst
objective verification of the accuracy of force calibration is desirable, there is
evidence that reasonably accurate quantification of perceived force exertion is
achievable by healthy individuals. Hampton, Armstrong, Shah & Li (2014) evaluated
accuracy of perceived force exertion during isometric finger contraction (calibrated
by Borg scale11 criteria) without visual or auditory feedback, in healthy and
post-stroke individuals. Both groups demonstrated the capacity to differentiate distinct
levels of perceived exertion, with the stroke group reporting greater perceived
exertion for a given level of MVC. In healthy individuals, the overall trend was for a