Impact of large-scale organic conversion
on food production and food security
in two Indian states, Tamil Nadu
and Madhya Pradesh
P. Panneerselvam
1*, John Erik Hermansen
1, Niels Halberg
2and P. Murali Arthanari
3 1Department of Agroecology, Faculty of Science and Technology, Aarhus University, Blichers Allé, PO Box 50, DK-8830 Tjele, Denmark.
2
International Centre for Research in Organic Food Systems (ICROFS), Blichers Allé, PO Box 50, DK-8830 Tjele, Denmark.
3
Department of Agronomy, Tamil Nadu Agricultural University, Coimbatore, India. *Corresponding author: panneerkvt@gmail.com
Accepted 15 November 2013 Research Paper
Abstract
The millions of food insecure people in India are not solely due to inadequate food production, but also because some people are simply too poor to buy food. This study assessed how a large-scale conversion from conventional to organic production would impact on the economics of marginal and small farmers in Tamil Nadu and Madhya Pradesh, and on the total food production in these states. This study also considered a situation where fertilizer subsidies would be discontinued, with farmers having to carry the full cost of fertilizer. Results show that conversion to organic improved the economic situation of farmers although food production was reduced by 3–5% in the organic situation. Thus, the estimated economic values were higher in the organic system (5–40% in fertilizer subsidy scenario and 22–132% in no fertilizer subsidy scenario) than in the conventional system, whereas the total state-level food productions were lowered by 3–5% in the organic compared to the conventional system. Food production was higher when rainfed, and lower in the irrigated situation in the large-scale organic scenario. Although the study addresses short-term perspectives of large-scale conversion to organic farming, more research is needed to understand the long-term impact of organic conversion on food production, nutrient supply, food security and poverty reduction.
Key words:organic farming, small farmers, food production, food security
Introduction
Green revolution technologies increased food production and helped India to achieve self-sufficiency in the 1980s1. However, India is still home to 231 million under-nourished people with a majority of these (175 million) living in rural areas2. This highlights the fact that the green revolution did not entirely address the issues faced by a significant section of rural India which comprises mainly marginal and small farmers. In India, 81% of farms are <2 ha and make up 38% of the total cultivated area3.
The FAO conference on organic agriculture and food security in May 2007 concluded that organic agriculture has the potential to improve the food security in developing countries, particularly for small farmers4.
Organic agriculture includes both certified and non-certified food systems. Organic agriculture may improve the local food security through the production of a diverse range of products at a lower input cost than in conventional farming5, thus alleviating the poverty of smallholders. Organic agriculture may also have a number of environmental benefits like improved soil structure, increase in soil organic matter content6,7and larger biodiversity8,9, even though this is mostly docu-mented in temperate regions. Under low-input conditions such as in East Africa, organic agriculture—mostly non-certified—has been found by a large number of NGOs to improve yields and food security10. However, organic farming has been found to result in lower crop yields11,12, especially in high-yielding areas, and there is a challenge in managing the nitrogen availability in organic systems11.
© Cambridge University Press 2013
Archived
at
Only a few have studied the large-scale conversion of organic farming and its possible impacts on food production and food security. Organic conversion would not have a severe impact on global food supply, but would rather help to improve local food availability and food security in developing countries, particularly sub-Saharan Africa13. The results of another study show that organic methods could produce enough food on a global per capita basis to sustain the current or a larger population without increasing the land area under cultivation14. These modeling studies considered the impact of organic agriculture on global food supply and world food security. However, there is lack of country-specific modeling of large-scale organic conversion on food security. Hence, this study was to assess the economic situation of marginal and small farm types, and state-level food production in the large-scale organic scenario in two states of India––Tamil Nadu and Madhya Pradesh.
Materials and Methods
This section is divided intofive subsections: thefirst sub-section presents the land-use pattern and socio-economic situations in the studied states before large-scale conver-sion, the second subsection describes the land-use changes and yield ratio for large-scale organic conversion, the third subsection shows the data sources and secondary data collection at state level, the fourth subsection describes the method of calculation for assessing the economic situation, and calculation of the state-level food production in the organic scenario is presented in thefifth subsection.
Land use and socio-economic situation before
large-scale conversion
Two states in India were considered in this study—Tamil Nadu and Madhya Pradesh, which represent different but typical challenging situations of a high proportion of resource-poor smallholder farmers dependent on rainfed agriculture. Moreover, there are experiences with organic agriculture in these two states, which formed a basis for household-level surveys. In order to study a hypothetical situation where all the marginal and small farm types would convert their production to organic farming, it was necessary to create a simulation of a regional status by up-scaling the significantly relevant factors. Thefirst part of this study at the household level15 conducted in three states of India in order to represent three very different situations in terms of agro-ecological conditions, farming system, market access and activities of NGOs promoting organic farming. The states chosen for household study were Uttarakhand, Madhya Pradesh and Tamil Nadu, respectively from north, central and southern parts of India. However, Uttarakhand, a new state, was left out for
the up-scaling due to lack of secondary data. In Tamil Nadu, the Center for Indian Knowledge system, an NGOs promotes organic farming among small and marginal farmers to improve their food security. The NGO provides training to the farmers on organic farming and, to some extent, interest free credit. Also, the NGO educates the farmers to use farm resources to manage soil fertility and pests and diseases. In Madhya Pradesh, BioRe India, a private company, promotes organic cotton production. BioRe provides the associated farmers with training and technical advice on organic cotton pro-duction and purchases the cotton with a 20% price premium on actual market rates. The company operates an internal control system and arranges for external organic certification by an internationally accredited agency. Costs for extension, certification and for the organic price premium are recovered by selling the certified organic fiber at a higher price in international markets. The up-scaling of household study is justifiable because small and marginal holders represent more than 70% of the total farm holding in Madhya Pradesh and 90% in Tamil Nadu (Tables 1and2).
In Tamil Nadu, marginal and small farms accounted for 90% of the total farm holdings, contributing 62% of the total food grain production of the state (Table 1), whereas in Madhya Pradesh, marginal and smallholdings constitute 70% of the cultivated land area, producing 30% of the total food grain output (Table 2). The share of pulses to the total food grain basket is higher in Madhya Pradesh, sharing 27% of the food grain area and 17% of the food grain production. Rice is the major crop in Tamil Nadu, whereas wheat and rice are the major crops in Madhya Pradesh. Each marginal and small farm culti-vates an average of 0.48 ha in Tamil Nadu and 0.87 ha in Madhya Pradesh. In India, farm classification is based on the landholding size, and a household possessing <1 ha of land is classified as a marginal holding, 1–2 ha is a smallholding, 2–4 ha is semi-medium, 4–10 ha is medium and large holding is 10 ha and above.
Typically, marginal and small farms mainly borrow from private lenders to meet the cost of fertilizers and pesticides, and hence they are highly vulnerable to indebtedness because of the high risk of crop failure due to climatic variability. Private lenders are the primary source of loans for marginal farmers both in Tamil Nadu and Madhya Pradesh, whereas government institutions and private lenders are the primary source of loans for the small farmers (Table 3).
Yield ratios and land-use changes in
large-scale organic scenario
conventional productions were calculated and are pre-sented in Table 5. The yield ratio is the proportion of organic to non-organic yields reported by the studies. For example, the yield ratio of 0.80 means organic yield is 80% of the conventional yield obtained from the same crop from a given area. Similarly, the variable cost ratio is the ratio of organic to non-organic cost incurred for
[image:3.595.47.544.65.296.2]producing a given quantity of produce. Relative land use is the proportion of the area of a particular crop in an organic system relative to the non-organic system. In the up-scaling process, a number of assumptions of crops grown was made. The assumption on land-use changes has been performed based on the crop yield, the external input, nitrogen fixation, nutritional impacts and
Table 2. Land use, crop production and number of holdings under different farm types in Madhya Pradesh.
All farm types
Marginal and small farm types
% share of marginal and small farm types Area
(1000 ha)
Percent under irrigation
Production (1000 t)
Area (1000 ha)
Production (1000 t)
Cereals (A) 7270 10,358 2250 3223 31
Rice 1660 14 1527 634 583 38
Wheat 3990 82 6731 1114 1880 28
Maize 860 1064 275 341 32
Pulses (B) 3250 2568 815 670 26
Chickpea 2460 50 2061 605 507 25
Food grains (A + B) 10,520 12,927 3064 3894 30
Oilseeds (C) 5650 5634 1327 1367 24
Soybean 4760 4693 1057 1042 22
Cotton (D) 640 40 829 164 212 25
Others (E) 1113 314
Total cropped area
(A + B + C + D + E)1
17,923 4869 27
Irrigated 4266 1125 26
Rainfed 13,657 3743 27
Total no. of holdings 7,472,000 5,075,000 70
Average area/holding (ha) 2.00 0.87
1
[image:3.595.47.545.349.616.2]This represents the total area sown in a year, i.e., the area counted as many times as there are sowings in a year.
Table 1. Land use, crop production and number of holdings under different farm types in Tamil Nadu.
All farm types
Marginal and small farm types
% share of marginal and small farm types in area Area
(1000 ha)
Percent under irrigation
Production (1000 t)
Area (1000 ha)
Production (1000 t)
Cereals (A) 2581 54 7056 1626 4372 63
Rice 1808 93 5649 1175 3672 65
Sorghum 334 6 313 190 178 57
Maize 194 40 727 80 299 41
Pulses (B) 559 4 237 307 133 55
Food grains (A + B) 3140 58 7294 1947 4506 62
Oilseeds (C) 643 1163 399 714 62
Other crops (D) 2035 1080
Total cropped area
(A + B + C + D)1
5819 3426 59
Irrigated 3515 2139 61
Rainfed 2304 1286 56
Total no. of holdings 7,858,887 7,072,155 90
Average area/holding (ha) 0.74 0.48
1
greenhouse gas emission. Detailed assumptions for the organic scenario are presented inTable 5. In general, the major shift in the cropping pattern toward rice and wheat in India has resulted in a lower consumption of pulses, from 42 g per capita per day in 1990 (72 g in 1956) to 33 g in 200518. This has incidentally resulted in more than 50% of the Indian population having a protein calorie deficiency19. Moreover, rice emits more green-house gas than peas or pulses20, so increasing the area under legumes has potential advantages in terms of reducing malnutrition, greenhouse gas emissions and improving soil fertility.
In the present scenarios, the relative land use was determined based on the distribution and performance of the crops under organic systems from household surveys16 showing more pulses grown and home-consumed in organic households. This was supported by other studies that suggest integration of legumes in the cropping systems in organic scenarios for nutrient man-agement. Moreover, the Tamil Nadu State Agricultural Department recommended an alternative cropping pat-tern for some rice-growing areas, suggesting that it could be replaced by maize or pulses particularly in rainfed situations with, or under uncertainty in, water release from reservoirs21. A high number of farmers in Kerala reduced their rice area due to deterioration of soil health,
poor nutrient use efficiency and a build-up of pests and diseases, and converted to more profitable crops22. Another study also suggests that crop diversification of maize, pulses (green gram, pigeon pea and black gram) and ground nut performs better in rainfed rice areas, and suggests that the area under rainfed rice could be replaced by maize or pulses to increase the income of the farmers23.
Data collection at the state level
[image:4.595.52.549.64.212.2]The secondary data on land size, percentage of area under irrigation and number of holdings were derived from the state statistics3,24–26. The area of each crop at the state level was derived from ‘Agricultural statistics at a glance’24. The area under each crop for marginal and small farms was extracted. Owing to the lack of accurate data for crop yields across the farm types, the yields were assumed equal for all farm types, although small farms could be expected to produce higher yields than large farms. Production in the conventional system from marginal and small farms was set as baseline production. Variable costs in conventional farming included purchase of seeds, fertilizers, manures and chemicals. Labor cost was not included in the calculation because it was difficult to obtain trustworthy data. An earlier comparative study omitted labor costs from the calculation of the
Table 3. Indebtedness and source of loan by farm types in Tamil Nadu and Madhya Pradesh.
Tamil Nadu Madhya Pradesh Marginal Small Others Marginal Small Others
Share of farms in total indebted farm households (%) 72.7 15.4 11.9 33.0 27.0 40.0
Source of loan (%)
Government and cooperative societies 18.7 25.4 23.0 8.43 14.5 26.4
Banks 15.3 36.1 51.1 21.3 38.2 41.4
Moneylenders 56.4 29.9 19.7 41.5 21.2 17.3
Traders 0.9 0.4 0.3 9.6 14.2 5.5
Friends 6.8 7.2 1.7 16.8 10.4 8.7
Others 1.8 1 3.9 2.2 1.5 0.5
All 100 100 100 100 100 100
Source: Adopted from the situation assessment survey of farmers in India, by NSS26.
Table 4. Average yield (kg ha−1) in organic and conventional systems (from Eyhorn et al.17and Panneerselvam et al.41).
Panneerselvam et al.411 Eyhorn et al.172
Organic Conventional Organic Conventional
Cotton irrigated 1322 1694 Maize 1373 1287
Cotton rainfed 1044 1187 Sorghum 424 430
Wheat 1250 2080 Pigeon pea 1022 765
Rice 3392 4270 Soybean 803 870
Peanut 1246 1432
1
Average of 40 farms each in organic and conventional. 2
[image:4.595.49.550.267.370.2]net revenues27 since very often in developing countries family labor has little opportunity for income13,28,29. The household survey16 attempted to study labor use in farming activities on an individual farm basis when pre-testing the questionnaire. However, it was not possible to obtain sufficiently precise numbers due to the use of family labor for most of the farming activities and a highly irregular nature of input, e.g., varying between 2 and 9 h day−1depending on need. Other studies have reported no differences in labor input between the organic and conventional farms in India17 and suggest that smallholders have adequate labor force for farming organically30.
Calculation of the parameters for assessing
the economic situation in the organic scenario
The economic condition of the farmers was estimated in two situations: first by subtracting the variable cost (including interest at different rates) from the crop value, and second by subtracting the total costs (variable cost plus cost of fertilizer subsidy) from the crop value. The interest rate for the costs incurred for the inputs was included in the assessment. Variable costs include interest rates of 15 and 30% per annum, respectively, for loans obtained from the government and private moneylen-ders31. Also, a hypothetical situation of the government
withdrawing the fertilizer subsidies was considered––as happened in Ethiopia where fertilizer subsidies were withdrawn from 199832. In this situation, the farmers have to carry the cost of the fertilizer subsidies, because the cost of this subsidy is added to the input costs. The fertilizer subsidies were derived from the secondary data for the marginal and the smallholders in Tamil Nadu and Madhya Pradesh33and calculated for the unit area. A sensitivity analysis was performed by assuming different premium prices of the organic sales of 10 or 20%. This was based on the price premium of 10% found for the non-certified organic products in Tamil Nadu and for Madhya Pradesh a price premium of 20% was found for the certified organic products16. It is acknowledged that the up-scaling does not take into account the long-term impact of organic agriculture and costs of certifi ca-tion and training (often covered by the NGOs). However, the up-scaling process has the advantage of integrating some hypothetical assumptions of different issues and their impact on food production and income.
Calculation of state-level food production
in the organic scenario
[image:5.595.48.547.88.329.2]The methodological framework for the calculation of food production is presented in Fig. 1. The areas of marginal and small farms were extracted from the total
Table 5. Ratio of crop yield, variable cost and land use in an organic scenario compared to the baseline (conventional).
Yield ratio Variable cost ratio
Relative land occupation of each crop following adjustment of the cropping pattern
in the organic scenario
Tamil Nadu Madhya Pradesh
Rice 0.80 0.67 0.50 0.50
Wheat 0.60 0.36 0.50
Sorghum 1.1 0.88 0.50 1.00
Pearl millet 1.1 0.88 0.50 2.81
Maize 1.1 (0.94) 0.92 5.27 1.08
Finger millet 1.1 0.88 0.50
Other cereals 1.1 0.88 0.47
Pigeon pea 0.92 0.73 4.75 1.47
Green gram 0.92 0.73 3.46
Black gram 0.92 0.73 1.00
Chick pea 0.92 0.73 1.92
Lentil 0.92 0.73 1.00
Other pulses 0.92 0.73 1.04
Peanut 0.92 (0.87) 0.66 1.40 4.14
Sesame 0.92 (0.87) 0.66 0.85
Soybean 0.95 0.94 1.02
Mustard 0.92 0.66 1.00
Cotton 0.88 (0.78) 0.36 0.50
Note: The values in ( ) are the ratios for the irrigated situation of the respective crops. All of the other ratios are for the rainfed situation, except rice and wheat.
cultivated area at the state level. The areas under marginal and small farms were converted to organic by applying the hypothetical assumptions mentioned above. The production from these converted areas is labeled as Organic MS production. The productions were calculated separately for the rainfed and the irrigated areas occupied by the marginal and small farms. Production from the medium and the large farms (not converted to organic) was added to the Organic MS production to obtain Organic production at the state level. Production from the marginal and the small farms under the conventional system of production is Baseline MS production. Pro-duction from all of the farm types from the conventional systems is called Baseline production at the state level.
Results
Estimated economic value of the
farm holdings
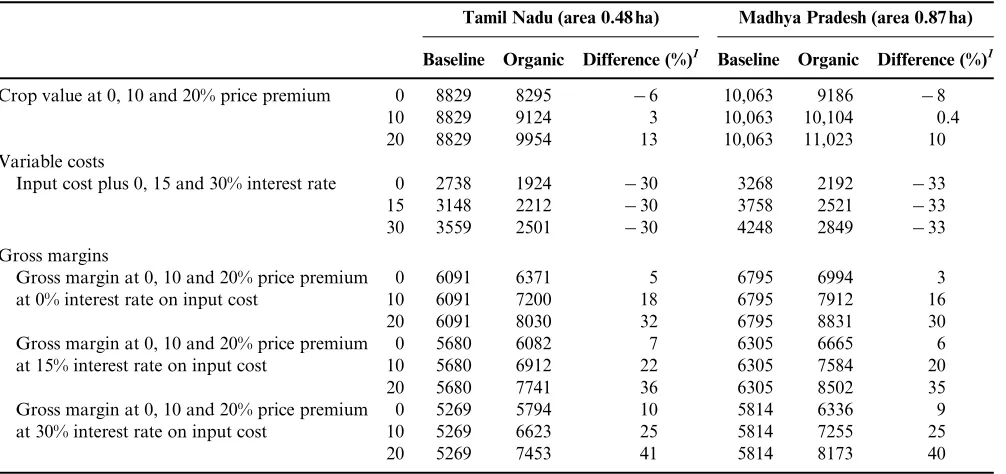
The estimated crop value in the organic scenario was lower (6–8%) than in the baseline scenario when no price premium was assumed, both in Tamil Nadu and Madhya Pradesh (Table 6). However, the estimated gross margin was higher in organic than in baseline both in Tamil Nadu and Madhya Pradesh, even at no price premium (Table 6). This was due to the 30% input cost reduction in organic systems. The variation in gross margin between the organic and the baseline increased with increasing price premium for organic products and, though less markedly, increased interest rate on the input cost. The difference in gross margin increased with increasing interest rate on loans which was due to the higher input
cost in the conventional system reducing their gross margin. The gross margin was Rs. 5269 for the baseline compared with Rs. 7200 for the organic scenario in Tamil Nadu, when given a 10% price premium for non-certified organic products and organic farmers receiving interest-free credits from NGOs, in contrast to conven-tional farmers receiving credit at 30% interest as ob-served in the organic project area15. The gross margin was Rs. 5814 for the baseline scenario compared with Rs. 7912 for the organic in Madhya Pradesh. This means about 36% increase of the gross margin in the organic scenario over the baseline.
The variation in the gross margin between the organic and the conventional was much wider in the hypothetical situation of no fertilizer subsidy, thus the organic had a higher gross margin than the conventional in Tamil Nadu, at 80, 106 and 132% with a 0, 10 and 20% price premium, respectively (Table 7). Similarly, the gross margin was 43, 63 and 84% higher in the organic systems at a 0, 10 and 20% price premium in Madhya Pradesh. These were due to higher production costs in the conventional system due to additional costs of fertilizer subsidy in the input cost, and a price premium for the organic products. In Tamil Nadu, under the no fertilizer subsidy scenario, organic farms had higher gross margin, 98 and 124% increase over the baseline at 0 and 10% premium price (for the organic product), respectively, whereas in Madhya Pradesh, the organic farms had a higher gross margin and 57 and 78% increase over the baseline at 0 and 10% premium price, respectively. Conventional farmers in Tamil Nadu were more affected than those in Madhya Pradesh because of their more extensive use of fertilizer and higher fertilizer subsidy per holding.
Total cultivated area at state
level State-level food productionin a baseline situation
State-level food production after converting marginal and small farms into organic farming
Production in organic situation in small and marginal farms
Production in medium and large farms
Conversion into organic No conversion
Area of marginal and small farms
Area of medium and large farms
[image:6.595.120.480.50.287.2]The difference in food production at state level in organic compared to baseline situation
Estimated production after large-scale
conversion of marginal and small farm types
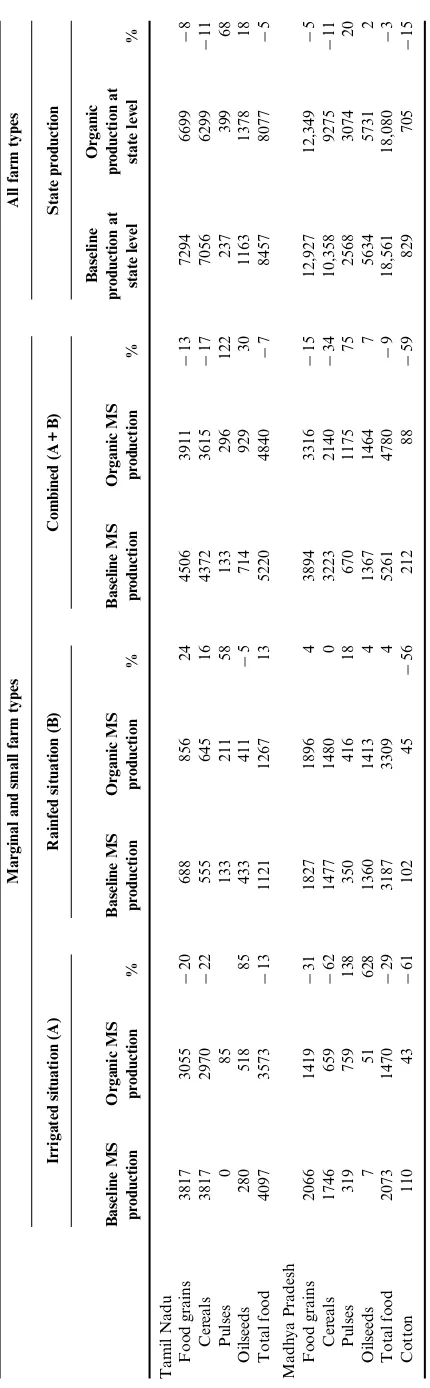
Marginal and small farms cultivate 3.4 million ha (59% of the area of all of the farm types) in Tamil Nadu and 4.8 million ha (27% of the area of all of the farm types) in Madhya Pradesh. Conversion of these marginal and small farms into organic farming reduced food pro-duction at the state level, 5% in Tamil Nadu and 3% in
[image:7.595.49.552.74.311.2]Madhya Pradesh over the baseline (Table 8). The conversion of the rainfed areas exclusively was beneficial by producing 13 and 4% more food from these areas in Tamil Nadu and Madhya Pradesh, respectively, compared to their rainfed baseline, whereas the organic conversion of the irrigated areas had a negative impact on food production. Owing to the assumed land-use changes, the production of pulses and oilseeds was found to be consistently higher in the organic scenario than the
Table 6. Estimated economic keyfigures in the baseline and the organic scenarios from the marginal and the small farms (Indian rupees/holding per year).
Tamil Nadu (area 0.48 ha) Madhya Pradesh (area 0.87 ha) Baseline Organic Difference (%)1 Baseline Organic Difference (%)1
Crop value at 0, 10 and 20% price premium 0 8829 8295 −6 10,063 9186 −8
10 8829 9124 3 10,063 10,104 0.4
20 8829 9954 13 10,063 11,023 10
Variable costs
Input cost plus 0, 15 and 30% interest rate 0 2738 1924 −30 3268 2192 −33
15 3148 2212 −30 3758 2521 −33
30 3559 2501 −30 4248 2849 −33
Gross margins
Gross margin at 0, 10 and 20% price premium at 0% interest rate on input cost
0 6091 6371 5 6795 6994 3
10 6091 7200 18 6795 7912 16
20 6091 8030 32 6795 8831 30
Gross margin at 0, 10 and 20% price premium at 15% interest rate on input cost
0 5680 6082 7 6305 6665 6
10 5680 6912 22 6305 7584 20
20 5680 7741 36 6305 8502 35
Gross margin at 0, 10 and 20% price premium at 30% interest rate on input cost
0 5269 5794 10 5814 6336 9
10 5269 6623 25 5814 7255 25
20 5269 7453 41 5814 8173 40
1
Difference in the percentage in organic compared to the baseline.
Note: crop value = yield × price, Gross margin = crop value–variable cost.
Table 7. Estimated economic keyfigures in the baseline (assuming the inclusion of fertilizer subsidy in the variable costs) and the organic scenarios (Indian rupees/holding per year).
Tamil Nadu (area 0.48 ha) Madhya Pradesh (area 0.87 ha) Baseline Organic Difference (%)1 Baseline Organic Difference (%)1
Total cost: Input cost plus cost of fertilizer subsidy plus 0/15/30% interest
0 4325 1924 −55 4323 2192 −49
15 4973 2212 −55 4971 2520 −49
30 5622 2501 −55 5619 2849 −49
Gross margin
Gross margin at 0, 10 and 20% price premium at no interest on total cost
0 4504 6371 41 5740 6994 22
10 4504 7200 60 5740 7912 38
20 4504 8030 78 5740 8831 54
Gross margin at 0, 10 and 20% price premium at 15% interest rate on total cost
0 3855 6082 58 5091 6665 31
10 3855 6912 80 5091 7583 49
20 3855 7741 100 5091 8502 67
Gross margin at 0, 10 and 20% price premium at 30% interest rate on total cost
0 3206 5793 81 4443 6336 42
10 3206 6623 106 4443 7255 63
20 3206 7453 132 4443 8173 84
1 Difference in the percentage in the organic compared to the baseline.
[image:7.595.50.548.382.575.2]baseline scenario. In Tamil Nadu, the estimated pulse and oilseed productions were, respectively, 68 and 18% higher in the organic than the baseline scenario, whereas in Madhya Pradesh the rise was 20 and 2%, respectively.
Discussion
Most of the households in the two states of India are marginal and small farms cultivating <2 ha and a large proportion of the farms are indebted. They need low-cost technology that uses on-farm resources to lever them-selves out of the vicious cycle of poverty and food insecurity. This modeling study showed that large-scale conversion may have both positive and negative impacts on food security. Marginal and small farms—which constitute 90 and 70% (Tables 1and2) of the total farm holdings in Tamil Nadu and Madhya Pradesh, respect-ively—can potentially increase the gross margin (mainly by reducing production costs) and avoid the risk of debt by converting to organic. But such a large-scale con-version could also reduce food production by approxi-mately 5% at the state level, if the organic yields are not improved.
The smallholder farmers can increase their income even without a price premium if they receive proper training and technical support to manage soil and pests15. Systematic training and extension in agro-ecological practices—which is not only supported by the NGOs but also by the state and the central governments—could increase nutrient management and crop yields, for example, by supporting organic fertilization parallel to the subsidies to chemical fertilizer use. Building improved soil fertility through agro-ecological practices could also render organic farms more resilient to climatic insta-bility34 and to changes in government policy, such as a discontinuation of fertilizer subsidy. In such a situation, the conventional system of production would be much more affected, assuming that the cost of the fertilizer subsidy would be carried by the farmers. The present level and the mechanism of the fertilizer subsidies masks the high costs of conventional production, and organic production would be even more competitive if such subsidies were not only tied to the fertilizer but also to organic manure and other agro-ecological soil fertility management practices. This is not just a theory, but is practiced in the Philippines under the Organic Fertilizer Production Project supported by the Bureau of Soils and Water Management (BSWM) to assist the national rice and corn program35. The Philippine government has supported this project by establishing 64 biological nitrogen fertilizer production units, about 2700 com-munity-based composting facilities and 26,713 bags of annual production (50 kg per bag) of organic fertilizers. Similarly, a study from India found that small farms improved their economic and ecological indicators in a scenario with a policy to support organic agricultural
[image:8.595.64.279.41.735.2]practices compared to a policy that continues to support market based, synthetic inputs for cultivation36.
Certification costs and conversion costs were not included in this study. It may not be realistic to assume price premiums for all of the organic crops sold under a large-scale conversion scenario, since most produce will be home-consumed or sold locally. Thus, this up-scaling model included an organic scenario with no price premium (for non-certified organic products) and there-fore, will not require costs for conversion and certification, besides the basic training in agro-ecological practices. Also, it is difficult to calculate the cost for conversion on an individual basis for the small and the marginal farms in India as most often the NGOs or companies promot-ing organic organize free trainpromot-ing, extension and help certification on a group basis. Examples are, in the case of Tamil Nadu, the Center for Indian Knowledge systems15 and, in the case of Madhya Pradesh, a private company, BioRe15. On the other hand, a scenario where part of the current fertilizer subsidies were re-directed to also support local-scale organic fertilizer production or (training in) agro-ecological soil fertility practices would compensate for the knowledge-based conversion costs.
The study indicated that the overall food production in the organic scenario would be approximately 5% lower in Tamil Nadu and 3% lower in Madhya Pradesh given the relative yields used in the models. This 5 and 3% reduction at the state level may lead to higher food prices which may have a negative impact on the food security of the urban poor and landless rural people. However, conversion to organic has the advantages of reducing the production costs and the indebtedness, and of increasing the income, of the marginal and the small farmers who constitute 80% of the food insecure in India2. Moreover, most of the farms in Tamil Nadu were under a conversion period when the household survey was conducted15so there is a reason to believe that the organic yields may increase in Tamil Nadu after completion of the conversion period. The estimated pulse yields were conservative, because not all the families had yet introduced pulses due to lack of knowledge and seeds. Similarly, in the Madhya Pradesh case study which forms the basis of the relative yields a private company supports specific organic crops for a lucrative export market but the organic farmers are lacking knowledge and inputs to grow the full range of rotational food crops15. These factors resulted in a rela-tively conservative estimate of the state-level food pro-duction in our organic scenario. As discussed in Halberg et al.13 modeling of the food security consequences of large-scale conversion to organic agriculture is mostly sensitive to the projections of relative yield growth over time, and given the current low degree of research and, training in agro-ecological farming methods, there seems to be a wide potential for significant yield improvements in the organic systems in India.
Conversion of the rainfed areas to organic agriculture was found to be potentially beneficial for smallholder
farmers because of almost comparable yields under these conditions and reduced input costs. Following this rationale, 76 and 40% of the area which is rainfed in Madhya Pradesh and Tamil Nadu, respectively (Tables 1and2), and 55% of the total rainfed agricultural land in India37, have conditions of competitive organic yields and large numbers of smallholder farms, which makes conversion to organic agriculture potentially interesting. Other studies also reported improvement in the yield and the income in rainfed areas by adopting organic farm-ing36,38 and conservation tillage39. Conservation tech-nologies such as zero or minimum tillage with direct seeding, residue cover and crop rotations, combined with better use of organic sources of nutrients including animal manure, crop residues and legumes, have potential to increase the water and nutrient use efficiency, and are also effective in reducing soil organic carbon losses40.
An additional benefit of converting to organic agricul-ture is that the higher pulse and legume oilseed production in the organic situation could increase the protein content in the diets of impoverished families16 and may help to counter the protein malnutrition that persists among more than 50% of the Indian population19. Such a reintroduction of more pulses in the smallholder farms is not theoretically exclusive to organic systems, butfits well into a logic of using locally available resources and agro-ecological practices for soil improvement and human nutrition. However, low yield in the organic system, particularly in irrigated conditions, is the major barrier for such a large-scale conversion41. Adopting organic prac-tices with no tillage and direct seeded rice in irrigated areas has a potential to improve the water use efficiency and yield in addition to reducing the global warming potential (about 75%) compared to the conventional puddled transplanting method of rice40. Two recent comprehen-sive meta-analyses compared the yields of organic and non-organic agriculture in three sets of conditions, irrigated versus rainfed, legumes versus non-legumes and developed versus developing countries, and found that organic yields were higher in rainfed areas, and in systems with legumes in developing countries11,12.
local food security for the millions of food insecure, resource poor and indebted smallholder farmers.
Conclusion
This study indicates that conversion to organic farming may increase the gross margin of marginal and small farms by reducing their production costs and debts in an organic scenario with a policy that subsidizes fertilizer use for conventional farms. Among the two states, conven-tional farmers in Tamil Nadu were more affected than those in Madhya Pradesh because of their more extensive use of fertilizer and higher fertilizer subsidy per holding. The advantage of organic farming was larger under a scenario without fertilizer subsidies and the study suggests diverting part of the fertilizer subsidies to supporting organic and agro-ecological soil fertility measures. Large-scale conversion of marginal and small farms can have a small negative impact on the overall state-level food production. This study showed that the rainfed areas of marginal and small farms were more suitable for conversion to organic farming in the short run, due to comparable organic and conventional yields. Thus, 76 and 40% of the rainfed area, in Madhya Pradesh and Tamil Nadu, respectively, and 55% of the rainfed areas of the country are suitable for organic agriculture. Conversion of the irrigated areas can have a negative impact on food production and food security, but an increased cultivation of pulses and oilseeds (legume oilseeds—peanut and soybean) may compensate partly for the lower cereal yields. Organic production that has a higher proportion of legumes, crop diversification and a lower cost of production can potentially alleviate the consequences of crop failure resulting in further indebtedness of poor families, which is common in Indian agriculture. Although the study addresses short-term perspectives of large-scale conversion to organic farming, more research is needed to understand the long-term impact of organic conversion on food production, nutrient demand and supply, and poverty reduction.
Acknowledgement. We thank the International Centre for Research in Organic Food System (ICROFS) for funding this research through the GlobalOrg project.
References
1 Donald, W.L., Eugene, J., Pannu, R.S., and Sheokand, R.S.
2004. Instability in Indian agriculture—a challenge to the
green revolution technology. Food Policy 29:257–273.
2 FAO (Food and Agricultural Organization). 2008. The state
of food insecurity in the world. Available at Web sitehttp://
www.fao.org/docrep/011/i0291e/i0291e00.htm (accessed January 15, 2009).
3 Agricultural Census. 2001. Agricultural Census Division, Ministry of Agriculture, New Delhi. Available at Web site
http://agcensus.nic.in/(accessed July 10, 2009).
4 Scialabba, N.E. 2007. Organic agriculture and food security. In International Conference on Organic Agriculture and
Food Security, May 3–5, 2007, Food and Agriculture
Organization of the United Nations, Italy. (OFS/2007/5).
Available at Web site http://www.fao.org/organicag
(ac-cessed December 12, 2013).
5 IFAD (International Fund for Agricultural Development). 2005. Organic Agriculture and Poverty Reduction in Asia:
China and India Focus. Available at Web site http://www.
ifad.org/evaluation/public%5Fhtml/eksyst/doc/thematic/ organic/(accessed April 26, 2010).
6 Marriott, E.E. and Wander, M.M. 2006. Total and labile soil organic matter in organic and conventional farming systems.
Soil Science Society of America Journal 70:950–959.
7 Fließbach, A., Oberholzer, H.R., Gunst, L., and Mäder, P. 2007. Soil organic matter and biological soil quality indicators after 21 years of organic and conventional farming.
Agriculture, Ecosystems and Environment 118:273–284.
8 Bengtsson, J., Ahnström, J., and Weibull, A.C. 2005. The effects of organic agriculture on biodiversity and abundance:
A meta-analysis. Ecology 42:261–269.
9 Tscharntke, T., Clough, Y., Wanger, T.C., Jackson, L., Motzke, I., Perfecto, I., Vandermeer, J., and Whitbread, A. 2012. Global food security, biodiversity conservation and
the future of agricultural intensification. Biological
Con-servation 151:53–59.
10 UNEP-UNCTAD. 2006. The Status of Organic Agriculture
Production and Trading Opportunities in Tanzania.
Final Report presented at the UNEP-UNCTAD Capacity
Building Task Force of Trade, Environment and
Development Regional Workshop on Organic Agriculture
in East Africa, March 6–10, Arusha, Tanzania.
11 Seufert, V., Ramankutty, N., and Foley, J.A. 2012. Comparing the yields of organic and conventional
agricul-ture. Nature 485:229–232.
12 De Ponti, T., Rijk, B., and Van Ittersum, M.K. 2012. The crop yield gap between organic and conventional agriculture.
Agricultural Systems 108:1–9.
13 Halberg, N., Rosegrant, P., Sulser, T., Knudsen, M.T., and Høgh-Jensen, H. 2006. The impact of organic farming on food security in a regional and global perspective. In N. Halberg, M.T. Knudsen, H.F. Alrøe, and E.S. Kristensen (eds). Global Development of Organic Agriculture: Chal-lenges and Prospects. CABI Publishing, Wallingford,
UK. p. 277–322. Available at Web sitehttp://ecowiki.org/
GlobalPerspective/ReportOutline (accessed December 12, 2013).
14 Badgley, C., Moghtader, J., Quintero, E., Zakem, E., Chappell, M.J., Avilés-Vàzques, K., Samulon, A., and Perfecto, I. 2007. Organic agriculture and the global food supply. Renewable Agriculture and Food Systems
22:86–108.
15 Panneerselvam, P. 2011. Improving smallholder’s food
security through organic agriculture in India. PhD thesis, Faculty of Science and Technology, Aarhus University, Aarhus, Denmark.
16 Panneerselvam, P., Hermansen, J., and Halberg, N. 2011. Food security of small holding farmers: Comparing organic and conventional systems in India. Journal of Sustainable
Agriculture 35:1–21.
India. International Journal of Agricultural Sustainability
5:25–38.
18 Ministry of Finance. 2008. Economic survey. Ministry of
Finance, Government of India. Available at Web sitehttp://
indiabudget.nic.in/es2006-07/agriculture.htm (accessed December 12, 2013).
19 Indian National Science Academy. 2009. Nutrition
security for India: Issues and way forward. Available at
Web sitehttp://typo3.fao.org/fileadmin/user_upload/fsn/docs/
Symposium_Report_Nutrition_Security_India.pdf (accessed August 8, 2010).
20 Kanyama, A.C. 1998. Climate change and dietary choices—
how can emission of greenhouse gases from food
consump-tion be reduced? Food Policy 23:77–293.
21 Ramasamy, C., Ramanathan, S., Balasubramanian, T.N., Ragupathy, N., Natarajan, S., Devasenapathy, P., and Natarajan, N. 2004. Alternative Cropping Pattern for Tamil Nadu. Directorate of Research, Tamil Nadu Agri-cultural University, Coimbatore.
22 Das, P. 2002. Cropping Pattern (Agricultural and Horti-cultural) in Different Zones, their Average Yields in Comparison to National Average/Critical Gaps/Reasons
Identified and Yield potential. Indian Council of Agricultural
Research, New Delhi. Available at Web sitehttp://agricoop.
nic.in/Farm%20Mech.%20PDF/05024-02.pdf (accessed June 10, 2003).
23 Kar, G., Singh, R., and Verma, H.N. 2004. Alternative
cropping strategies for assured and efficient crop
pro-duction in upland rainfed rice areas of eastern India based on rainfall analysis. Agricultural Water Management
67(1):47–62.
24 Ministry of Agriculture. 2009. Agricultural statistics at a glance. Directorate of Economics and Statistics, Ministry of Agriculture, Government of India. Available at Web site
http://eands.dacnet.nic.in/At_Glance_2009.htm (accessed December 12, 2013).
25 Statistical Handbook. 2010. Department of Economics and Statistics, Government of Tamil Nadu. Available at Web site
http://www.tn.gov.in/deptst/Stat.htm(accessed April 26, 2010). 26 NSS (National Sample Survey). 2007. Household
Con-sumer Expenditure among Socio-Economic Groups:
2004–2005. National Sample Survey 61st Round. Report
No. 514(61/1.0/7). Ministry of Statistics and Program Implementation, Government of India.
27 Hanson, J.C., Lichtenberg, E., and Peters, S.E. 1997. Organic versus conventional grain production in the Mid-Atlantic: An economic and farming system overview.
American Journal of Alternative Agriculture 12:2–9.
28 Setboonsarng, S., Stefan, A., Leung, P.S., and Cai, J.
2008. Profitability of organic agriculture in a transition
economy: the case of organic contract rice farming in Lao PDR. Paper presented at Cultivating the Future Based on Science: 2nd Conference of ISOFAR, Modena, Italy, June
18–20, 2008.
29 Schumacher, P. 2004. Comparison of conventional and biological cotton production in India, Maikaal area: Cropping pattern, production costs and farmer income.
Diploma thesis, Department of Geography, University of Zurich, Zurich.
30 Rasul, G. and Thapa, G.B. 2004. Sustainability of ecological and conventional agricultural systems in Bangladesh: An assessment based on environmental, economic and social
perspectives. Agricultural Systems 79:327–351.
31 Rajeev, M., Vani, B.P., and Bhattacharjee, M. 2011. Nature
and Dimensions of Farmer’s Indebtedness in India and
Karnataka. The Institute for Social and Economic Change, Bangalore, working paper 267.
32 Araya, H. and Edwards, S. 2006. The tigray experience: A success story in sustainable agriculture. Third World Network Environment and Development series 4. TWN: Penang, pp 45. In: Vaarst M. 2010. Organic farming as a development strategy: Who are interested and who are not?
Journal Sustainable Development 3:38–50.
33 Sharma, V.P. and Thaker, H. 2009. Fertilizer Subsidy in
India: Who are the Beneficiaries? Indian Institute of
Management, Ahmedabad, India. WP No. 2009-07-01.
Available at Web site http://www.indiaenvironmentportal.
org.in/files/fertilizer%20subsidy.pdf(accessed July 10, 2010). 34 Dimitri, C., Kemp, L., Sooby, J., and Sullivan, E. 2012. Organic farming for health and prosperity. Organic Farming
Research Foundations. Available at Web site http://
www.ofrf.org/sites/ofrf.org/files/docs/pdf/HP-report-web.pdf
(accessed April 10, 2013).
35 Carating, R., Fernando, M., Abrina, Y., and Tejada, C.
2011. The Organic Fertilizer Production Project:
Community-Based and Small Scale Soil Fertility and Farm Waste Management Strategies in Support of the National Rice and Corn Program. Bureau of Soils and Water Management, Elliptical Road, Diliman, Quezon City, Philipines.
36 Purushothaman, S., Patil, S., and Francis, L. 2012. Impact of policies favoring organic inputs on small farms in Karnataka, India: A multicriteria approach. Environment
Development Sustainability 14:507–527.
37 Ministry of Agriculture. 2011. Agricultural statistics at a glance. Directorate of Economics and Statistics, Ministry of Agriculture, Government of India. Available at Web site
http://eands.dacnet.nic.in/latest_20011.htm(accessed March 15, 2013).
38 Letter, D., Seidel, R., and Liebhardt, W. 2003. The performance of organic and conventional cropping systems in an extreme climate year. American Journal of Alternative
Agriculture 18:146–154.
39 Ghosh, P.K., Das, A., Saha, R., Kharkrang, E.,
Tripathi, A.K., Munda, G.C., and Ngachan, S.V. 2010. Conservation agriculture towards achieving food security in
North East India. Current Science 99:915–921.
40 Bhatia, A., Kumar, A., Kumar, V., and Jain, N. 2013. Low carbon technologies for sustainable agriculture. Indian
Farming 63(2):18–22.
41 Panneerselvam, P., Halberg, N., Vaarst, M., and
Hermansen, J.E. 2011. Indian farmers experience with and perception of organic farming. Renewable Agriculture