doi: 10.3389/fimmu.2019.00488
Edited by: Scott S. Zamvil, University of California, San Francisco, United States
Reviewed by: Jorge Correale, Fundación para la Lucha contra las Enfermedades Neurológicas de la Infancia (FLENI), Argentina Rishein Gupta, University of Texas at San Antonio, United States
*Correspondence: Heinrich Körner heinrich.korner@utas.edu.au
Specialty section: This article was submitted to Multiple Sclerosis and Neuroimmunology, a section of the journal Frontiers in Immunology
Received:09 October 2018 Accepted:22 February 2019 Published:19 March 2019
Citation: Lu M, McComish BJ, Burdon KP, Taylor BV and Körner H (2019) The Association Between Vitamin D and Multiple Sclerosis Risk: 1,25(OH)2D3
Induces Super-Enhancers Bound by VDR. Front. Immunol. 10:488. doi: 10.3389/fimmu.2019.00488
The Association Between Vitamin D
and Multiple Sclerosis Risk:
1,25(OH)
2
D
3
Induces
Super-Enhancers Bound by VDR
Ming Lu1,2, Bennet J. McComish1, Kathryn P. Burdon1, Bruce V. Taylor1and
Heinrich Körner1,3*
1Menzies Institute for Medical Research, University of Tasmania, Hobart, TAS, Australia,2Department of Immunology, Anhui
Medical University, Hefei, China,3Key Laboratory of Anti-inflammatory and Immunopharmacology, Ministry of Education,
Collaborative Innovation Center of Anti-Inflammatory and Immune Medicine, Institute of Clinical Pharmacology, Anhui Medical University, Hefei, China
A super-enhancer (SE) is a cluster of enhancers with a relatively high density of particular chromatin features. SEs typically regulate key genes that can determine cell identity and differentiation. Identifying SEs and their effects may be critical in predicting key regulatory genes, such as master transcription factor genes or oncogenes. Signal inducible SEs are dense stretches of signal terminal transcription factor (TF) binding regions, and may modulate the interaction between environmental factors (e.g., Vitamin D) and genetic factors (i.e., risk variants) in complex diseases such as multiple sclerosis (MS). As a complex autoimmune disease, the etiology and progression of MS, including the interaction between Vitamin D and MS risk variants, is still unclear and can be explored from the aspect of signal SEs. Vitamin D [with its active form: 1,25(OH)2D3], is an environmental risk factor for MS. It binds the Vitamin D receptor (VDR) and regulates gene expression. This study explores the association between VDR super-enhancers (VSEs) and MS risk variants. Firstly, we reanalyse public ChIP-seq and RNA-seq data to classify VSEs into three categories according to their combinations of persistent and secondary VDR binding. Secondly, we indicate the genes with VSE regions that are near MS risk variants. Furthermore, we find that MS risk variants are enriched in VSE regions, and we indicate some genes with a VSE overlapping MS risk variant for further exploration. We also find two clusters of genes from the set of genes showing correlation of expression patterns with the MS risk geneZMIZ1that appear to be regulated by VSEs in THP-1 cells. It is the first time that VSEs have been analyzed, and we directly connect the genetic risk factors for MS risk with Vitamin D based on VSEs.
INTRODUCTION
The transcription of genes depends on the interaction of their promoter regions with polymerases that synthesize RNA from genomic DNA in combination with an array of regulatory factors (1,2). Additionally, transcription is aided by cis-acting regulatory elements that can be located relatively distant to the promoter region and can bind activator proteins. These enhancer elements are able to increase the level of gene transcription.
Super-enhancers (SEs) are dense clusters of enhancers. They differ from typical enhancers (TEs) in the density of enhancer elements. Enhancers, including both TEs and SEs, can be annotated by histone status, i.e., H3K27ac and H3K4me1. In addition, high chromatin accessibility [e.g., as determined using FAIRE-seq or DNaseI hypersensitive sites (DHS)], master transcription factor binding (e.g., PU.1 for monocytes, RORγt for Th17 cells), and pervasive factors in the transcription machinery (e.g., p300, MED1, BRD4, and RNA polymerase II) are all highly correlated with SE regions and can be used to identify SE regions. Although defined arbitrarily according to enhancer signal density, SEs have proved extremely valuable in predicting key regulatory regions or genes for cell identity or cell differentiation (3). For example, inappropriate acquisition of SE in an oncogene, such as c-MYC, will increase its expression and lead to oncogenesis (4, 5). SE regions promote the expression of autoimmune disease-associated genes. For example, the drug JQ1 [BET (bromodomain and extra-terminal domain) inhibitor] inhibits the expression of inflammatory arthritis risk geneCXCR4 by affecting its SE region (6), and tofacitinib [JAK (Janus kinase) inhibitor] disproportionately inhibits the expression of rheumatoid arthritis risk genes with SE regions compared with those risk genes without SE regions (7).
Previous research has focused on classic SEs identified by chromatin accessibility, master transcription factors or pervasive factors in the transcription machinery, but recently, a new concept of signal-inducible SEs has been proposed (8). It was found that estrogen could induce the generation of new signal SE regions, which were bound by the terminal transcription factor (TF) ERαof the estrogen signaling pathway. The advantage
Abbreviations: BMDM, bone marrow-derived macrophages; ChIA-PET, chromatin interaction analysis by paired-end tag sequencing; ChIP-seq, chromatin immunoprecipitation sequencing; CTCF, CCCTC-binding factor; dex, dexamethasone; DHS, DNase hypersensitivity sites; D3, 1,25(OH)2D3; ECC-1, endometrial cancer cell line; eQTL, expression quantitative trait loci; GR, glucocorticoid receptor; GRSE, super-enhancer formed by GR binding regions; ERα, estrogen receptorα; ER SE, super-enhancer formed by ERαbinding regions; E2, estradiol; FAIRE, formaldehyde-assisted isolation of regulatory elements; FSE, super-enhancer formed by FAIRE regions; GEO, gene expression omnibus; GM10855/GM10861, human lymphoblastoid cells; GWAS, genome wide association studies; LD, linkage disequilibrium; LS180, human colorectal cancer cells; LX2, human hepatic stellate cells; MED1, mediator complex subunit 1; MCF-7, human breast cancer cells; mESC, murine embryonic stem cells; MS, multiple sclerosis; NGS, next generation sequencing; PSE, super-enhancer formed by PU.1 binding regions; RS4;11, human acute leukemia cells (B cell and monocyte like); SE, super-enhancer; SNP, single nucleotide polymorphism; TAD, topologically associating domain; TE, typical enhancer; TF, transcription factor; THP-1, human monocyte-like cells; VDR, Vitamin D receptor; VSE, super-enhancer formed by VDR binding regions; VTE, typical enhancer formed by VDR binding.
of signal SEs for research is that they can provide important information on the signal terminal TF cistrome before and after signal stimulation.
Multiple sclerosis (MS) is a complex autoimmune disease with multiple risk factors including genetic variants and Vitamin D deficiency (9, 10). Until now, the functional variants of many genome-wide association study (GWAS) loci have not been identified. In addition, the mechanism underlying the interaction between genetic factors and Vitamin D in MS etiology and progression is still unclear. Some MS risk single nucleotide polymorphisms (SNPs) have been found located in Vitamin D Receptor (VDR) binding sites in lymphoblastoid cell lines (LCLs) (11) and conversely, VDR binding sites are also enriched in MS risk regions identified by GWAS (MS risk SNP±100 kb) (12). Furthermore, MS risk SNPs are enriched in classic SE regions of CD4+ T cells and monocytes (3, 7). The risk alleles could
potentially modulate the regulatory effects of these SEs on key genes in specific cell types.
We hypothesize that VDR super-enhancers (VSEs) may be signal inducible SEs relevant to MS development, and that GWAS-identified MS risk loci may influence the function of such VSEs. To assess this, we re-analyzed next-generation sequencing (NGS) data from cell stimulation experiments employing hormones and their nuclear receptors. In particular, we were interested in the 1,25(OH)2D3 (the active form of
Vitamin D) and VDR couple, and its association with MS. Firstly, we analyzed the overlap between VSEs and classic SEs on their genomic regions and closest genes. We classified all VSEs into three patterns (VSE1: only persistent VDR binding; VSE2: both persistent and secondary VDR binding; VSE3: only secondary VDR binding) and analyzed their characteristics. Furthermore, we analyzed the enrichment of MS risk SNPs in VSE regions, and confirmed that VSEs were significantly enriched for MS risk SNPs.
ZMIZ1andEOMEShave been identified as MS risk genes by
cohort studies, and are differentially expressed in whole blood between MS patients and healthy controls (13–15). ZMIZ1 is highly expressed in monocytes andEOMES is predominantly expressed in NK cells.ZMIZ1is known to regulate the activity of various transcription factors. ZMIZ1 and a set of genes with a correlated expression pattern are under-expressed in blood of MS patients (15). We identified two gene clusters in the ZMIZ1-correlated gene set, one with high response to 1,25(OH)2D3and the other with high expression levels in
THP-1 cells, that are potentially affected by VSE2 regions and VSE3 regions, respectively.
Our research shows an association between VDR super-enhancer regions and MS risk for the first time.
MATERIALS AND METHODS
Next Generation Sequencing
Data Selection
We downloaded unstimulated and 1,25(OH)2D3
receptor (i.e., estrogen/ERα and dexamethasone/GR) NGS data (SRA format), from the NCBI Gene Expression Omnibus (GEO) database (Table 1andTable S1). Then FASTQ files were converted from the SRA files with command “fastq-dump.”
ChIP-seq Pipeline
Bowtie2 was used to align FASTQ files to the hg19 reference genome with bowtie2 indexes (“bowtie2 -x -U -S”) (19). We defined peaks with MACS2 (20). For ChIP-seq data from transcription factors VDR and PU.1, we used the command “macs2 callpeak –bw 150 –keep-dup 1 -q 0.01 –B.” For FAIRE-seq, we used a nomodel command “macs2 callpeak –nomodel –shift−75 –extsize 150 –keep-dup 1 -q 0.01 –B.” Potential artifact
signals, based on publicly available blacklists of genomic regions known to have anomalous, unstructured, high signal/read counts in next gen sequencing experiments (21), were removed from the peak sets using “BEDTools intersect” (22).
Identification and Classification of
Super-Enhancers
We distinguished SEs from TEs using ROSE with command setting “-t 2000 -s 12500” (4,23). Firstly, promoter regions [i.e., 2 kb upstream and downstream of the transcription start site (TSS)] with ChIP-seq or FAIRE-seq annotations were excluded. Then enhancer regions identified by the chosen enhancer annotation were stitched together within defined regions of length 12.5 kb to generate signal densities and ranked in order of enhancer density. On a plot of signal density vs. density rank the tangent point is identified by a tangent line with a slope of 1 and divides the enhancers into two types: SEs (with higher density, to the left of the tangent point) and typical enhancers (TEs with lower density, to the right of the tangent point) (3,4,23).
To count the signal density for density correlation analysis, reads were extended by 200 bp and the density of reads per base pair was calculated using bamToGFF (https://github. com/BradnerLab/pipeline), which ROSE integrates internally for identifying SEs (3,23). These densities were normalized in units of reads per million mapped reads per base pair (rpm/bp) with background subtraction for density correlation analysis between different transcription factors. Integrative Genomics Viewer (IGV) was used to visualize genomic signal density (24).
To classify VSE regions, we firstly defined primary (existing only before signal stimulation), persistent (existing both before and after signal stimulation) and secondary (existing only after signal stimulation) VDR binding sites by comparing VDR binding sites before and after 1,25(OH)2D3 stimulation. We
then selected VSEs after signal stimulation that overlap with persistent VDR binding only (classified as VSE1), secondary VDR binding only (classified as VSE3), or both (classified as VSE2). We also selected VSEs before signal stimulation that overlap with persistent VDR binding only (classified as VSE4), primary VDR binding only (classified as VSE6), or both (classified as VSE5). “BEDTools intersect” (22) was used to classify VSE regions by intersecting VSEs with the different types of VDR binding sites.
Assigning a Gene to Its Closest
Super-Enhancer
We assigned all genes with GENCODE hg19 gene/lncRNA annotations to their closest SEs within a 50 kb window using “BEDTools closest” (22). This window size can identify most true enhancer/promoter interactions as reported in previous studies (3, 23, 25, 26). We used the Venny 2.1 online tool (http://bioinfogp.cnb.csic.es/tools/venny/) (27) to generate Venn diagrams of the interactions between gene sets.
MS Risk SNPs
MS risk SNPs were downloaded and merged from both NHGRI GWAS Catalog data (https://www.ebi.ac.uk/gwas/search?query= MULTIPLE%20SCLEROSIS) and the most recent International MS Genetics Consortium (IMSGC) results (BioRxiv: https:// doi.org/10.1101/143933). SNPs in linkage disequilibrium with the list of MS risk tag SNPs were determined from both HapMap3 and the 1000 Genomes Project using r2
> 0.8,
distance limit= 500 kb and population CEU (Center d’Etude du
Polymorphisme Humain–Utah) using the SNP Annotation and Proxy Search (SNAP) tool (https://www.broadinstitute.org/snap/ snap) (28).
Enrichment Analysis in Super-Enhancer
Regions
Enrichment levels of TF binding sites or SNPs in SE regions were analyzed via permutation test using the “region” R package, with z-score as a measure of the strength of the association that is independent of the number of permutations (29). As z-score is defined as the distance between the expected value and the observed one, measured in standard deviations, we use z-score 1.96 as a significance test for two sidedp<0.05. Enquiry
regions (e.g., SNP regions), were normalized by dividing them by the total size of the regions of interest (VSE: 24,014,217 bp, VSE1: 82,635 bp, VSE2: 1,280,936 bp, VSE3: 1,040,646 bp, VDR typical enhancer (VTE): 5,787,494 bp, PU.1 identified SE (PSE): 5,496,182 bp, FAIRE-seq identified SE (FSE): 1,182,725 bp) and reporting them in every 10 Mb of the genome as described in (7). The permutation test for the enrichmentp-value was performed by generating 1,000 permutations of regions of interest (VSE, VTE, PSE, FSE) in the genome (excluding blacklisted regions and the region of interest itself in each permutation) and considering the total size-normalized number (number per 10 Mb) of overlaps between the enquiry region and the region of interest.
For the SNPs enriched in SE regions, we used RegulomeDB to identify DNA features and regulatory elements such as eQTLs, chromatin signatures and transcription factor binding sites overlapping with these SNPs (30). RegulomeDB scores these SNPs according to the strength of their risk evidence. We report only the SNP with the top score in each SE region.
Analysis of Super-Enhancer Region
Characteristics
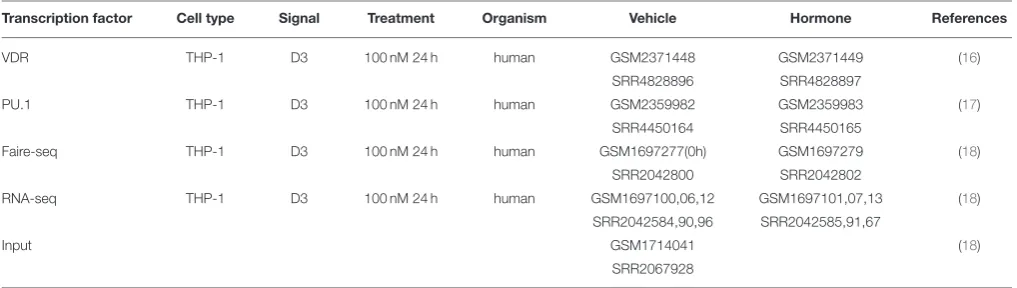
TABLE 1 |Control and 1,25(OH)2D3(D3)-stimulated ChIP-seq, FAIRE-seq, and RNA-seq data in THP-1 cells (VDR_1).
Transcription factor Cell type Signal Treatment Organism Vehicle Hormone References
VDR THP-1 D3 100 nM 24 h human GSM2371448 GSM2371449 (16)
SRR4828896 SRR4828897
PU.1 THP-1 D3 100 nM 24 h human GSM2359982 GSM2359983 (17) SRR4450164 SRR4450165
Faire-seq THP-1 D3 100 nM 24 h human GSM1697277(0h) GSM1697279 (18)
SRR2042800 SRR2042802
RNA-seq THP-1 D3 100 nM 24 h human GSM1697100,06,12 GSM1697101,07,13 (18)
SRR2042584,90,96 SRR2042585,91,67
Input GSM1714041 (18)
SRR2067928
Tool (GREAT version 3.0.0) with the whole genome as background and default parameters (31). Pearson’s product moment correlation coefficient was used to test for association between paired TF binding densities with value log2(rpm/bp)
at the same regions. The “ggpubr” R package (https://CRAN. R-project.org/package=ggpubr) was used to produce correlation plots. Thep-value for correlation was corrected by Bonferroni correction. “BEDTools nuc” (22) was used to count GC content in genomic regions.
RNA-seq Pipeline to Determine Genes
Regulated by 1,25(OH)
2D
3Hisat2 was used to align sequences (three replicates of RNA-seq data) to the hg19 reference genome with Hisat2 indexes (32). The resulting BAM files were sorted by read name, then Htseq was used to count reads on exons in GENCODE hg19 gene annotations with the command “htseq-count -s no -m intersection-nonempty -i gene_name” (33). We only retained genes expressed at a counts-per-million [CPM: calculated using the function cpm from the edgeR library (34) in R]>0.5 in at least
two samples. The function “voom” from the limma R package was used to find differentially expressed genes, and “treat” was used to correct the voom results relative to a false discovery rate of 5%. Genes withp<0.05 and log2(fold change)≥1 were
considered to be significantly regulated.
The “dunn.test” R package (https://CRAN.R-project.org/ package=dunn.test) was used for multiple pairwise comparisons with Bonferroni correction after a Kruskal–Wallis test on the expression level or the regulatory effect between different VDR binding patterns. Violin plots, boxplots, SE curve and transcriptome plots were generated using the “ggplot2” R package (35).
ZMIZ1
Gene Set
To generate the gene set that is positively associated with the expression of MS risk geneZMIZ1in whole blood, we merged the top 200 genes [data from (14,15)] that are positively correlated
with ZMIZ1 expression from each of three cohorts: ANZgene
(microarray) cohort (36), Sydney RNASeq cohort (37), clinically isolated syndrome (CIS) cohort (38).
Gene Set Enrichment Analysis
Analyses focused only on genes under the significant regulation of 1,25(OH)2D3(p<0.05 and log2(fold change)≥1) or with a
high expression level (average log2(expression) >5) ignore the
genes that have a relatively small change or a low expression level, which can nevertheless function in a coordinated way in a set of related genes. Gene set enrichment analysis (GSEA) (39,40) addresses this limitation and was used to find the enrichment distribution of a specific gene set (e.g., VSE gene sets) in a certain pre-defined and pre-ranked gene set (e.g.,ZMIZ1gene set ranked by log2(fold change) or by average log2(expression) from high to
low), which can indicate a cluster of enriched important genes with a relative high change even though their log2(fold change)
<1, or with a high expression level even though their average log2(expression)≤5.
Gene Ontology Analysis on Gene Clusters
Gene ontology (GO) biological process (BP) terms and Kyoto Encyclopedia of Genes and Genomes (KEGG) pathways are used to annotate the function ofZMIZ1-associated VSE gene clusters via “clusterProfiler” R package (41). For GO biological process (BP) analysis, we report the top six significant biological process terms withp<0.05 andq<0.01.
RESULTS
The Difference Between Signal SEs and
Classic SEs
As the VDR is the only receptor and terminal TF for the signal molecule 1,25(OH)2D3(the active form of vitamin D), the
cistrome, especially the SE region, of the active VDR reflects the genomic effect of 1,25(OH)2D3. For this study, we used NGS data
from THP-1 cells (human monocytic cell line derived from an acute monocytic leukemia patient) before and after 1,25(OH)2D3
stimulation (Table 1).
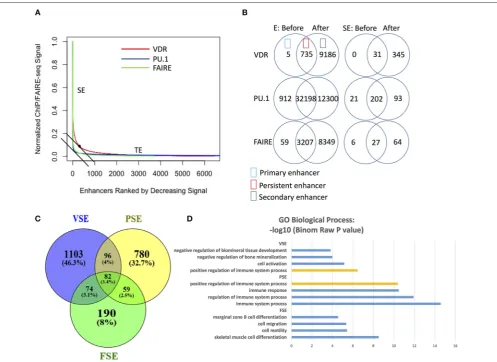
FIGURE 1 |VDR, PU.1, FAIRE identify different SE regions with different genes nearby and gene function enrichment, respectively.(A)The (signal density)/(density rank) curve for SE calling from VDR, PU.1 and FARIE.(B)The number of enhancers (E) and super-enhancers (SE) before and after 1,25(OH)2D3stimulation.(C)The Venn overlap figure for the gene list near VSE, PSE and FSE in 50 kb regions. VSE, VDR SE; PSE, PU.1 SE; FSE, FAIRE SE.(D)The enrichment analysis of GO biological process gene set for VSE, PSE and FSE; orange bar: the shared process between VSE and PSE (GEO data shown inTable 1).
regions), we called SE regions using data from VDR ChIP-seq, PU.1 ChIP-seq (master TF binding regions), and FAIRE-seq (chromatin open regions) (Supplementary File 1). We found that both PU.1 and FAIRE-seq provided a much clearer distinction between SEs and TEs on the density curve than VDR did (Figure 1A). VDR binding regions achieved higher signal densities and were identified as SE regions at lower ranks (higher rank numbers) (Figure 1A) compared to PU.1-identified SEs (PSEs) and FAIRE-seq-identified SEs (FSEs). As well as higher signal density, the number of VDR enhancers also increased strongly after 1,25(OH)2D3 stimulation (Figure 1B). Although
the numbers of enhancers identified by PU.1 ChIP-seq and FAIRE-seq also increased greatly after stimulation, the numbers of their SEs increased much less than the number of VSEs (Figure 1B). These results reflect the higher sensitivity of signal SE formation in response to signal stimulation compared with that of classic SE formation.
The VSE gene set (the closest genes within 50 kb around VSEs) shares only minor overlap with the PSE and FSE gene sets
(Figure 1C). Gene ontology (GO) analysis on super-enhancer
regions consistently shows that VSE, PSE, and FSE have different functional gene enrichment, except that the “positive regulation of immune system process” gene set is enriched in both VSE
(Supplementary File 1 and Figure 1D) and PSE (Figure 1D).
From the GO analysis (Figure 1D), only PSE genes are all enriched in immune associated processes. FSE genes are more often related to other functions, such as “cell mobility” and “cell migration,” and VSE genes are more clearly associated with “cell activation” and “bone mineralization” (Figure 1D).
Classification of VDR Super-Enhancers
As classic SEs appear to play a minor role in genomic responses to signal given their small increase in numbers after signal stimulation, VSEs should potentially play a greater role in 1,25(OH)2D3stimulated THP-1 cells. By analyzing the data from
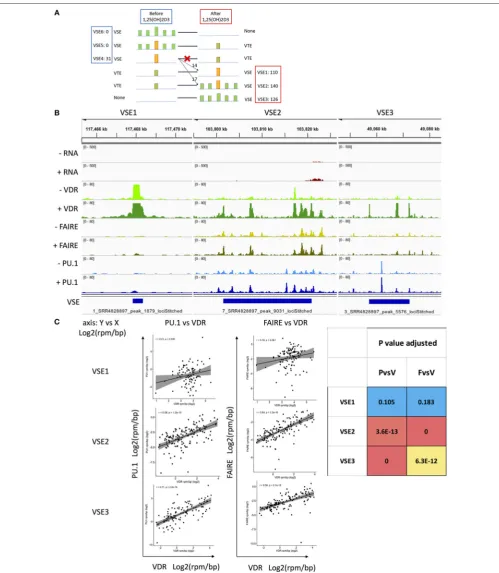
FIGURE 2 |The classification of VSEs and their association with the region and density of PU.1 and FAIRE.(A)Classification hypothesis: six types of VSE pattern. VSE4–6 exist without 1,25(OH)2D3treatment. VSE1–3 are gained after 1,25(OH)2D3treatment. VTE, VDR typical enhancer; VSE, VDR SE; PSE, PU.1 SE; FSE, FAIRE SE; yellow bar, high read density in narrow region identified as SE; read density of bar, yellow>green; blue line, genomic region; The colon of VSE1–6 followed by the
TABLE 2 |The number of signal SE 1–3 for different signals and in different cell types.
Cell type THP-1 THP-1 MCF-7 MCF-7 RS4;11 BMDM*
Corresponding data (Table 1
andTable S1)
VDR_1 VDR_2 ER_1 ER_2 GR_1 GR_2
Signal stimulation D3 D3 E2 E2 dex dex; LPS
Transcription factor VDR VDR ERα ERα GR GR
Treatment 100 nM 24 h 10 nM 40 min 100 nM 1 h 100 nM 45 min 10 nM 1 h 100 nM 45 min; 10 ng/ml 45 min
After stimulation SE1 110 41 17 43 0 1
SE2 140 6 151 639 0 4
SE3 126 19 21 0 623 67
D3, 1,25(OH)2D3; E2, estradiol; dex, dexamethasone; LPS, lipopolysaccharides. *Using mm10 reference genome.
Bold values: the number of the major SE type.
VSE3,n= 110), and an even greater number with both persistent and secondary binding (classified as VSE2,n= 140) (Figure 2A
andSupplementary File 1).
In undertaking these analyses, we assumed that all six potential patterns of VSE were possible (i.e., primary binding, secondary binding or both, before and after 1,25(OH)2D3
stimulation). Three patterns (VSE4–6) lose their VSE status after treatment and three patterns (VSE1–3) gain VSE status after treatment (Figure 2A). However, we found no evidence for VSE5 or VSE6 existing, and none of the 31 VSE4 regions degenerated into typical enhancers after stimulation. Of the VSE4 regions, 14 were persistent as VSE1 after stimulation, and 17 VSE4 regions initiated secondary VDR binding around them reclassifying as VSE2 after stimulation (Figure 2A). We therefore classify the signal SEs after stimulation into three types: VSE1, VSE2, and VSE3 (Figures 2A,B). Among them, the densities of PU.1/FAIRE-seq and VDR are correlated with each other in VSE2 and VSE3 regions, while the densities of VDR in VSE1 are too high to be correlated with either PU.1 binding density or FAIRE-seq density (Figure 2C).
A previous study found that persistent VDR binding sites have more canonical motif enrichment. Further, different combinations of persistent and transient VDR binding sites in topologically associating domains (TADs) regulate different biological processes (16). Another previous study found that the persistent signal enhancer (ERαbinding) initiates the whole signal SE (ERα SE) region by promoting the activation of secondary enhancers (ERα binding) around it after estrogen stimulation, which is the same pattern seen for VSE2 in our study (Figure 2A) (8). To explore the reason the previous study on ERαSEs did not find ERαSE1 and SE3 patterns, but only SE2 (i.e., persistent ERαbinding initiates a long ERαSE region), we analyzed ChIP-seq data for two other nuclear receptors (ERαand glucocorticoid receptor) in other cell types. We found that the different signals have different distributions of their signal SE1– 3s (Table 2, data set shown inTable S1) (42–46), confirming the signal specificity for the proportions of signal SE1–3 patterns. The major pattern of ERαSEs is SE2 with only a few SE1 and SE3, which explains why previous reports only provides one model
for signal SEs (i.e., only the SE2 pattern) (8). For dexamethasone stimulation, the major pattern of glucocorticoid receptor (GR) SEs is GR SE3 with a few SE1 and SE2 in either human B cell type (RS4;11) or mouse macrophage (BMDM).
The Regulatory Effects of VSEs on the
Expression of MS Associated Genes
To explore the regulatory effect of VSEs on MS gene expression, we investigated all 202 genes that are significantly regulated by 1,25(OH)2D3 stimulation [with p < 0.05 and log2(fold
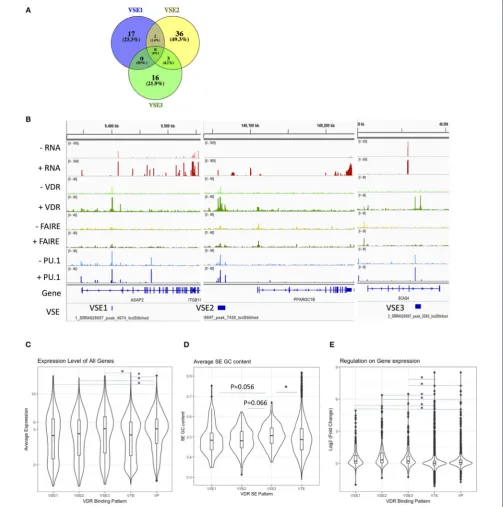
change) ≥1] (data set shown in Table 1). The VSE regions account for 73 of the 202 differentially expressed genes and there is little overlap between the gene sets regulated by the three classes of VSEs (Figure 3A). All 73 VSE-regulated genes are shown inFigure S1, with representative genes shown inFigure 3B.
As the high level of average expression [i.e., average log2(expression) >5] indicates a basic high chromatin
accessibility, we tested the average expression level of VSE1–3 gene sets. We found that genes with VDR binding in the promoter region have higher average expression levels than all other VDR binding patterns except VSE3 (Figure 3C). Both the gene sets of VSE3 and VDR promoter binding, but not VSE1 and VSE2, have a higher average expression level than the VDR TE gene set (Figure 3C). Consistently, we found that among VSE1–3, only VSE3 has a significantly higher GC content than VDR TE, and it has a modestly, although not significantly, higher GC content than VSE1 and VSE2 (Figure 3D), suggesting a more active regulatory conformation and more frequent TF binding (BioRxiv: http://dx.doi.org/10.1101/105262).
However, high expression does not mean a stronger regulatory effect. We found that all VSE1–3 regions have a significantly stronger regulatory effect on gene expression than VDR promoter binding (Figure 3E). VDR promoter binding in turn has a significantly stronger regulatory effect than VDR TE (Figure 3E).
FIGURE 3 |The regulatory effects of VSE1–3 on gene expression.(A)The overlap between VSE1–3 close genes.(B)The visualization of signal density in
representative VSE1–3 regions.(C)Average expression level of genes close to different regulatory patterns.(D)The GC content of VSE and VTE.(E)Regulatory effect of different regulatory patterns on gene expressions. VSE, VDR SE; VTE, VDR typical enhancer; VP, VDR promoter binding. To analyse statistical significance, we used a Kruskal–Wallis test followed by Bonferroni correction *p<0.05.
the expression levels of genes in these regions in response to 1,25(OH)2D3exposure in THP-1 cells (Table 3andFigure S2).
Among them, genes DENND6B, USP2, ASAP2, SEMA6B, and LRG1 not only have VSE regions and are near MS risk
SNPs, but also are significantly regulated by 1,25(OH)2D3 and
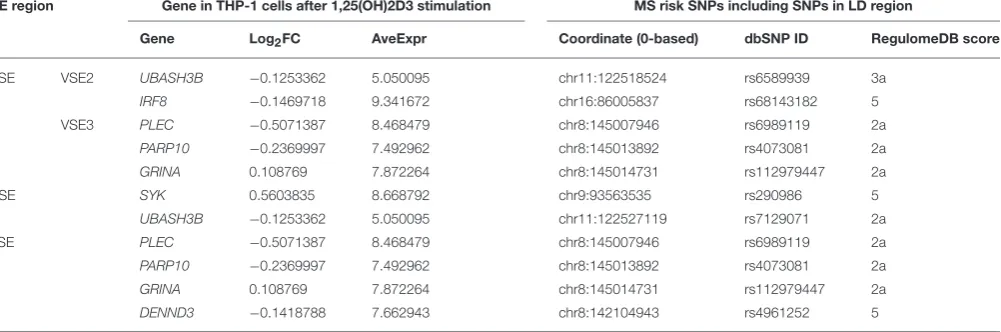
TABLE 3 |The genes with VSEs that are associated with MS risk SNPs.
Genes with VSE that within 500 kb of MS risk SNPs
Genes under significant regulation (Log2FC>1 andp<0.05)
Genes with high expression level (Log2AverExp>5)
Both of above
with VSE1 DENND6B PDCD1LG2 USP2 ASAP2 USP2-AS1 AC080112.2
DENND6B USP2 ASAP2 AIG1 VPS37B PLXNB2 RNF26 YPEL3 ALDOA PPP4C RARA PPP6R2 ZC3HAV1 TOP2A
DENND6B USP2 ASAP2
with VSE2 IGLV7-46 SEMA6B NR1I2 LRG1 SEMA6B LRG1 MYO9B CYTH4 BCL9L ELL MUC1 LCP2 CLCN7 TOP1 TELO2 ZMIZ1 COLGALT1 SLC27A1 RAC2 NR2F6 GSE1 PGLS SLC50A1 FKBP8 IRF8 UBASH3B DPM3 GBA GSK3B UBAC2 THBS3
SEMA6B LRG1
with VSE3 LINC00917 AC023590.1 LRRC25 ELL CUEDC1 IRF5 SLC45A4 RAB3D MRPS7 PLEC RAB44 PLPPR2 CLSTN1 PARP10 MRPS23 SLC25A19 GGA3 GRINA GRB2 TNPO3 PGPEP1 SSBP4 MIF4GD IKZF1
null
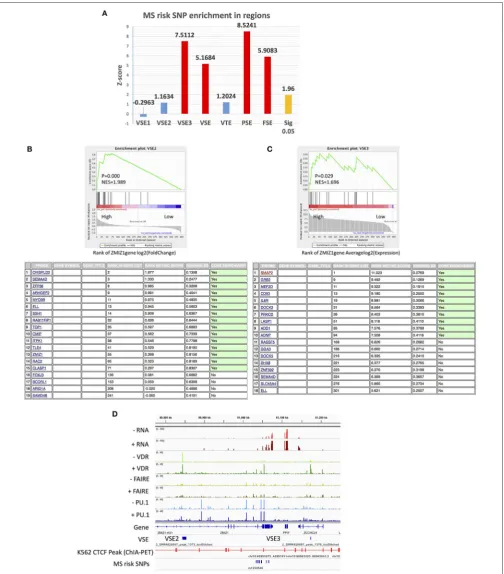
MS Risk SNPs Are Enriched in VSE
Regions of THP-1 Cells After 1,25(OH)
2D
3Stimulation
The known MS risk SNPs have previously been found to be enriched in classic SE regions (identified by H3K27ac) of monocytes (3,7). Therefore, we aimed to determine if MS risk SNPs are enriched in VSEs, as causal SNPs in these regions may have the potential to modulate the Vitamin D responsiveness of MS risk genes.
Firstly, we analyzed the enrichment of known MS risk SNPs in both classic SE (identified by PU.1 peaks or FAIRE-seq peaks) and signal SE (VSE) regions after stimulation with 1,25(OH)2D3.
We found that VSE regions are also enriched for MS risk SNPs with MS risk SNPs located in two VSE2 regions and two VSE3 regions (Figure 4AandFigures S3A–C). Interestingly, the genes near the VSEs (i.e.,UBASH3B,IRF8,PLEC,PARP10,GRINA) all show stable high expression levels with only modest regulation by stimulation (Table 4andFigures S3B,C). For genes with a stable and high expression level, even modest changes in expression may lead to biological effects, such as the modest regulation of
MYCandZMIZ1by VDR (15,47). Therefore, MS risk SNPs in
VSE regions may affect the function of VSEs that maintain the high and stable expression of key genes rather than inducing significantly higher expression.
Furthermore, almost all the risk SNPs located in SE regions (40 of 45 SNPs in VSE, 70 of 85 SNPs in PSE, 33 of 33 SNPs in FSE) have RegulomeDB scores providing at least some evidence for a functional role such as being an eQTL, having transcription factor (TF) binding, a matched TF motif or DNase I hypersensitivity. We list the SNPs with the top RegulomeDB score for each SE gene inTable 4. Interestingly, among VSE1–3, only VSE3 is enriched for MS risk SNPs (Figure 4A), which is consistent with its higher GC content and high expression level.
The MS Risk
ZMIZ1
Gene Set With VDR
Super-Enhancers
Booth and colleagues used cohorts to find MS risk genes that are expressed differently in whole blood between MS patients
and healthy controls, and they found thatZMIZ1and EOMES are the most significant two, and that this result can be repeated in other cohorts (13,15). TheZMIZ1gene is highly expressed in myeloid cells including THP-1 monocytes and is considered a risk gene for MS. The ZMIZ1 gene set (defined as genes whose expression is positively correlated with that ofZMIZ1; see methods) is under-expressed in the blood of MS patients and has been proposed as a gene signature for MS (15). Importantly,
ZMIZ1 is also Vitamin D-responsive. Therefore, we tested
the association between VSEs and ZMIZ1 gene set in THP-1 cells. TheZMIZ1gene set was downloaded from the file of a publication by Fewings et al. (14,15), consisting of the top 200 genes positively correlated withZMIZ1expression from each of three cohorts (Supplementary File 1).
By GSEA enrichment analysis, a cluster of genes with VSE2 regions (ZMIZ1gene cluster 1) from theZMIZ1gene set were found to be enriched in genes that show a substantial change after 1,25(OH)2D3 stimulation (“High” region by log2(fold change)
inZMIZ1gene set, Figure 4B). Under the same experimental
conditions, a cluster of genes with VSE3 regions (ZMIZ1gene cluster 2) from the ZMIZ1 gene set is enriched in genes that show a high expression level (“High” region by average log2(expression) inZMIZ1gene set,Figure 4C).
Furthermore,ZMIZ1itself also contains a VSE2 and is near a VSE3 region (Figure 4D). Although the VSE2 and VSE3 around
ZMIZ1do not overlap with MS risk SNPs, they may be connected
with SNPs via loops shown by CTCF ChIA-PET data in K562 cells from the ENCODE database (Figure 4D). In addition, among
theZMIZ1gene set,TOP1has a VSE2 and is under significant
regulation by 1,25(OH)2D3. It is near (298.8 kb from) a MS
risk SNP rs6065333 (Figure S4A).GRB2andDOCK2have VSE3 regions and high expression levels. They are overlapped with and near (440 kb from) MS risk SNPs rs9900529 and rs11957313, respectively (Figures S4B,C).
FIGURE 4 |The association of MS risk SNPs andZMIZ1gene set with VSE.(A)MS risk SNP enrichment in different SE regions.(B)VSE2-regulated genes are enriched inZMIZ1positively associated genes with higher log2(fold change) (above); The names of these enriched VSE2-regulated genes (below).(C)VSE3-regulated genes are enriched inZMIZ1positively associated genes with higher average log2(expression) (above); The names of these enriched VSE3-regulated genes (below).
TABLE 4 |The gene near SE regions that overlap with MS risk SNPs.
SE region Gene in THP-1 cells after 1,25(OH)2D3 stimulation MS risk SNPs including SNPs in LD region
Gene Log2FC AveExpr Coordinate (0-based) dbSNP ID RegulomeDB score
VSE VSE2 UBASH3B −0.1253362 5.050095 chr11:122518524 rs6589939 3a
IRF8 −0.1469718 9.341672 chr16:86005837 rs68143182 5 VSE3 PLEC −0.5071387 8.468479 chr8:145007946 rs6989119 2a
PARP10 −0.2369997 7.492962 chr8:145013892 rs4073081 2a
GRINA 0.108769 7.872264 chr8:145014731 rs112979447 2a
PSE SYK 0.5603835 8.668792 chr9:93563535 rs290986 5
UBASH3B −0.1253362 5.050095 chr11:122527119 rs7129071 2a
FSE PLEC −0.5071387 8.468479 chr8:145007946 rs6989119 2a
PARP10 −0.2369997 7.492962 chr8:145013892 rs4073081 2a
GRINA 0.108769 7.872264 chr8:145014731 rs112979447 2a
DENND3 −0.1418788 7.662943 chr8:142104943 rs4961252 5
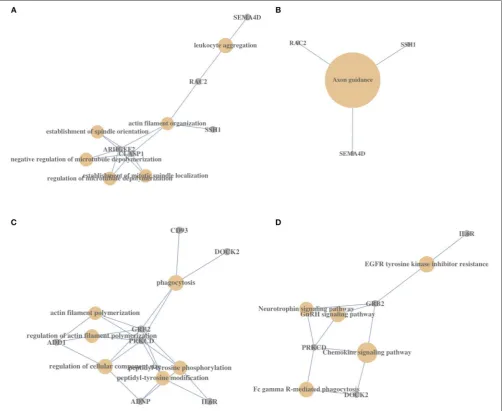
of the top six biological process terms. These enriched genes relate mainly to the functions of microtubule, spindle, and actin filament (Figure 5A). Among these biological process terms, the enrichment of “leukocyte aggregation” for genes SEMA4Dand RAC2 had the most significant p-value (p = 3.45 × 10⁻⁵).
After KEGG pathway analysis, we foundSEMA4D, RAC2 and SSH1are also significantly (p= 4.13×10⁻⁴) enriched in “axon
guidance” pathway (Figure 5B). These genes and their enriched terms/pathways are potentially under the regulation of Vitamin D via VSE2 regions and their impact on MS pathology has not yet been tested.
For ZMIZ1 gene cluster 2, we found that the PRKCD and
GRB2 genes were included in all of the top six enriched biological process terms, which related mainly to the functions of actin filament, peptidyl-tyrosine, cellular component size and phagocytosis (Figure 5C). The enrichment of “phagocytosis” for genesPRKCD,GRB2,CD93,andDOCK2has the most significant p-value (p = 1.79 × 10⁻⁵). After KEGG pathway analysis,
the enrichment ofPRKCD,GRB2,andDOCK2 in “chemokine signaling pathway” showed the most significance (p= 3.01×
10−4) (Figure 5D). As mentioned above, the genes GRB2 and
DOCK2 are also within the± 500 kb region of MS risk SNPs
(Figures S4B,C), and VSE regions around IL6R, PRKCD and
GRB2are also enriched in the GO term: “positive regulation of immune system process” (Figure 1DandSupplementary File 1). These genes with a relative high expression level and their enriched terms/pathways are potentially under the regulation of Vitamin D via VSE3 regions and could be involved in the etiology of MS.
DISCUSSION
Much research has occurred around classic SE regions, but alterations of signal-induced SEs before and after stimulation have not been well explored. In addition, the relationship between many complex disease risk variants and environmental signal SEs have not been explored, including the interaction between Vitamin D induced VDR super-enhancers and MS risk SNPs in
the etiology of MS. In this study, we used publicly available data (Table 1and Table S1) to explore the features of VSE patterns and their regulatory effects on gene expression usingin silico methods, in order to interrogate the role of the environmental factor Vitamin D on MS. Additionalin vitroorin vivoevidence will be required to confirm the links between VSEs and MS risk proposed here.
We particularly focused on the role of 1,25(OH)2D3-induced
SEs describing the distinct regions of VSEs compared with those of PSEs and FSEs (Figure 1), and then classified VSEs into three patterns: VSE1–3 (Figures 2A,B). VSE1–3 have different characteristics including their association with the densities of PU.1 binding and FAIRE-seq, the gene sets they regulate, GC content, and gene expression level (Figures 2C, 3A,C–E). We identified the genes with VSE1–3 regions that are also under significant regulation of 1,25(OH)2D3 (Figures 3A,B
and Figure S1). We also showed that MS risk SNPs are
enriched in VSE regions, especially the VSE3 pattern of VDR binding (Figure 4A and Figure S3A). This suggests that the potential causal genes in the regions defined by SNP association could be the ones that have VSE regions (Tables 3, 4 and
Figures S2, S3B,C). Moreover, we found that two clusters
of genes with VSE2 or VSE3 patterns are enriched in the significantly regulated genes or highly expressed genes of the
ZMIZ1gene set (Figures 4B,C and Figure S4). The genes we
identified in this study may be key points in the interaction between the environmental factor Vitamin D and genetic risk variants for the etiology and process of MS, and need further exploration with specific experiments designed to assess the role of the genetic variation in modulating Vitamin D regulated gene expression.
FIGURE 5 |The biological process and signal pathway enrichment ofZMIZ1-associated gene clusters.(A)The GO BP terms enrichment forZMIZ1gene cluster 1.
(B)The KEGG signal pathway enrichment forZMIZ1gene cluster 1.(C)The GO BP terms enrichment for ZMIZ1 gene cluster 2.(D)The KEGG signal pathway enrichment for ZMIZ1 gene cluster 2. Size of circle reflects the relative significance ofp-value in each figure.
10.1101/105262), the SEs formed by TGF-βsignal terminal TF SMAD3 overlap a high proportion of the SEs formed by MED1 in mESC (73%) or in pro-B cells (64%). The research suggests that classic (MED1) SEs can provide a platform for signaling terminal TFs (SMAD3) to bind with a SE dense assembly, although there are still a large proportion (∼60%) of SMAD3
SEs outside MED1 SE regions. Therefore, we hypothesize that the signal SE and classic SE regions do not overlap by a large proportion and are responsible for regulating different functional genes as reported here for VDR and PU.1 in THP-1 monocytes. However, if an external signal is important for cell differentiation and identity, its terminal TF signal SE will overlap the majority of classic SEs, in order to affect the expression of cell identity genes in response to the signal, as seen with SMAD3 and MED1 in mESCs.
(16). As one TAD may include multiple SE regions with different generation mechanisms, here we focused on the SE regions [potential sub-TAD regions (51)] and only analyzed their combination of persistent and secondary signal TF binding.
We classified VSEs into three patterns based on the pattern of persistent or secondary VDR binding following stimulation with 1,25(OH)2D3. While VSE2 and VSE3 patterns are correlated with
the signal density of PU.1 and FAIRE-seq peaks, VSE1 regions are not. All three VSE patterns have significantly higher regulatory effect on gene expression compared with VDR promoters and VDR typical enhancers, but VSE3 has the highest level of gene expression compared with other VDR binding regions.
Interestingly, we find that the ratio between the number of VSE1–3 regions is signal-specific, i.e., different signals (e.g., Vitamin D, estrogen, or glucocorticoid) have different ratios between the numbers of their signal SE1–3 (Table 2), potentially corresponding to the different genomic functions (e.g., pioneer TF, master TF, or just signal TF) of their terminal TFs (e.g., VDR, ERα, GR). The persistent VDR binding regions are ligand-insensitive, and exist before signal stimulation. The effects of VSE1 and VSE2 on gene expression after signal stimulation reflect a transcriptional memory, which is similar to the control of ligand-insensitive nuclear receptor PPARγon the processive macrophage polarization (52).
By connecting gene expression levels with VSE regions and MS risk SNPs, we identified five significant VSE-regulated MS risk genes: DENND6B, USP2, ASAP2, SEMA6B, and LRG1. Among them, DENND6B is highly expressed in the brain (53), and its protein interacts directly with Rab GTPases involved in vesicle trafficking and cytokine production during the process of neuroinflammation (54, 55). USP2, a de-ubiquitinating enzyme, can regulate lipoprotein clearance by promoting deubiquitinylation and preventing the degradation of low-density lipoprotein receptor in HEK293T cells (56). In HL-60 macrophages, USP2 can regulate LPS-induced production of pro-inflammatory cytokines by reducing the polyubiquitination of octamer-binding transcription factor (Oct)-1 (57). ASAP2 can modulate Fc gamma receptor-mediated phagocytosis and cell migration, which are potentially associated with efferocytosis-mediated inflammation resolution and monocyte migration via the blood-brain barrier (58, 59). SEMA6B is associated with the signal pathway of “axon guidance” that is involved in both peripheral and central nervous system development, the disorder of which potentially impacts the pathology of MS. In particular, some semaphorins, as immune modulators, such as SEMA4D, are involved in the immune response by regulating immune cell–cell contacts and cell migration (60). In this study, we show that these MS risk genes are all highly expressed and significantly regulated by 1,25(OH)2D3in THP-1 monocytes.
We also identified another five important MS risk genes with VSEs overlapping with MS risk SNPs: UBASH3B, IRF8,
PLEC, PARP10, and GRINA. These genes are only modestly
regulated by 1,25(OH)2D3. However, modest regulation cannot
rule out their importance, especially when the genes have a key biological function. Among them, UBASH3B has a protein
tyrosine phosphatase activity, which involves in the down-regulation and degradation of receptor-type tyrosine kinases, and promotes the accumulation of T cell receptors (61–63). The MS risk geneIRF8codes for an important transcription factor that is associated with chronic inflammation and binds the upstream regulatory region of type I IFN and IFN-inducible MHC class I genes (64). MS risk SNP rs35929052 that is associated with conversion to MS and disease relapse is close to IRF8 (65). The expression of PLEC is changed by approximately 1.5-fold after 1,25(OH)2D3 stimulation in THP-1 monocytes. The
related pathway of PLEC is “cytoskeletal signaling,” which is also associated with cell migration and phagocytosis (www.genecards. org) (66).
Finally, for analyzing the potential function of ZMIZ1 -associated genes, GO ontology and KEGG pathway analysis were used. ARHGEF2, RAC2, SEMA4D, PRKCD, GRB2, and
DOCK2 were repeatedly enriched in important GO BP terms
or KEGG pathways, such as “axon guidance,” “phagocytosis,” and “chemokine signaling,” which are all associated with the pathology of MS and MS process. Importantly, these genes are all Vitamin D-regulated and MS-associated.
Since VSE2 regions are formed based on pre-existing VDR binding sites, the cell functions enriched forZMIZ1gene cluster 1, such as “leukocyte aggregation,” “actin filament organization,” and “axon guidance,” are potentially predetermined to be regulated by 1,25(OH)2D3 through forming VSE2 regions after
stimulation. Therefore, VSE2 formation will increase the basal low-level expression ofZMIZ1gene cluster 1 and promote its associated functions after 1,25(OH)2D3stimulation.
Because VSE3s are more active regulatory regions with the highest GC content, and the genes with VSE3 regions have the highest expression levels, it is not surprising thatZMIZ1cluster 2 genes with VSE3 regions are enriched in highly expressed genes. The cell functions enriched for ZMIZ1 gene cluster 2, such as “phagocytosis” and “chemokine signaling,” are potentially constitutively active in THP-1 monocytes. VSE3 formation will sustain the basal high-level expression ofZMIZ1gene cluster 2 and reinforce its functions after 1,25(OH)2D3stimulation.
In summary, our results support the importance of signal-induced nuclear receptor SEs in the signal stimulation process, and detail the characteristics of signal SEs by classifying 1,25(OH)2D3-induced vitamin D receptor SE regions into three
patterns. Importantly, we connect MS risk SNPs with Vitamin D downstream VSE regions for the first time.
MS risk genes in monocytes were predicted, whose normal functions may be disturbed by MS risk alleles around the VSE regions. These genes that are associated with both VSE and MS risk regions warrant further analysis to elucidate the mechanisms involved.
DATA AVAILABILITY
Publicly available datasets were analyzed in this study. This data can be found here: https://www. ncbi.nlm.nih.gov/geo/query/acc.cgi?acc=GSE89431 (and GSE89178/GSE69303/GSE27437/GSE60270/GSE25021/GSE7161 6/GSE109131).
AUTHOR CONTRIBUTIONS
ML: designed the study, acquired data, analyzed data, and wrote the manuscript. BJM, KPB, BVT and HK: edit the manuscript. ML and HK: conception of the project.
ACKNOWLEDGMENTS
This work was supported by grants from the Royal Hobart Research Foundation (to BVT) and MS Research Australia (to
BVT and HK). ML was supported by a UTAS/AMU international postgraduate scholarship.
SUPPLEMENTARY MATERIAL
The Supplementary Material for this article can be found online at: https://www.frontiersin.org/articles/10.3389/fimmu. 2019.00488/full#supplementary-material
Figure S1 |The genes that are significantly regulated by VSE1–3. The genes that are significantly regulated in the genome-wide MDplot from RNA-seq data. Blue words: long non-coding RNA(Left). The genes that are significantly regulated in the VSE finding curve(Right).
Figure S2 |The representative genomic regions of the genes with VSEs that are associated with MS risk SNPs (bold inTable 3).(A)DENND6B.(B)USP2.(C) ASAP2.(D)LRG1andSEMA6B.
Figure S3 |The association between MS risk SNP and VSE1-3 region.(A)MS risk SNPs enrichment in different SE regions. The permutation figure showed the
α= 0.05 expected values (red line) from 1,000 permutations and observed values (green line).(B)The genomic regions of the genes with VSEs that are overlapped with MS risk SNPs.(C)The genomic regions of the genes with PSE or FSE that are overlapped with MS risk SNPs. VSE, VDR SE; PSE, PU.1 SE;
FSE, FAIRE SE.
Figure S4 |The representative genomic regions of theZMIZ1-associated genes with VSEs that are near MS risk SNPs.(A)TOP1.(B)GRB2.(C)DOCK2.
Table S1 |Control and hormone-stimulated ChIP-seq data.
REFERENCES
1. Maston GA, Evans SK, Green MR. Transcriptional regulatory elements in the human genome.Annu Rev Genomics Hum Genet.(2006) 7:29–59. doi: 10.1146/annurev.genom.7.080505.115623
2. Kulaeva OI, Nizovtseva EV, Polikanov YS, Ulianov SV, Studitsky VM. Distant activation of transcription: mechanisms of enhancer action.Mol Cell Biol.
(2012) 32:4892–7. doi: 10.1128/MCB.01127-12
3. Hnisz D, Abraham BJ, Lee TI, Lau A, Saint-Andre V, Sigova AA, et al. Super-enhancers in the control of cell identity and disease.Cell.(2013) 155:934–47. doi: 10.1016/j.cell.2013.09.053
4. Loven J, Hoke HA, Lin CY, Lau A, Orlando DA, Vakoc CR, et al. Selective inhibition of tumor oncogenes by disruption of super-enhancers.Cell.(2013) 153:320–34. doi: 10.1016/j.cell.2013.03.036
5. Chipumuro E, Marco E, Christensen CL, Kwiatkowski N, Zhang T, Hatheway CM, et al. CDK7 inhibition suppresses super-enhancer-linked oncogenic transcription in MYCN-driven cancer.Cell.(2014) 159:1126–39. doi: 10.1016/j.cell.2014.10.024
6. Peeters JG, Vervoort SJ, Tan SC, Mijnheer G, De Roock S, Vastert SJ, et al. Inhibition of super-enhancer activity in autoinflammatory site-derived T cells reduces disease-associated gene expression.Cell Rep.(2015) 12:1986–96. doi: 10.1016/j.celrep.2015.08.046
7. Vahedi G, Kanno Y, Furumoto Y, Jiang K, Parker SC, Erdos MR, et al. Super-enhancers delineate disease-associated regulatory nodes in T cells.Nature.
(2015) 520:558–62. doi: 10.1038/nature14154
8. Bojcsuk D, Nagy G, Balint BL. Inducible super-enhancers are organized based on canonical signal-specific transcription factor binding elements.Nucleic Acids Res.(2017) 45:3693–706. doi: 10.1093/nar/gkw1283
9. De Rosbo NK, Ben-Nun A. T-cell responses to myelin antigens in multiple sclerosis; relevance of the predominant autoimmune reactivity to myelin oligodendrocyte glycoprotein.J Autoimmun.(1998) 11:287–99. doi: 10.1006/jaut.1998.0202
10. Sospedra M, Martin R. Immunology of multiple sclerosis.Annu Rev Immunol.
(2005) 23:683–747. doi: 10.1146/annurev.immunol.23.021704.115707 11. Ramagopalan SV, Heger A, Berlanga AJ, Maugeri NJ, Lincoln MR, Burrell A,
et al. A ChIP-seq defined genome-wide map of vitamin D receptor binding:
associations with disease and evolution. Genome Res.(2010) 20:1352–60. doi: 10.1101/gr.107920.110
12. Disanto G, Sandve GK, Berlanga-Taylor AJ, Ragnedda G, Morahan JM, Watson CT, et al. Vitamin D receptor binding, chromatin states and association with multiple sclerosis. Hum Mol Genet. (2012) 21:3575–86. doi: 10.1093/hmg/dds189
13. Mckay FC, Gatt PN, Fewings N, Parnell GP, Schibeci SD, Basuki MA, et al. The low EOMES/TBX21 molecular phenotype in multiple sclerosis reflects CD56+cell dysregulation and is affected by immunomodulatory therapies. Clin Immunol. (2016) 163:96–107. doi: 10.1016/j.clim.2015. 12.015
14. Fewings N, Gatt PN, Mckay FC, Parnell GP, Schibeci SD, Edwards J, et al. Data characterizing the ZMIZ1 molecular phenotype of multiple sclerosis.Data Brief.(2017) 11:364–70. doi: 10.1016/j.dib.2017.02.040
15. Fewings NL, Gatt PN, Mckay FC, Parnell GP, Schibeci SD, Edwards J, et al. The autoimmune risk gene ZMIZ1 is a vitamin D responsive marker of a molecular phenotype of multiple sclerosis.J Autoimmun.(2017) 78:57–69. doi: 10.1016/j.jaut.2016.12.006
16. Neme A, Seuter S, Carlberg C. Selective regulation of biological processes by vitamin D based on the spatio-temporal cistrome of its receptor. Biochim Biophys Acta Gene Regul Mech. (2017) 1860:952–61. doi: 10.1016/j.bbagrm.2017.07.002
17. Seuter S, Neme A, Carlberg C. Epigenomic, P. U.1-VDR crosstalk modulates vitamin D signaling.Biochim Biophys Acta Gene Regul Mech.(2017) 1860:405– 15. doi: 10.1016/j.bbagrm.2017.02.005
18. Seuter S, Neme A, Carlberg C. Epigenome-wide effects of vitamin D and their impact on the transcriptome of human monocytes involve CTCF.Nucleic Acids Res.(2016) 44:4090–104. doi: 10.1093/nar/gkv1519
19. Langmead B, Salzberg SL. Fast gapped-read alignment with Bowtie 2.Nat Methods.(2012) 9:357–9. doi: 10.1038/nmeth.1923
20. Zhang Y, Liu T, Meyer CA, Eeckhoute J, Johnson DS, Bernstein BE, et al. Model-based analysis of ChIP-Seq (MACS). Genome Biol.(2008) 9:R137. doi: 10.1186/gb-2008-9-9-r137
22. Quinlan AR, Hall IM. BEDTools: a flexible suite of utilities for comparing genomic features. Bioinformatics. (2010) 26:841–2. doi: 10.1093/bioinformatics/btq033
23. Whyte WA, Orlando DA, Hnisz D, Abraham BJ, Lin CY, Kagey MH, et al. Master transcription factors and mediator establish super-enhancers at key cell identity genes.Cell.(2013) 153:307–19. doi: 10.1016/j.cell.2013.03.035 24. Thorvaldsdottir H, Robinson JT, Mesirov JP. Integrative Genomics Viewer
(IGV): high-performance genomics data visualization and exploration.Brief Bioinform.(2013) 14:178–92. doi: 10.1093/bib/bbs017
25. Chepelev I, Wei G, Wangsa D, Tang Q, Zhao K. Characterization of genome-wide enhancer-promoter interactions reveals co-expression of interacting genes and modes of higher order chromatin organization.Cell Res.(2012) 22:490–503. doi: 10.1038/cr.2012.15
26. Dixon JR, Selvaraj S, Yue F, Kim A, Li Y, Shen Y, et al. Topological domains in mammalian genomes identified by analysis of chromatin interactions.Nature.
(2012) 485:376–80. doi: 10.1038/nature11082
27. Oliveros JC. (2015).“VENNY. An Interactive ToolforComparing Lists With
Venn Diagrams.2007”.
28. Johnson AD, Handsaker RE, Pulit SL, Nizzari MM, O’donnell CJ, De Bakker PI. SNAP: a web-based tool for identification and annotation of proxy SNPs using HapMap. Bioinformatics. (2008) 24:2938–9. doi: 10.1093/bioinformatics/btn564
29. Gel B, Diez-Villanueva A, Serra E, Buschbeck M, Peinado MA, Malinverni R. regioneR: an R/Bioconductor package for the association analysis of genomic regions based on permutation tests.Bioinformatics.(2016) 32:289– 91. doi: 10.1093/bioinformatics/btv562
30. Boyle AP, Hong EL, Hariharan M, Cheng Y, Schaub MA, Kasowski M, et al. Annotation of functional variation in personal genomes using RegulomeDB.
Genome Res.(2012) 22:1790–7. doi: 10.1101/gr.137323.112
31. Mclean CY, Bristor D, Hiller M, Clarke SL, Schaar BT, Lowe CB, et al. GREAT improves functional interpretation of cis-regulatory regions.Nat Biotechnol.
(2010) 28:495–501. doi: 10.1038/nbt.1630
32. Kim D, Langmead B, Salzberg SL. HISAT: a fast spliced aligner with low memory requirements. Nat Methods. (2015) 12:357–60. doi: 10.1038/nmeth.3317
33. Anders S, Pyl PT, Huber W. HTSeq–a Python framework to work with high-throughput sequencing data. Bioinformatics. (2015) 31:166–9. doi: 10.1093/bioinformatics/btu638
34. Robinson MD, Mccarthy DJ, Smyth GK. edgeR: a Bioconductor package for differential expression analysis of digital gene expression data.Bioinformatics.
(2010) 26:139–40. doi: 10.1093/bioinformatics/btp616
35. Ginestet C. ggplot2: elegant graphics for data analysis.J R Stat Soc Series A.
(2011) 174:245–6. doi: 10.1111/j.1467-985X.2010.00676_9.x
36. Gandhi KS, Mckay FC, Cox M, Riveros C, Armstrong N, Heard RN, et al. The multiple sclerosis whole blood mRNA transcriptome and genetic associations indicate dysregulation of specific T cell pathways in pathogenesis.Hum Mol Genet.(2010) 19:2134–43. doi: 10.1093/hmg/ddq090
37. Parnell GP, Gatt PN, Mckay FC, Schibeci S, Krupa M, Powell JE, et al. Ribosomal protein S6 mRNA is a biomarker upregulated in multiple sclerosis, downregulated by interferon treatment, and affected by season.Mult Scler.
(2014) 20:675–85. doi: 10.1177/1352458513507819
38. Nickles D, Chen HP, Li MM, Khankhanian P, Madireddy L, Caillier SJ, et al. Blood RNA profiling in a large cohort of multiple sclerosis patients and healthy controls. Hum Mol Genet. (2013) 22:4194–205. doi: 10.1093/hmg/ddt267
39. Mootha VK, Lindgren CM, Eriksson K-F, Subramanian A, Sihag S, Lehar J, et al. PGC-1α-responsive genes involved in oxidative phosphorylation are coordinately downregulated in human diabetes.Nature Genetics.(2003) 34:267–73. doi: 10.1038/ng1180
40. Subramanian A, Tamayo P, Mootha VK, Mukherjee S, Ebert BL, Gillette MA, et al. Gene set enrichment analysis: a knowledge-based approach for interpreting genome-wide expression profiles.Proc Natl Acad Sci USA.(2005) 102:15545–50. doi: 10.1073/pnas.0506580102
41. Yu G, Wang LG, Han Y, He QY. clusterProfiler: an R package for comparing biological themes among gene clusters.OMICS.(2012) 16:284–7. doi: 10.1089/omi.2011.0118
42. Sacta MA, Tharmalingam B, Coppo M, Rollins DA, Deochand DK, Benjamin B, et al. Gene-specific mechanisms direct glucocorticoid-receptor-driven
repression of inflammatory response genes in macrophages. Elife.(2018) 7:1–25. doi: 10.7554/eLife.34864
43. Schmidt D, Schwalie PC, Ross-Innes CS, Hurtado A, Brown GD, Carroll JS, et al. A CTCF-independent role for cohesin in tissue-specific transcription.
Genome Res.(2010) 20:578–88. doi: 10.1101/gr.100479.109
44. Liu Z, Merkurjev D, Yang F, Li W, Oh S, Friedman MJ, et al. Enhancer activation requires trans-recruitment of a mega transcription factor complex.
Cell.(2014) 159:358–73. doi: 10.1016/j.cell.2014.08.027
45. Heikkinen S, Vaisanen S, Pehkonen P, Seuter S, Benes V, Carlberg C. Nuclear hormone 1alpha,25-dihydroxyvitamin D3 elicits a genome-wide shift in the locations of VDR chromatin occupancy.Nucleic Acids Res.(2011) 39:9181–93. doi: 10.1093/nar/gkr654
46. Wu JN, Pinello L, Yissachar E, Wischhusen JW, Yuan GC, Roberts CWM. Functionally distinct patterns of nucleosome remodeling at enhancers in glucocorticoid-treated acute lymphoblastic leukemia.Epigenetics Chromatin.
(2015) 8:53. doi: 10.1186/s13072-015-0046-0
47. Ryynanen J, Seuter S, Campbell MJ, Carlberg C. Gene regulatory scenarios of primary 1,25-dihydroxyvitamin d3 target genes in a human myeloid leukemia cell line.Cancers.(2013) 5:1221–41. doi: 10.3390/cancers5041221
48. Pike JW. Genome-wide principles of gene regulation by the vitamin D receptor and its activating ligand. Mol Cell Endocrinol. (2011) 347:3–10. doi: 10.1016/j.mce.2011.05.012
49. Davie K, Jacobs J, Atkins M, Potier D, Christiaens V, Halder G, et al. Discovery of transcription factors and regulatory regions driving in vivo
tumor development by ATAC-seq and FAIRE-seq open chromatin profiling.
PLoS Genet.(2015) 11:e1004994. doi: 10.1371/journal.pgen.1004994 50. Hah N, Benner C, Chong LW, Yu RT, Downes M, Evans RM.
Inflammation-sensitive super enhancers form domains of coordinately regulated enhancer RNAs.Proc Natl Acad Sci USA.(2015) 112:E297–302. doi: 10.1073/pnas.1424028112
51. Dowen JM, Fan ZP, Hnisz D, Ren G, Abraham BJ, Zhang LN, et al. Control of cell identity genes occurs in insulated neighborhoods in mammalian chromosomes.Cell.(2014) 159:374–87. doi: 10.1016/j.cell.2014.09.030 52. Daniel B, Nagy G, Czimmerer Z, Horvath A, Hammers DW,
Cuaranta-Monroy I, et al. The nuclear receptor PPARgamma controls progressive macrophage polarization as a ligand-insensitive epigenomic ratchet of transcriptional memory. Immunity. (2018) 49:615–26.e6. doi: 10.1016/j.immuni.2018.09.005
53. Fagerberg L, Hallstrom BM, Oksvold P, Kampf C, Djureinovic D, Odeberg J, et al. Analysis of the human tissue-specific expression by genome-wide integration of transcriptomics and antibody-based proteomics. Mol Cell Proteomics.(2014) 13:397–406. doi: 10.1074/mcp.M113.035600
54. Marat AL, Dokainish H, Mcpherson PS. DENN domain proteins: regulators of Rab GTPases. J Biol Chem. (2011) 286:13791–800. doi: 10.1074/jbc.R110.217067
55. Liang Y, Lin S, Zou L, Zhou H, Zhang J, Su B, et al. Expression profiling of Rab GTPases reveals the involvement of Rab20 and Rab32 in acute brain inflammation in mice. Neurosci Lett. (2012) 527:110–4. doi: 10.1016/j.neulet.2012.08.039
56. Nelson JK, Sorrentino V, Avagliano Trezza R, Heride C, Urbe S, Distel B, et al. The deubiquitylase USP2 regulates the LDLR pathway by counteracting the E3-ubiquitin ligase IDOL. Circ Res.(2016) 118:410–9. doi: 10.1161/CIRCRESAHA.115.307298
57. Kitamura H, Ishino T, Shimamoto Y, Okabe J, Miyamoto T, Takahashi E, et al. Ubiquitin-specific protease 2 modulates the lipopolysaccharide-elicited expression of proinflammatory cytokines in macrophage-like HL-60 cells.
Mediators Inflamm.(2017) 2017:6909415. doi: 10.1155/2017/6909415 58. Uchida H, Kondo A, Yoshimura Y, Mazaki Y, Sabe H.
PAG3/Papalpha/KIAA0400, a GTPase-activating protein for ADP-ribosylation factor (ARF), regulates ARF6 in Fcgamma receptor-mediated phagocytosis of macrophages. J Exp Med. (2001) 193:955–66. doi: 10.1084/jem.193.8.955
59. Seuter S, Ryynanen J, Carlberg C. The ASAP2 gene is a primary target of 1,25-dihydroxyvitamin D3 in human monocytes and macrophages.J Steroid Biochem Mol Biol.(2014) 144(Pt A):12–8. doi: 10.1016/j.jsbmb.2013.08.014 60. Okuno T, Nakatsuji Y, Kumanogoh A. The role of immune
61. Luis BS, Carpino N. Insights into the suppressor of T-cell receptor (TCR) signaling-1 (Sts-1)-mediated regulation of TCR signaling through the use of novel substrate-trapping Sts-1 phosphatase variants.FEBS J.(2014) 281:696– 707. doi: 10.1111/febs.12615
62. Dong G, You M, Fan H, Ding L, Sun L, Hou Y. STS-1 promotes IFN-alpha induced autophagy by activating the JAK1-STAT1 signaling pathway in B cells.
Eur J Immunol.(2015) 45:2377–88. doi: 10.1002/eji.201445349
63. Van Der Meulen T, Swarts S, Fischer W, Van Der Geer P. Identification of STS-1 as a novel ShcA-binding protein.Biochem Biophys Res Commun.(2017) 490:1334–9. doi: 10.1016/j.bbrc.2017.07.024
64. Langlais D, Barreiro LB, Gros P. The macrophage IRF8/IRF1 regulome is required for protection against infections and is associated with chronic inflammation.J Exp Med.(2016) 213:585–603. doi: 10.1084/jem.20151764 65. Pan G, Simpson S Jr, Van Der Mei I, Charlesworth JC, Lucas R, Ponsonby
AL, et al. Role of genetic susceptibility variants in predicting clinical course in multiple sclerosis: a cohort study.J Neurol Neurosurg Psychiatry.(2016) 87:1204–11. doi: 10.1136/jnnp-2016-313722
66. Gostynska KB, Nijenhuis M, Lemmink H, Pas HH, Pasmooij AM, Lang KK, et al. Mutation in exon 1a of PLEC, leading to disruption of plectin isoform 1a, causes autosomal-recessive skin-only epidermolysis bullosa simplex. Hum Mol Genet. (2015) 24:3155–62. doi: 10.1093/hmg/ ddv066
Conflict of Interest Statement: The authors declare that the research was conducted in the absence of any commercial or financial relationships that could be construed as a potential conflict of interest.