MUIR
Massey University Institutional Repository
Forsyth, D.; Burt, C. (2006). The effect that rounding to
prototypical values has on expected duration estimation accuracy.
(Department of Management and International Business Research
Working Paper Series 2006, no. 5). Auckland, NZ: Massey
University. Department of Management and International
Business.
Massey Author:
Forsyth, Darryl
Research
Working
Paper Series
Department of Management and International
Business
2006, no. 5
Darryl Forsyth
Christopher Burt
Keywords
The effect that rounding to prototypical values has on expected duration
estimation accuracy
Time Management Scheduling
Duration Estimation
Contact Details
Dr Darryl Forsyth
Department of Management & International Business Massey University (Auckland) Private Bag 102 904
Auckland, New Zealand Ph 64 9 414 0800 ex 9135 Email [email protected]
Copyright
© 2006 Darryl Forsyth and Christopher Burt
ABSTRACT
The scheduling component of the time management process was used as a ‘paradigm’ to
investigate the estimation of duration of future tasks. Two experiments looked at the effect
that the tendency to provide estimates in the form of rounded close approximations had on
estimation accuracy. Additionally, the two experiments investigated whether grouping tasks
together prior to scheduling would decrease duration estimation error. The majority of
estimates provided in both experiments were categorised as rounded close approximations,
and were overestimates of the actual time required to complete the experimental tasks. The
grouping together of the relatively short tasks used in Experiment 1 resulted in a significant
increase in estimation accuracy. A similar result was found in Experiment 2 for relatively
long tasks. The results are discussed in relation to the basic processes used to estimate the
Everyday individuals make estimates of the ‘time required’ for future work and life tasks.
Two research literatures address this type of estimation process. The time management
literature considers the estimation of future tasks within the broader frame-work of planning
and prioritizing tasks (see Claessens, Van Eeerde, Rutte, & Roe (2004) and Macan 1994).
In contrast, there is research literature focusing specifically on temporal aspects of memory,
which tends to consider just the estimation process (see Block & Zakay, 1997; Roy,
Christenfeld, & McKenzie, 2005 for recent reviews). Both under- and over-estimation of
task completion time can have negative consequences. In the case of overestimation, an
individual’s time may not be being used efficiently, whereas in the case of underestimation
the individual may be stressed by the realisation that they have not scheduled enough time to
complete a task. Roy et al. (2005) claim that underestimation of future task duration is more
common than overestimation, and offers a model of the processes by which this occurs. We
examine the research they cited to support the claim that individuals typically underestimate
the duration of future task, and offer an alternative model of the processes involved in
estimating duration, which we test with two experiments.
Roy et al’s. (2005) review cites fourteen published studies (see their Table 1) which
have examined individual’s estimates of future task duration, and which also collected data
on the actual duration of these tasks, thus allowing a determination of whether the estimates
were on average an under- or over-estimation of actual task duration. A number of these
studies included more than one task, thus overall there were 35 specific comparisons of
estimated and actual task duration. If we do as Roy et al. (2005) did, and simply consider all
35 comparisons it is evident that individuals underestimated duration for 25 (71.4%) of the
comparisons, justifiying their claim that individuals typically underestimate future task
duration. However, a closer inspection of the 35 tasks examined in Roy et al. (2005)
indicates that 18 of them lasted less than one hour (short tasks), 4 were for tasks which had actual durations between 2.4 and 16.8 hours (intermediate tasks), and the remaining 13 tasks had actual durations of between 1 and 55.5 days (long tasks). Examination of these 3 types (short, intermediate and long tasks) indicates that 10 (55%) of the short task, 3 (75%) of the intermediate tasks, and 11 (84.6%) of the long tasks produced underestimation. Thus
underestimation seems more likely as actual duration gets longer. Particularly in relation to
short tasks, the claim that individual typically underestimate duration is not overwhelmingly
Our focus in the experiments reported in this paper is on short duration tasks, and the
processes by which individuals allocate time to these tasks. In order to understand those
processes a further examination of the data reported by Roy et al. (2005) for the short (less
than one hour) duration tasks is warranted. Our principle argument is that individuals tend to
given estimates for future short duration events/tasks which are in units of 5 (e.g., 5 minutes,
10 minutes, 15 minutes etc). We explain later why we think this occurs, and how this can
result in very predictable tendencies towards under- and over-estimation. Mean estimated
duration can mask such tendencies, and we argue that median and modal estimates give a
better indication of a group’s estimation tendency. Thus one of the first things to note is that
the data reported by Roy et al. (2005) for the 18 comparisons of actual and estimated
duration for short tasks, while stated as all being means, are a mixture of means and medians
(and in the case of the studies by Konecni & Ebbesen, (1976) and Buehler, Griffin and
MacDonald, (1997) are values calculated on other data presented).
The 18 comparisons of actual estimated duration which Roy et al. 2005 reviewed
came from a total of 6 different published papers, which they examined in chorological order,
as we do. Konecni and Ebbecen (1976) asked 89 individuals to estimate how long they
would have to wait in line to buy petrol. Participants estimated the number of cars ahead of
them in the line and how long they thought they would be waiting. While the average
waiting time was 28.8 minutes, participants estimated they would wait around 19 minutes on
average (an underestimation). But from their data it appears that no one participant actually
estimated they would wait 19 minutes, rather only 5 different estimates were given: 14.1 %
of the participants estimated 10 minutes, 53.9 % estimated 20 minutes, 18 % estimated 23
minutes, 6.3 % estimated 24 minutes and 7.7% estimated 25 minutes. Thus overall, 75.7%
of all these estimates were in multiples of five, and the modal estimate was 20 minutes. The
next study examined by Roy et al. (2005) was Burt and Kemp 1994. This study examined
estimated and actual duration for 10 different tasks, median estimated duration for the 10
tasks were 2, 10, 5, 3, 2.2, 15, 15, 14, 10, and 7 minutes. Thus at the task level, 50% of the
tasks examined produced median estimates that were multiples of 5, (note also that for 7 of
the 10 tasks the median estimated duration was an overestimation). Next Experiment 2 of
Buehler et al. (1997) was reported. This involved participants completing a series of
anagram-like word puzzles performed under a speed incentive or an accuracy incentive
manipulation. Buehler et al. report mean estimated and mean actual duration for each
(averaged the estimated duration for the experimental and control group) when reporting the
overall mean actual and mean estimated duration for this experiment. Perhaps a more
appropriate consideration of these data is to just examine the control conditions – in which
case average estimated time to complete the task was an overestimation. Roy et al. report
data for two tasks from Byram (1997). For the first task, which involved building a
computer stand, they reported an overall mean actual duration of 70.5 minutes and overall
mean estimated duration of 45 minutes. However, a closer reading of Byram’s paper shows
estimated duration was obtained, and medians reported, for sub-components of the whole
task: median estimated duration of 60 minutes for assembly of the stand, 25 minutes for the
table, 15 minutes for the keyboard tray, and 15 minutes for the monitor stand. Data for the
second task from Byram’s work relate to making origami. Roy et al. reported these as
averages, while they are in fact medians (median actual duration of 8 minutes and median
estimated duration of 6 minutes), but they do show underestimation. Next, data from
Francis-Smythe and Robertson (1999) were reported for proofreading of an essay (mean
estimated duration was 5 minutes and actual 5.8 minutes). Finally, data from two samples
from Hinds (1999) were reported. In one sample relating to a cell phone task the mean
estimated duration was 18.5 minutes and in the other sample relating to a Lego task mean
estimated duration was 10.7 minutes – unfortunately medians (which might well have been
20 and 10 minutes respectively) were not given. Overall, the data which Roy et al. (2005)
report in relation to short duration tasks does not consistently indicate underestimation, and
they fail to note the tendency for participants to give estimates in multiples of 5 minutes.
We turn now to the memory bias account which Roy et al. (2005) offer to explain the assumption that estimates are often under-estimations. They propose that “people remember
tasks as taking less time than they actually did and, therefore, underestimate how long similar
tasks will take in the future’ (P. 738). However, literature on retrospective duration
estimation indicates that individuals are often relatively good at estimating the duration of
past events. For example, Burt, Kemp and Conway (2001) tested individual’s ability to
estimate duration for autobiographical events on two occasions with a 10 year interval, and
found that the duration estimates were highly accurate and extremely stable over time. This
study, and a number of previous studies (e.g., Burt 1992, 1993, 1999; Burt & Kemp, 1991;
Burt & Popple, 1996), concluded that retrospective duration estimation involves considerable
reconstructive processing which is suggested to begin with the classification of the target
knowledge regarding the typical duration of such events (e.g., it typically takes 10 minutes to
go to the shop for milk). Thus, in contrast to Roy et. al’s., (2005) memory bias model, we do not assume that memory for duration is stored for individual events, rather we propose it is
associated with general knowledge of event categories. Thus, Burt and Kemp (1991) showed
that increased experience with event categories reduced the between-subject variation in
duration estimates. Furthermore, Burt (1993) found that the accuracy of an individuals
duration estimate when based primarily on an event category’s typical duration, was
influenced by the typicality of the actual duration of the target event, and by the individuals
ability to use his or her memory of the target event to adjust their estimate for atypical event
characteristics. We have argued that similar processes occur when individuals estimate the
duration of future events (e.g., Burt & Kemp, 1994). Here the target event is classified into a
category, and memory for that category of event is examined. For example, you are asked
how long it will take you to proof read an essay – and this prompts access to your general
knowledge of proof reading documents – essays, research proposal, grant applications etc.
Your general knowledge of how long such tasks have taken in the past is then used to make
an estimate. Because the event has not occurred yet, you can not adjust for atypicality (e.g.,
to give a longer estimate because you know a particular essay contains many spelling
mistakes), and the estimate given is often a rounded close approximation. For short duration events we suggest that these rounded close approximations are often in 5 minute intervals.
For example, you know it takes approximately 10 minutes to go to the shop to get milk –
sometimes more, sometimes less, but in round terms about 10 minutes. As discussed above,
studies on short duration tasks, which Roy et al. (2005) reviewed, show considerable
evidence of these rounded close approximation estimates.
Francis-Smythe and Robertson (1999) have also discussed how ‘rounding’ may
effect task duration estimation. Likewise, this process has been suggested by Zakay (1990)
who points out that any verbal estimate of a duration is prone to error arising from the
response bias of reporting durations in round numbers. Consistent with this view, Hornik
(1981) noted that participants in his study tended to report duration estimates in multiples of
five minutes. Furthermore, many of the rounded values found in duration estimation studies
may represent temporal categories (Smith & Medin, 1981; Oden, 1987). The tendency to
use rounded close approximations may also be enhanced by the design of diaries and daily
planners, which typically provide 15 minute, 30 minute or 1 hour segments in which to
relation to much longer intervals, Huttenlocher, Hedges, Bradburn (1990) found that
participants over-reported temporal values like 7, 14, 30, 60 (week, fortnight, month, and two
months respectively) when asked how many days had elapsed since various personal
(autobiographical) events.
How then does our reconstructive model explain why individuals under- or
over-estimate the duration of future events? Roy et al. (2005) argue it is because we incorrectly
recall the duration of past events as shorter than they actually were (resulting in a general
tendency to under-estimate). In contrast, we argue that two different factors determine under-
or over-estimation. The first relates to experience with the event type. As we experience
more instances of a specific type of event our knowledge of approximately how long it will
last for becomes more exact (recall that Burt & Kemp, 1991 found experience with event
categories reduced between-subject variance in estimated duration). The inverse of this is
that, with little experience with a task we may not be certain as to which rounded close
approximation to use. For example, a task which we feel might last between 5 to 10 minutes
can either be allocated 5 or 10 minutes as a rounded close approximation of its required time.
If this task actually lasts 7 minutes, a 10 minute estimate would have been an
over-estimation, and a 5 minute estimate an under-estimation. The second factor that we suggest
is important is how close our general idea of a task’s required duration is to a particular
rounded close approximation unit. For example, if we think it generally takes 8 to 9 minutes
to go to the staff room to get coffee – we might put a note on the office door saying ‘back in
10 minutes’ – rather than ‘back in 5 minutes’ because 8 or 9 minutes is closer to 10 minutes
than it is to 5 minutes. This could result in consistent overestimation. In contrast, a task
which we think might take about 6 to 7 minutes (which is closer to 5 minutes than 10
minutes) might occasion an estimate of 5 minutes – resulting in underestimation if the task
lasted say 6.5 minutes.
Finally it is important to remember that the estimation of duration of future tasks is
often within a context where the accuracy of the estimate has consequences. These
consequences relate to how others perceive us, for example how reliable they perceive we
are, how much pressure we put on ourselves. Burt and Kemp (1994) argued that
overestimating task time maybe a ‘safe estimation’ strategy which helps ensure tasks are
completed on time (thus others see the individual as reliable), and which helps avoid the
perhaps more inclined to use a rounded close approximation which results in overestimation,
as opposed to giving a rounded close approximation which results in an underestimation.
Experiment 1 and 2 investigated the effect that using rounded close approximations
has on estimation accuracy. It was predicted that when asked to estimate the duration of a
to-be-completed task participants will be more likely to provide an estimate which is in the form
of a rounded close approximation (e.g., five-minute ‘chunks’). Secondly, although the
predicted over-reliance on rounded close approximations will tend to lead to inaccuracies for
almost all duration estimates of future tasks, it is argued that this tendency to estimate in
five-minute segments will result in proportionally more overestimations for very short tasks (less
than 5 minute tasks as used in Experiment 1) because the closest rounded close
approximation is larger than the event’s actual duration. Furthermore, given that the use of
rounded close approximations has the potential to create estimation error every time an
estimate is given for a future task, if the number of estimates is reduced it may be possible to
reduce estimation error. If, for example, three tasks are grouped together and a single
estimate of their required time is requested, this estimate should be more accurate than the
sum of three individual estimates (one for each of the three tasks). To examine this
prediction we included a ‘task grouping’ manipulation into both experiments. This simply
requested participants to estimate completion time for half the tasks as a group (i.e. one
segment of time scheduled for the completion of 3 tasks which individually were designed to
require less than 5 minutes to complete). It was predicted that grouping relatively short
duration tasks together, and requesting one duration estimate for the completion of all these
tasks, will result in greater task duration estimation accuracy when compared to estimates
(summed estimates) given for each of the tasks individually.
EXPERIMENT 1
Method
The experiment contained two participant conditions, both involving the scheduling and
completion of the same six office-type tasks. In condition one, three of the tasks were
grouped together to form one set of activities to be scheduled, and the other three tasks were
scheduled as separate tasks. In condition two, the three tasks scheduled as one set of
scheduled as a task set. These manipulations resulted in both groups providing 4 duration
estimates, three relating to individual tasks and one relating to a set of tasks.
Participants
Twenty male and 20 female students, with a mean age of 22.5 years, participated in the
experiment. Participants received NZ$20 remuneration and were debriefed after the
experiment.
Materials
Scheduling Planner
The scheduling planner consisted of an A4 sheet of paper with a plain border.
Tasks
Two criteria were used in the development of the six experimental tasks. Firstly, a balance
was sought between re-creating an office environment, and having tasks that all participants
would find at least somewhat familiar. Secondly, the individual tasks were designed, based
on previous research (e.g., Burt & Kemp, 1994) and informal pilot studies, so as to have
relatively short average completion times of between three and eight minutes.
ground floor). One dollar is in the appropriate folder. Task 6 Arrange 20 job applications in alphabetic order with respect to the applicants’ surnames (i.e. ‘A’ in the front, through to ‘Z’ at the back).
Procedure
Participants were randomly assigned to one of two conditions. In the first condition (group
1) tasks one, two, and three were scheduled separately, and tasks four, five, and six were
grouped together and scheduled as a task set. In condition two (group 2) tasks one, two, and
three were grouped together and scheduled as a task set, while tasks four, five, and six were
scheduled separately.
Participants were seated individually at a cubicle which contained: a table,
experimental instructions, task descriptions, a scheduling planner, folders containing task
materials, a telephone and directory, and a ‘Completed Task’ tray. Each participant was
instructed to read the following instructions: “This experiment examines job satisfaction in
office work. You are required to complete six tasks. These tasks can be carried out in any
order you choose, however you must complete one task before you move on to the next one.
Try to imagine that you are working in an office situation and the completion of these tasks is
part of your duties. Specifically you are required to: Read the accompanying sheet that
describes the tasks – this sheet listed 3 tasks separately and three as a group of tasks.
Schedule the completion of the tasks by entering onto the scheduling planner the order you
propose to complete the tasks, along with the time you expect to need for completion of each
(participants were not constrained to provide duration estimates in any particular scale (i.e.,
minutes versus seconds). The participants then completed the tasks. The researcher, who
was partitioned off from the participant, discretely recorded the time taken for the participant
to complete each task.
Results And Discussion
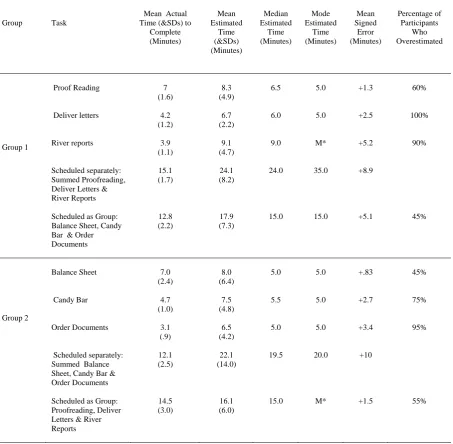
Table 1 shows the mean actual duration, mean, median and modal estimated duration, and
mean signed error (estimated minus actual duration) for each task. Inspection of Table 1
indicates that the mean signed errors are positive for all six tasks (when scheduled as separate
tasks), meaning that participants tended to overestimate the amount of time they actually
_____________________________________________________
Insert Table 1 about here
_______________________________________________________
Rounding and Overestimation
The 40 participants’ supplied a total of 160 estimates, and the majority of these (73%) were
rounded close approximations (e.g., multiples of five minutes), with 51 percent of all
estimates being either five- or 10-minutes. This is also shown in the modal estimated
durations shown in Table 1. Table 1 also shows the proportion of participants that
overestimated. The three tasks (letter delivery, river conditions, and document ordering) with
the shortest average actual durations (around three to four minutes) had the highest
proportions of participants providing overestimates (100, 90, and 95% respectively).
Conversely, the two tasks with the longest average actual duration (proofreading and
balancing bills) of around seven minutes had the lowest proportions of participants providing
overestimates (60 and 45% respectively). In the case of these two tasks, participants who
used rounded close approximations had a choice between allotting five (an underestimation)
or 10 (an overestimation). The modal estimates for these two tasks indicate that the
participants tended to give a 5 minute estimate - a choice which is reflected in the proportion
of over- and under-estimates for these two tasks.
Actual Task Duration
A 2x2 mixed design ANOVA, with group being the between subject variable and whether the
tasks were scheduled together or separately being the within subject variable, was conducted
for the actual task durations. It revealed no main effect for group (F (1, 38) = 1.53, p=.22),
confirming that the two groups do not differ significantly in the overall time to complete the
tasks. In addition, it revealed no main effect for the scheduling variable (F (1, 38) = 1.46,
p=.23). Likewise, there was no significant interaction between the group and scheduling
variables (F (1, 38) = .15, p=.70). This balancing actual task duration for the three tasks
scheduled together and three scheduled separately was successful, and these results mean
that analysis of the effect of scheduling tasks together could be undertaken both within and
across the two groups of participants. Furthermore, these findings indicate that grouping
relatively short duration tasks together at the time of scheduling has no significant positive
Grouping Tasks and Scheduling
The median estimated duration for the tasks which were scheduled as a group, and the
median summed estimated duration for the three tasks scheduled separately are shown in
Table 1, and comparison of these results indicates less time was allocated when the tasks
were grouped. This is further indicated by the mean signed errors. For example the mean
summed signed error for the three tasks scheduled separately by group 1 was +8.9 minutes,
while the mean signed error for the same three tasks scheduled as a group of tasks by group 2
is +1.5 minutes. A 2x2 mixed design ANOVA, with group the between-subject variable and
whether the tasks were scheduled together or separately the within-subject variable, was
conducted for estimated task durations. The ANOVA revealed a significant interaction
between the group and scheduling variables (F (1,38) = 17.91, p=.0001). Significant
differences were found between the two groups on their duration estimates for tasks one, two,
and three (F (1,38) = 12.27, p=.001), group one’s estimation of tasks one, two, and three and
tasks four, five, and six (F (1,38) = 9.15, p=.004), and similarly group two’s estimation of
tasks one, two, and three, and tasks four, five, and six (F (1,38) = 8.76, p=.005). Although in
the right direction, the only comparison where a significant difference was not found was
between the two groups and tasks four, five, and six (F (1,38) = 1.39, p= .25). These results
support our prediction that grouping relatively short duration tasks together results in less
time being allocated to them, and thus the generation of more accurate estimates.
EXPERIMENT 2
Experiment 2 attempted to replicate the findings from Experiment 1 by assessing the effect of
scheduling grouped tasks and the influence of using prototypical temporal values when actual
task time was substantially longer (i.e. 20-40 minutes). The experimental design was the
same as used in Experiment1, except that different tasks that required longer to complete
were used. The following four prediction were made: (1) on average participants will tend to
overestimate the time required for task completion, (2) participants will be more likely to
provide an estimates which is in the form of a rounded close approximations (e.g.,
five-minute ‘chunks’), (3) grouping tasks together for scheduling purposes will result in less time
being allocated for their completion, than when the same task were scheduled separately.
However, although Experiment 1 appears to provide evidence that grouping relatively short
duration tasks together for scheduling purposes results in less time being allocated for their
value for longer tasks. For instance, it seems likely that people will change the ‘scale’
(rounded close approximations) of their estimation as the actual task duration increases. For
example, if asked to estimate how long it will take to read a 300-page manuscript it would
seem unlikely that the predisposition towards estimates of multiples of five minutes would
prevail. This being the case, the effectiveness of grouping tasks together in order to increase
accuracy may be dependent on the association between the actual duration of the task and the
prominent rounded close approximation chosen.
Method
Participants
Forty participants, 19 males and 21 females students, with a mean age of 22.4 years,
participated in the experiment (none had participated in Experiment 1). Participants were
remunerated for taking part, and debriefed at the end of experiment.
Materials
Scheduling Planner
The task schedule planner consisted of an A4 sheet of paper.
Tasks
Two criteria were used in the design of tasks. As with Experiment 1, a balance was sought
between re-creating an office environment, and having tasks that all participants would find
somewhat familiar. Secondly, individual tasks were designed so as to have a significantly
longer average completion time (between 20-40 minutes) than those used in Experiment 1.
This was achieved by increasing the magnitude of three of the tasks used in Experiment 1,
and by designing three new tasks that were trialled by volunteers and adjusted accordingly.
(e.g., power bill, phone bill) are provided, along with an account balance sheet. Your task is to enter the ‘billed amount’ in the debt column and subtract the amount from the balance, creating a new balance after each subtraction (pen and paper subtraction - no calculator).
TASK 5 The company you work for has many job application letters, which it has received over the past five years. These need to be ordered and filed. The folder contains 100 job application letters. Firstly, you need to sort the letters with respect to the year they were sent. This will result in five groups of letters. For each of these five groups you are required to arrange the job applications in alphabetic order with respect to the applicant’s surname (i.e. ‘A’ in the front, through to ‘Z’ at the back). The paper clips provided should be used to keep each group together. Task 6 The company you work for is thinking of subscribing to various academic journals. Your task is to gather subscription information on these journals (normally found on the inside front or back cover). Go to the current periodicals section of the main library and record the annual institutional subscription rate (non-airmail where applicable) and the subscription address for the following 10 journals (titles and call numbers were provided).
Procedure
Participants were randomly assigned to one of two conditions. In the first condition (group 1)
tasks 1, 2, and 3 were scheduled separately and task 4, 5, and 6 were grouped together and
scheduled as a task set. In condition two (group 2) tasks 1, 2, and 3 were grouped together
and scheduled as a task set, and tasks 4, 5, and 6 were scheduled as separate tasks.
Participants were seated individually at a table, given the experimental instructions
(identical to Experiment 1), task activity descriptions, a scheduling planner, folders
containing the task materials, a telephone directory, a ‘Completed Task’ tray, and directed to
read the instructions. Participants scheduled the completion of the tasks, and completed the
tasks in the order they had chosen. The researcher discretely recorded the time taken for the
participant to complete each task.
Results and Discussion
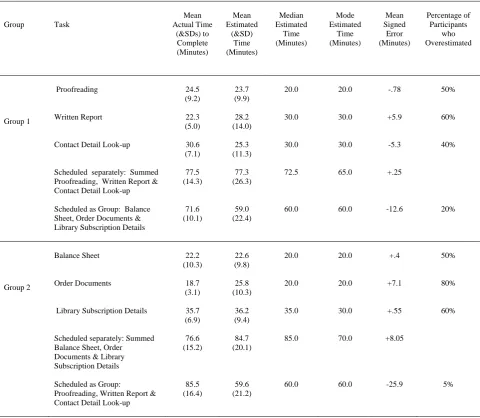
Table 2 show the mean actual duration, mean, median and modal estimated duration, and
mean signed error (estimated minus actual duration) for each task. In contrast to Experiment
1, the mean signed errors are not positive for all six tasks. For two of the tasks the actual
shows the proportion of participants who overestimated completion durations, and these are
generally smaller than those obtained in Experiment 1.
_______________________________________________________
Insert Table 2 about here
_______________________________________________________
Rounding and Overestimation
Examination of the duration estimates indicated that 83% of the participants gave values of
10, 15, 30, 40, 45, 50, 60 or 90 minutes which might be considered to be rounded close
approximations. This tendency is also reflected in the median and modal estimates shown in
Table 2.
Actual Task Duration
Table 2 shows the mean actual time it took participants to complete the tasks. A 2x2 mixed
design ANOVA, with group the between-subject variable, and whether the tasks were
scheduled together or separate the within-subject variable, was conducted for actual task
durations. It revealed no main effect for group (F (1, 38) = 2.91, p=.10). This result confirms
that the two groups did not differ significantly in the actual duration it took to complete the
tasks. Likewise, the ANOVA revealed no significant interaction between the group and
scheduling variables (F (1, 38) = .40, p=.54). However, it did reveal a main effect for the
scheduling variable (F (1, 38) = 9.49, p=.004). Although this is not the ideal outcome, it does
not affect any of the important analyses concerning duration estimation (the difference in
actual duration is between tasks that have been scheduled together for both groups). Overall
these results confirm that the important parts of balancing actual task duration for the three
tasks scheduled together and three scheduled separately was successful. These results mean
that analysis of the effect that scheduling tasks together had on duration estimates could be
undertaken both within and across the two groups of participants. This finding also confirms
that grouping tasks together has no significant positive (or negative) effects on actual
completion duration.
Grouping Tasks and Scheduling
Table 2 shows the median estimated duration for the tasks which were scheduled as a group
and the median summed estimated duration for the three tasks scheduled separately. A 2x2
scheduled together or separately the within-subject variable, was conducted for estimated task
durations. The results of the ANOVA revealed no main effect for group (F (1, 38) = .42,
p=.52). This result confirms that the two groups did not differ significantly as far as overall
duration estimated to complete all six tasks. In addition, there was no main effect for the
scheduling variable (F (1, 38) = .88, p=.36). However, as expected, the ANOVA revealed a
significant interaction between the group and scheduling variables (F (1, 38) = 36.16,
p=.0000). Significant differences were found between the two groups on their duration
estimates for tasks one, two, and three (F (1, 38) = 5.44, p=.03), tasks four, five, and six (F
(1,38) = 14.5, p= .000), group one’s estimation of tasks one, two, and three, and tasks four,
five, and six (F (1, 38) = 12.89, p=.001), and similarly group two’s estimation of tasks one,
two, and three and tasks four, five, and six (F (1, 38) = 24.15, p=.000). These findings
replicate the findings of Experiment 1 whereby grouping tasks together had a significant
effect on duration estimates.
However, in contrast to Experiment 1, the reduction in estimated duration did not
result in an increased accuracy of the estimations. In fact when presented separately the
somewhat longer tasks used in this experiment were estimated with a relatively high degree
of accuracy. Whereas, scheduling tasks together resulted in greater estimation error,
specifically underestimation of actual duration.
GENERAL DISCUSSION
The results from Experiments 1 and 2 suggest that people often tend to report rounded close
approximations when estimating the duration of future short tasks. This bias tends to lend to overestimation for tasks with actual durations less than 5 minutes. Grouping tasks into small
clusters prior to scheduling was shown in both experiments to reduce the amount of time
allocated for task completion, and this strategy may provide one means though which the
influence of using rounded close approximations can be decreased. However, it is important
to note that overestimation of required task time may not always be a negative behaviour. As
Burt and Kemp (1994) noted, this could be a ‘safe estimation strategy’, a strategy which
results in tasks being completed within the allocated time. The stragety may well increase the
individual’s feeling of control over time and result in less time management related stress.
While our results show considerable use of rounded close approximations, which is
inconsistent with Roy et al. (2005) memory bias account. None of the tasks we used was particularly novel or unusual, and our participants might have been expected to have had
some experience with such tasks. Given this, if they were using specific memories (albeit
erroneous ones) of the duration of such tasks to give estimates, in the way Roy et al.,
suggest, we might have expected to find much more variance in the estimates, rather than the
tendency towards estimates rounded in 5 minute units. The memory bias account appears to have much in common with Ornstein’s (1969) storage size hypothesis which proposed that estimated duration is proportional to the information stored in memory about the event or
interval at the time of estimation. This hypothesis was the dominant explanation of
retrospective duration estimation for many years, and numerous laboratory based studies
supported it (see Fraisse, 1984 for a review of this work). Basically, as an individual forgets
information (often stimuli like burst of tone or light) presented during an interval their
estimate of its duration shortens. However, Ornstein’s modal does not appear to generalise to
more complex real world events. Burt and Kemp (1991) tested the model with real world
events and failed to support it. For example, it does not seem to be the case that because you
now can recall less about a holiday you had 10 years ago, that you now think the holiday
lasted less time. Thus the direct relationship between memory for past durations and
estimates of the duration of future similar events/tasks may not be as strong as Roy et al.
suggest.
While our results show considerable evidence of rounded close approximations in
short duration tasks, and evidence that these can lend to overestimation for such tasks, what
of longer tasks? As noted in the introduction, there was more evidence of underestimation
for the longer tasks examined by Roy et al., (2005). Roy et al. cited Kahneman and
Tversky’s (1979) work on the planning fallacy in support of their model, and as an explanation for underestimation. Kahneman and Tversky suggested a person can use two
types of information to make a time prediction. Singular information relates to the target task, and distributional information relates to completion times of similar tasks in the past. Our constructive model suggests that distributional information of past events/tasks duration is developed into general knowledge structures for event categories (Kahneman & Lovallo,
1993 also discuss such knowledge of the average time tasks have taken) and these structures
plays an important part in the estimation process, whereas Roy et al. argue that while
distributional knowledge is important, that these memories of past duration are generally
really did. In contrast, we argue that the reason why the required time of future longer tasks
is sometimes underestimated is that individuals find it difficult to use singular information when estimating.
As noted singular information relates to the target task. Several factors may influence
how we can use singular information when trying to estimate how long a future task will
take. First, what information is available about the specific task? Take, for example, the task
of reviewing a paper for a journal. When the day arrives on which you might have to begin
this task (schedule it in) the reviewer may or may not know the authors, basically what the
paper is about (having read the abstract or title when accepting it for review), and
approximately how long it is (having printed it). However, the specific content of the paper
remain unknown at this point. The reviewer may be able to make some adjustments to their
constructed estimate of the review time (based on singular information) because they know
the authors do typically do good work (which might occasion less need for critical comment) or the paper seems atypically short or long. Such adjustments may or may not result in a
more accurate allocation of time, and they may result in either over- or under-estimation.
Thus use of singular information about the task may not produce specific estimation
tendencies.
Often there is also singular information about when we have scheduled the tasks, for example the day of the week, time of the year. Arguably there is an interaction between
accuracy (under- or over-estimation) of the scheduled time and just when that time is used.
Let us take the review process as an example again. If a review is scheduled to be completed
during the working week, the probability of interruptions (colleagues and students arriving
unexpectedly) is perhaps greater then if the review is completed at home on the weekend.
Furthermore, as the actual time allocated to any task increases, the probability of an
interruption undoubtedly increases. For example, in a one hour period the phone might go
once or twice, someone might knock on the office door, and in combination these
interruptions have a time cost to whatever is being done. However, this time cost potentially
increases as the task’s actual duration increases. In other words, the longer a task takes the
less likely an individual will be to complete it on time because the potential number of
interruptions increases. Being able to apply this logic (singular information) when
constructing the duration of future events/tasks is probably extremely difficult. Thus perhaps
completion at a time when there is absolutely no possibility of interruptions. Of course such
time rarely exists.
REFERENCES
Block, R. A., & Zakay, D. (1997). Prospective and retrospective duration judgments: A
meta-analytic review. Psychonomic Bulletin & Review, 4, 184-197.
Buehler, R., Griffin, D., & MacDonald, H. (1997). The role of motivated reasoning in
optimistic time predications. Personality and Social Psychology Bulletin, 23, 238-247.
Burt, C. D. B. (1992). Reconstruction of the duration of autobiographical events. Memory & Cognition, 20, 124-132.
Burt, C. D. B. (1993). The effect of actual event duration and event memory on the
reconstruction of duration information. Applied Cognitive Psychology, 7, 63-73.
Burt, C. D. B. (1999) The effect of categorisation of action speed on estimated duration.
Memory, 7, 345-355.
Burt, C. D. B. & Forsyth, D. (1999). Designing materials for efficient time management:
Segmentation and planning space. Cognitive Technology, 4, 11-18.
Burt, C. D. B., & Kemp, S. (1991). Retrospective duration estimation of public events.
Memory & Cognition, 19, 252-262.
Burt, C. D. B., & Kemp, S. (1994). Construction of activity duration and time management
potential. Applied Cognitive Psychology, 8, 155-168.
Burt, C. D. B., Kemp, S., & Conway, M. A. (2001) What happens if you
retest autobiographical memory after 10 years? Memory & Cognition.29, 127-136.
Burt, C. D. B., & Popple, J. S. (1996). Effects of implied action speed on estimation of event
duration. Applied Cognitive Psychology, 10, 53-63.
Claessens, B. J. C., Van Eeerde, W., Rutte, C. R. & Roe, R. A. (2004). Planning behaviour
and perceived control of time at work. Journal of Organizational Behavior, 25, 937- 950.
Fraisse, P. (1984). Perception and estimation of time. Annual Review of Psychology, 35, 1-36.
Francis-Smythe, J. A., & Robertson, I. T. (1999). On the relationship between time
management and time estimation. British Journal of Psychology, 90, 333-347.
Hinds, P. J. (1999). The curse of expertise: the effects of expertise and debiasing methods on
predictions of novice performance. Journal of Experimental Psychology: Applied, 5, 205-221.
Huttenlocher, J., Hedges, L. V., & Bradburn, N. M. (1990). Reports of elapsed time:
Bounding and rounding processes in estimation. Journal of experimental Psychology: Learning, Memory, and Cognition, 16, 196-213.
Kahneman, D., & Tversky, A. (1979). Intuitive prediction: Biases and corrective procedures.
TIMS Studies in Management Science, 12, 313-327.
Kahneman, D., & Lovallo, D. (1993). Timid choices and bold forecasts: A cognitive
perspective on risk taking. Management Science, 39, 17-31.
Konecni, V. J., & Ebbesen, E. E. (1976). Distortions of estimated of numerousness and
waiting time. Journal of Social Psychology, 100, 45-50.
Macan, T. M. (1994). Time management: Test of a process model. Journal of Applied Psychology, 79, 381-391.
Oden, G. (1987). Concept, knowledge, and thought. Annual review of Psychology, 38, 203-227.
Roy, M. M., Christenfeld, N. J. S. & McKenzie, C. R. M. (2005) Underestimating the
duration of future events: Memory incorrectly used or memory bias? Psychological Bulletin, 131, 738-756.
Smith, E. E., & Medin, D. L. (1981). Categories and concepts. Massachusetts: Harvard University Press.
Zakay, D. (1990). The evasive art of subjective time measurement: Some methodological
Table 1. Summary of actual and estimated task duration for Experiment 1.
Group Task
Mean Actual Time (&SDs) to
Complete (Minutes) Mean Estimated Time (&SDs) (Minutes) Median Estimated Time (Minutes) Mode Estimated Time (Minutes) Mean Signed Error (Minutes) Percentage of Participants Who Overestimated
Proof Reading 7 (1.6)
8.3 (4.9)
6.5 5.0 +1.3 60%
Deliver letters 4.2 (1.2)
6.7 (2.2)
6.0 5.0 +2.5 100%
Group 1 River reports 3.9 (1.1)
9.1 (4.7)
9.0 M* +5.2 90%
Scheduled separately: Summed Proofreading, Deliver Letters & River Reports
15.1 (1.7)
24.1 (8.2)
24.0 35.0 +8.9
Scheduled as Group: Balance Sheet, Candy Bar & Order Documents
12.8 (2.2)
17.9 (7.3)
15.0 15.0 +5.1 45%
Balance Sheet 7.0 (2.4)
8.0 (6.4)
5.0 5.0 +.83 45%
Candy Bar 4.7 (1.0)
7.5 (4.8)
5.5 5.0 +2.7 75%
Group 2
Order Documents 3.1 (.9)
6.5 (4.2)
5.0 5.0 +3.4 95%
Scheduled separately: Summed Balance Sheet, Candy Bar & Order Documents
12.1 (2.5)
22.1 (14.0)
19.5 20.0 +10
Scheduled as Group: Proofreading, Deliver Letters & River Reports
14.5 (3.0)
16.1 (6.0)
15.0 M* +1.5 55%
Table 2. Summary of actual and estimated task duration in Experiment 2.
Group Task
Mean Actual Time (&SDs) to Complete (Minutes) Mean Estimated (&SD) Time (Minutes) Median Estimated Time (Minutes) Mode Estimated Time (Minutes) Mean Signed Error (Minutes) Percentage of Participants who Overestimated
Proofreading 24.5 (9.2)
23.7 (9.9)
20.0 20.0 -.78 50%
Written Report 22.3 (5.0)
28.2 (14.0)
30.0 30.0 +5.9 60% Group 1
Contact Detail Look-up 30.6 (7.1)
25.3 (11.3)
30.0 30.0 -5.3 40%
Scheduled separately: Summed Proofreading, Written Report & Contact Detail Look-up
77.5 (14.3)
77.3 (26.3)
72.5 65.0 +.25
Scheduled as Group: Balance Sheet, Order Documents & Library Subscription Details
71.6 (10.1)
59.0 (22.4)
60.0 60.0 -12.6 20%
Balance Sheet 22.2 (10.3)
22.6 (9.8)
20.0 20.0 +.4 50%
Order Documents 18.7 (3.1)
25.8 (10.3)
20.0 20.0 +7.1 80% Group 2
Library Subscription Details 35.7 (6.9)
36.2 (9.4)
35.0 30.0 +.55 60%
Scheduled separately: Summed Balance Sheet, Order
Documents & Library Subscription Details
76.6 (15.2)
84.7 (20.1)
85.0 70.0 +8.05
Scheduled as Group: Proofreading, Written Report & Contact Detail Look-up
85.5 (16.4)
59.6 (21.2)
MASSEY UNIVERSITY
MASSEY RESEARCH ONLINE http://mro.massey.ac.nz/
Massey Documents by Type Working and Discussion Papers
The effect that rounding to prototypical
values has on expected duration estimation accuracy
Forsyth, Darryl
2006
http://hdl.handle.net/10179/634