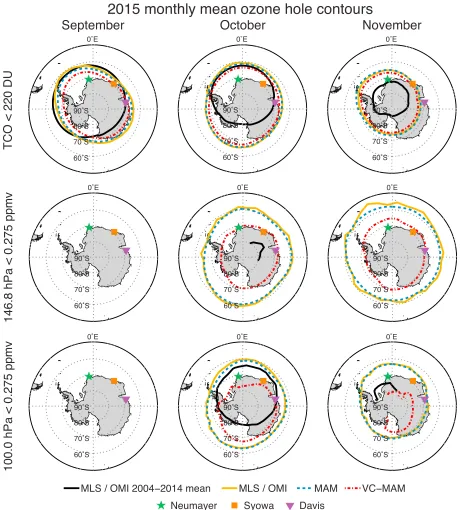
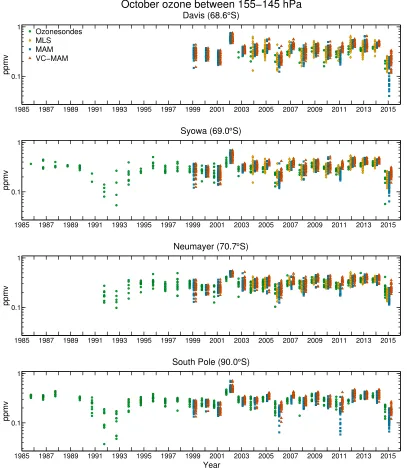
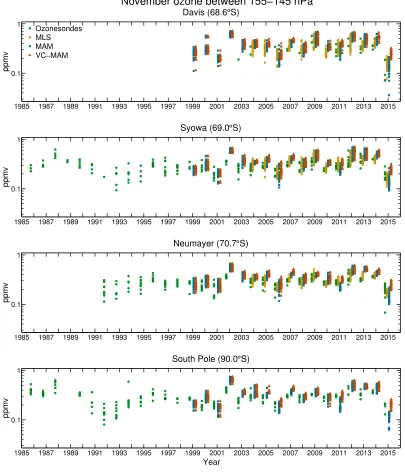
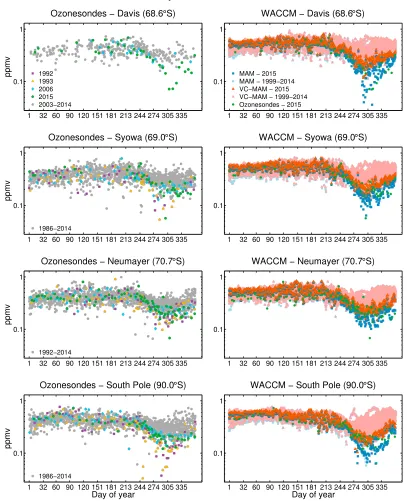
Observing the impact of Calbuco volcanic aerosols on south polar ozone depletion in 2015
Full text
Figure

Related documents
For example, patients with high TMB may be more likely to respond to a single-drug immunomodu- latory treatment, while patients bearing an intermediated mutational load could
As a result of this work, financial advisors can be better equipped to identify signs of financial trauma in themselves and their clients, develop an awareness of the
Numerical experiments show that tightening borrowing constraints leads to more intervivos transfers geared towards younger children and lower level of bequest.. Borrowing
The goals of this plan were to improve the searching skills of the medical residents, to increase the residents’ use of evidence-based decision making, to enable the librarians to
Unlike traditional project management, Integrated Systems Project Management (ISPM) has a specific focus on software platforms, communications methodologies, device
Locations of 12 altimetry ground track points considered to study spectral analysis in deep ocean and shallow-water areas.. Figure 4 shows the spectra of three points along T /
Methods: One hundred ninety seven patients with ischemic stroke were recruited and their blood samples were collected at 24 h, 1 week, 4 weeks, 24 weeks and 48 weeks after
Methods: The DNA of 471 subjects [133 subjects with angiographically documented left main coronary artery disease (LMCAD), 241 subjects with more peripheral coronary artery
