City, University of London Institutional Repository
Citation
:
van der Meulen, M. (2008). The Effectiveness of Software Diversity. (Unpublished Doctoral thesis, City University London)This is the accepted version of the paper.
This version of the publication may differ from the final published
version.
Permanent repository link:
http://openaccess.city.ac.uk/19624/Link to published version
:
Copyright and reuse:
City Research Online aims to make research
outputs of City, University of London available to a wider audience.
Copyright and Moral Rights remain with the author(s) and/or copyright
holders. URLs from City Research Online may be freely distributed and
linked to.
City Research Online: http://openaccess.city.ac.uk/ publications@city.ac.uk
Meine Jochum Peter van der Me'ulen
Centre for Software Reliability
City University
London ECl V OHB
United Kingdom
December 2008
IMAGING SERVICES NORliH
Boston Spa, Wetherby
West Yorkshire, LS23 7BQ
www.bl.uk
lHE FOLLOWING HAVE BEEN REDAC1ED AT THE
REQUEST OF THE UNIVERSITY
EPIGRAPH ON PAGE
71
PUBLISHED ARTICLES ON PAGES
111-125, 127-139,
I grant powers of discretion to the University ~ibrarian to allow this thesis to be copied in whole or in part without further reference to me. This permission covers only single copies made for study purposes, subject to normal conditions of acknowledgement.
Contents
List of Tables 8
List of Figures 11
Acknowledgements 13
Abstract 15
1 Introduction 17
1.1
Background17
1.2
Terminology .. . .
.
. ....
19
1.3
The Quest . .· ....
20
1.4
The Online Judge.·
....
...
21
1.5
Research Questions . ....
24
2 Research in Software Diversity 27
2.1
Introduction. . ....
27
2.2
Diversity Experiments·
....
28
2.2.1
Overview....
· ... . ....
28
2.2.2
Knight and Leveson...
30
2.3
Commercial Software . . .31
2.3.1
Seismic Data Processing ..31
2.3.2
SQL Servers. .32
2.3.3
Smart Sensors32
2.4
Fault Injection...
332.5 Recovery Blocks . . . .
2.6 Modelling of Software Diversity.
2.6.1 Eckhardt and Lee ..
2.6.2 Littlewood and Miller
2.6.3 Strigini and Popov
3 Experiments
3.1 Selection of Problems
3.2 Selection of Programs
3.2.1 For all Analyses
3.2.2 For the Analysis of Run-Time Checks
3.2.3 For the Analysis of Software Metrics
3.3 Test Harness
3.4 Analysis...
3.4.1 l\1ain Parameters
3.4.2 Parameters of C and C++ Programs .
3.4.3 Graphs for Software Diversity.
3.4.4 Outliers....
3.5 Problems Encountered
4 Results
4.1 Introduction.
4.2 General Observations ..
4.3 Debugging Process . .
4.4 Multiple-Version Software Diversity.
4.5 Language Diversity.
4.6 Run-Time Checks.
4.7 Software l\letrics
4.8 Validity of the Results
5 The Approach and its Validity 5.1 Introduction.
5.2 Advantages
5.2.1
5.2.2
Access to a Diverse Participant Population
Bringing the Experiment to the Participant
5.2.3 Motivational Confounding .
5.2.4 High Statistical Power . . . . .
5.2.5 Cost Savings . . .
5.2.6 Validation across Problem Domains
5.3 Disadvantages...
5.3.1 Multiple Submissions.
5.3.2 Lack of Experimental Control .. .
5.3.3 Self-Selection . . . . .
5.3.4
5.3.5
5.3.6
Dropout . . .
Small Size of the Programs
Abnormal Debuging Process
6 Further Research
6.1 Correlation with Country
6.2 Psychology . . . .
6.3 Correlation Between Faults
6.4 Priors for Bayesian Analysis .
6.5 Bigger Programs . . . .
6.6 Other m-out-of-n Configurations
7 ConclU:sion
References
Names Index
A Problems Analysed
A.l Properties of the Specifications
A.2 Specifications used in the Publications
A.3 Problem Domains . . . .
B Problem Analysis 99
B.1 Directory Structure. 99
B.2 Extracting E-mails . · 102
B.3 Extracting Source Code · 102
B.4 Compiling Source Code · 103
B.5 Running the Programs . · 103
B.6 Generating Standard Graphs · 105
B.7 Example Session
...
· lOGC
Publications 109C.1 TUV Symposium 2004 · 110
C.2 Safecomp 2004 · 12G
C.3 ISSRE 2004 . · 140
C.4 ICCBSS 2005 · 153
C.5 EDCC 2005 . · 1G4
C.G Safecomp 2005 · 17G
C.7 Safecomp 200G · 191
C.8 ISSRE 2007 .. .206
List of Tables
1.1 Distribution of the authors over continents and countries. 22
2.1 Some software diversity experiments. . . .. 29
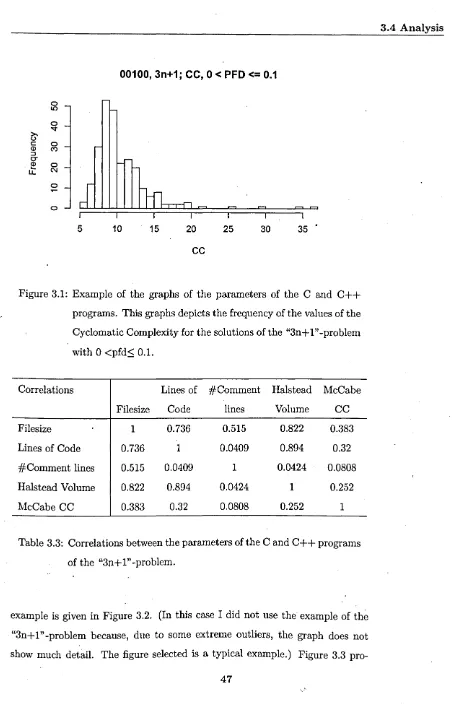
3.1 11ain parameters calculated for the "3n+1"-problem. . . .. 45 3.2 Parameters of the C and C++ programs of the "3n+l"~problem. 46 3.3 Correlations between the parameters of the C and C++
pro-grams of the "3n+l"-problem. . . . 47
6.1 For two faults in the "3n+1"-problem and their common occur-rence: the equivalence classes in which they occur, the number of programs which contain them and their probability. . . .. 73
D.1 Directory structure for conducting the experiments. . . 100 B.2 Fields in the file History.txt .. ' .
C.1.1 FMEA of power supply . . .
C.1.2 FMEA of electrical output subsystem .. . C.1.3 FMEA of sensor subsystem. . . . . . C.1.4 FMEA of communications interface. C.1.5 FMEA of data processing subsystem.
..
C.1.6 FMEA of human interface. C.1.7 FMEA of clock signal. . . .
. . 101
· 122 . .. 122 .123 · 123 .124 · 124 · 124 C.1.8 Rating of failure modes with respect to common cause failure. . 125
C.2.2 Population vFinal: equivalence classes. . . . . 132
C.2.3 Mean difficulty values for different program populations. . 135
C.2.4 Comparison of expected probability of failure on demand. . . 136
C.3.1 Example program with typical algorithm. . 143
C.3.2 Equivalence classes and faults. . . 145
C.3.3 The probability of .staying in the same equivalence class and
other parameters. . . 147
C.3.5 Expected pfd's, from [2]. 149
C.3.6 Transitions from equivalence classes EC01 to EC36 to
equiva-lence classes ECOO to EC:36 . . . 152
C.5.1 Some statistics on the three problems .. · 1G8
C.G.1 Some statistics on the three problems .. · 179
C.6.2 Classification of execution results with plausibility checks. . 180
C.6.3 Classification of execution results with self-consistency checks. 181
C.7.1 Sample inputs and sample outputs for the primary. . 194
C.7.2 Sample inputs and sample outputs for the checker. . . 195
C.7.3 Classification of execution results with UTCs.. . . 196
C.7.4 Most frequent equivalence classes in the first submissions for the
primary. . . 199
C.7.5 Most frequent equivalence classes in the first submissions for the
checker. . . '. . . 200
C.9.1 Statistics on submissions to the "3n+1"-problem.
C.9.2 Example program with typical algorithm . . .
C.9.3 Additional improvements for the language pairs.
C.9.4 Equivalence classes and faults for the first submission of the · 217
· 217
.222
List of Figures
1.1 Authors' Birth years .. . . . . 23
2.1 Primary/Checker model. .
2.2 An example of a wrapper in a boiler control system.
3.1 Example of the graphs of the parameters of the C and C++ 38
39
programs. . . .. 47
3.2 Example of the graphs of the correlation between parameters of
the C and C++ programs. . . .. 48
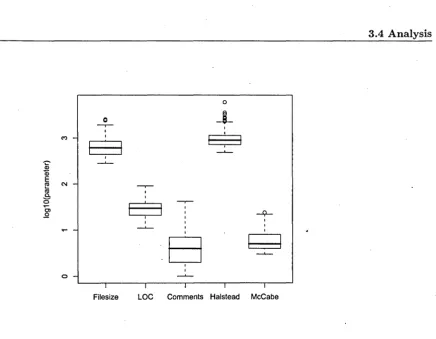
3.3 Box and whisker plot of the main parameters.of the correct
pro-grams of the "Archeologist"-problem. . . . . 49
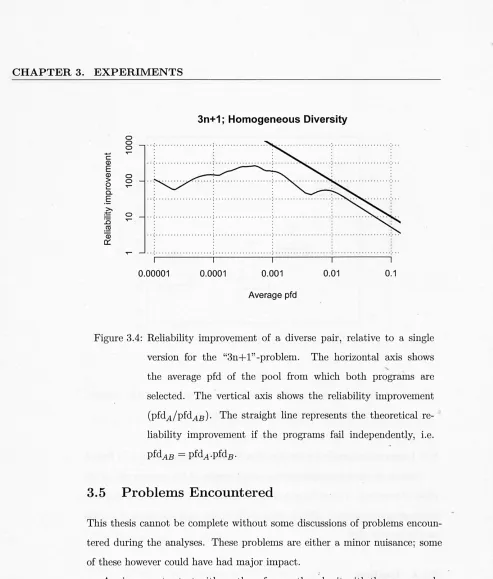
3.4 Reliability improvement of a diverse pair, relative to a single
version for the "3n+ 1" -problem. . . . 50
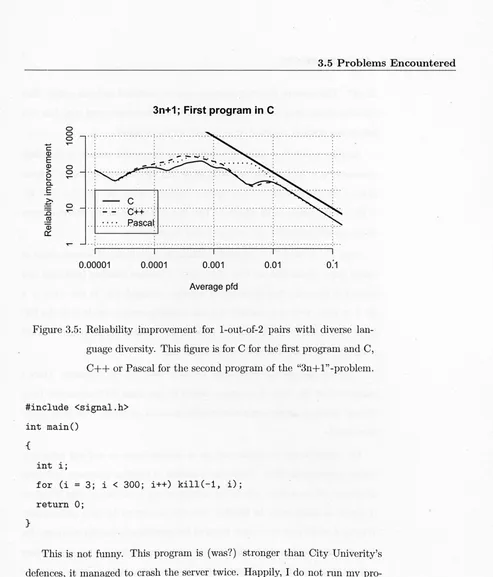
3.5 Reliability improvement for 1-out-of-2 pairs with diverse
lan-guage diversity. . . . . 51
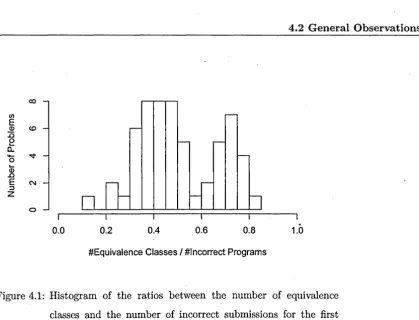
4.1 Histogram of the ratios between the number of equivalence classes
and the number of incorrect submissions for the first attempt. . . 57
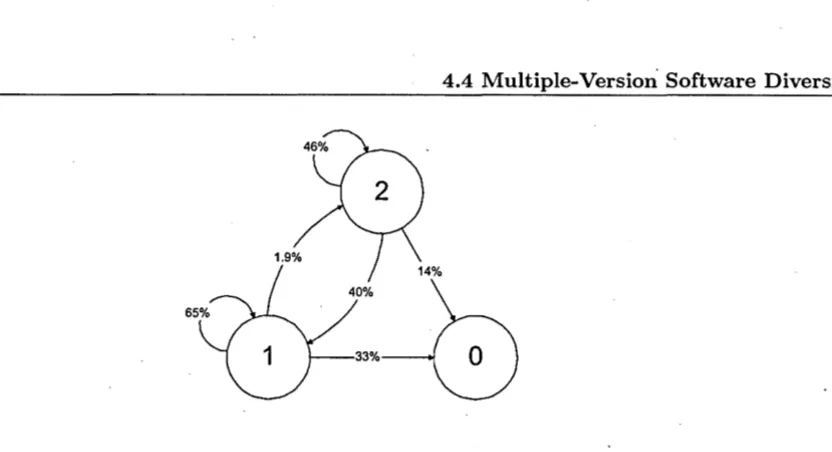
4.2 Transitions between equivalence classes wIth a given nUlllber of
faults for the "3n+1"-problem. . . . . 59
. C.l.l' Generic model of the design of a smart sensor. . 115
C.2.1 Failure regions for some of the infrequent equivalence classes . . . ' 132
C.2.2 Difficulty function for the vI population. . . . . . . 133
C.2A Adjusted difficulty function for the vFinal distribution. . . . . . 135
C.3.1 Number of submissions until last or correct solution per author. 142
C.3.2 Failure sets for the equivalence classes. 146
C .3.3 Reliability profile (successive releases). . 147
C.3A Difficulty function for the final version of the "3n+1"-problem. 148
C.3.5 Difficulty function for the final version of the alternate problem. 149
CA.1 The boiler control system used as an example. . . . . 156
C.5.1 Reliability improvement over a single version for the
"3n+1"-problem . . . 173
C.5.2 Reliability improvement over a single version for the
"Factovisors"-problem. . . 174
C.5.3 Reliability improvement over a single version for the "Prime
Time" -problem . . . :. . 175
C.G.1 The improvement of the pufd for the "3n+1"-problem. 182
C.6.2 Values of the error detection coverage. . . 183
C.6.3 Improvement in the average pufd of the primary for the various
self-consistency checks for "3n + 1". . . 18'4
C.6A Improvement in the average pufd of the primary for
combina-tions of run-time checks for "311+1". . . 185
C.G.5 The effectiveness of the run-time checks for "Factovisors". . 186
C.6.6 The effectiveness of the run-time checks for "Prime Time" . 187
C.6.7 Improvement of the pufd of a pair of randomly chosen C
pro-grams for "3n + 1" , over a single version. . 188
C. 7.1 Primary/Checker model. . . . . . 193
C.7.2 Histograms of the pfd's of the primaries and the pufd with RTC8.201
C.7.3 The improvement of the pufd for various run-time checks . . . 202
C.7A The effectiveness of the eight run-time checks with decreasing
LIST OF FIGURES
C.7.5 Improvement of the pufd of a pair of randomly chosen primaries,
relative to a single version . . . ~ . . . 204
C.S.1 Histograms of internal software metrics of the correct
submis-sions for the "Unidirectional TSP" -problem. . . 20S
C.S.2 Histograms of the correlations between the various internal
soft-ware metrics. . . ... . . 209
C.S.3 Density plots of the LOC/Volume and LOC/CC distribution of
all correct programs of all specifications combined. . . . . 210
C.S.4 Histograms of the ratio of internal metrics of correst programs
and incorrect programs. . . 211
C.S.5 Histograms of the correlations between various internal software
metrics and PFD or Number of Defects. .212
C.9.1 Failure sets for the equivalence classes. .21S
C.9.2 Reliability improvement of a diverse pair, relative to a single
version. . . . 21S
C.9.3 Relative frequency of occurrence rates of equivalence classes for
loops. . . . . 219
C.9.4 Difficulty functions for three pools with different pfd. . . . . 220
C.9.5 Reliability improvement for 1-out-of-2 pairs with diverse
lan-guage diversity . . . 220
C.9.6 Histogram of the number of submissions used for the specifications.221
C.9.7 The reliability improvement of multiple-version diversity. . . . . 221
C.9.S Histograms of the PFD improvement of implementing 1-out-of-2
diversity for the sixty specifications. ..\ . . . 222
11
Boston Spa, Wetherby
West Yorkshire, LS23 7BQ
www.bl.uk
MISSING PAGE/PAGES
Acknow ledgeIllents
One of the deepest wishes in my life has been to get a PhD. Until now, I have
not succeeded, in spite of the many opportunities that presented themselves.
After my MSc thesis at Philips Research, I turned down the offer to start a
PhD project there; at the time I thought it was wiser to get work experience; a
decision I still think was right. Later, I got another opportunity at the Dutch
Organisation for Applied Scientific Research. This attempt soon failed, because
the idea I had was not really good enough. Then, around 2001, I started writing
a thesis b~ed on an old idea of mine: the design of asynchronous fault-tolerant
logic. In spite of this being a great idea, I aborted this attempt because I had
accepted a job at City University in London in the beginning of 2003.
Now, finally, the moment has come close. This is entirely due to the
oppor-tunities City University gave me. Although my assignment was to be a Research
Fellow and do various research assignments, mainly for Lorenzo Strigini, I was
given many opportunities to find my own way and to investigate my own ideas.
After three years, I assembled enough material to continue some of the research
independently and write my thesis.
Therefore, my sincerest gratitude goes to City University. With the risk of
omitting people, I wish to name Lorenzo Strigini aIid Bev Littlewood first, for
their many positive remarks and challenging attitude; Robin Bloomfield for his
support; Peter Bishop for the enormous knowledge he shared with me.
Miguel Revilla plays a central role, because he selflessly provided the
pro-grams submitted to the Online Judge. This is something I almost did~'t dare ask, but Miguel immediately reacted with the utmost enthusiasm. And of
contributed to my work.
I also wish to thank Andrey Povyakalo for introducing me to the statistical
package R, and helping me to use it; Kizito Salako for invaluable discussions
on the Eckhardt & Lee model and its extensions; Peter Popov for his insights
on almost every part of the work; Kostas Tourlas for the help in writing bash
scripts and C programs; Ton van Boven for maintaining my Linux server which
safely ran cxperiments in the silence of the basemcnt of his house.
Three month of the research were done at the Budapest University of
Tech-nology and Economics, Department of Merumrcment and Information Systems,
in which time Andras Pataricza provided me with all the necessary resources.
Finally, I thank Vikt6ria Kaposi, my wife,. who supported me at all times,
and Andreas Jan, my son, who made me realize that it is time to finish the
Abstract
This research exploits a collection of more than 2,500,000 programs, written to over 1,500 specifications (problems), the Online Judge programming competition. This website invites people all over the world to submit programs to these specifications, and automatically checks them against a benchmark. The submitter receives feedback, the most frequent responses being "Correct" and "Wrong Answer".
This enormous collection of programs gives the opportunity to test common assumptions in software reliability engineering about software diversity, with a high confidence level and across several problem domains. The previous research has used collections of up to several dozens of programs for only one problem, which is large enough for exploratory insights, but not for statistical relevance.
For this research, a test harness was developed which automatically extracts, compiles, runs and checks the programs with a benchmark. For most problems~ this benchmark consists of 2,500 or 10,000 demands. The demands are random, or cover the entirety or a contiguous section of the demand space.
For every program the test harness calculates: (1) The output for every demand in the benchmark. (2) The failure set, i.e. the demands for which the program fails. (3) The internal software metrics: Lines of Code, Halstead Volume, and McCabe's Cyclomatic Complexity. (4) The dependability metrics: number of faults and probability of failure on demand.
The only manual intervention in the above is the selection of a correct program. The test harness calculates the following for every problem: (1) Various characteristics: the number of programs submitted to the problem, the number of authors submitting, the number of correct programs in the first attempt, the average number of attempts until a correct solution is reached, etc. (2) The grouping of programs in equivalence classes, i.e. groups' of programs with the same failure set. (3) The difficulty function for the problem, i.e. the average probability of failure of the program for different demands. (4) The gain of multiple-version software diversity in a l-out-of-2 pair as a function of the pfd of the set of programs . . (5) The additional gain of language diversity in the pair. (6) Correlations between internal
metrics, and between internal metrics and dependability metrics.
This research confirms many of the insights gained from earlier studies: (1) Software diversity is an effective means to increase the probability of failure on demand of a l-out-of-2 system. It decreases the probability of undetected failure on demand by on average around two orders of magnitude for reliable programs. (2) For unreliable programs the failure behaviour appears to be close to statistically independent. (3) Run-time checks reduce the probability of failure. However, the gain of run-time checks is much lower and far less consistent than that of multiple-version software diversity, i.e. it is fairly random whether a run-time check matches the faults actually made in programs. (4) Language diversity in a diverse pair provides an additional gain in the probability of undetected failure on demand, but this gain is not very high when choosing from the programming languages C, C++ and Pascal. (5) There is a very strong correlation between the internal software metrics .
. The programs in the Online Judge do not behave according to some common assumptions: (1) For a given specification, there is no correlation between selected internal software metrics (Lines of Code, Halstead Volume and McCabe's Cyclomatic Complexity) and dependability metrics (pfd and Number of Faults) of the programs jmplementing it. This result could imply that for improving dependability, it is not effective to require programmers to write programs within given bounds for these internal software metrics. (2)
Boston Spa, Wetherby
West Yorkshire,
LS23 7BQwww.bl.uk
MISSING PAGE/PAGES
~,
Chapter
1
Introduction
There never were, in the world, two opinions alike, no
more than two hairs, or two grains; the most universal
quality
isdiversity.
Michel Eyquem de Montaigne (1533-1592)
1.1
Background
In this age of automation, software dependability is a major concern. In 1994,
Peter Neumann [53], Donald }v1cKenzie [44] and Les Hatton [27] published lists
of software-related incidents. The lists show that the cost of software failure can
be very high, both in terms of risks to human life and well-being as to economy.
Up to the present day, Peter Neumann continues publishing incidents in his
RISKS forum on the internet, and there is no reason to believe the problem has'
disappeared.
There are therefore good reasons to increase the dependability of software,
and there. are many ways to do so: testing, quality control, design, etc. One
example.
Lee and Anderson [3] were very early in publishing their work on
fault-tolerance, "Fault Tolerance; Principles and Practice". In one of the chapters
they propose a list of practices for software fault tolerance, which also addresses
some words to software diversity. Voges [65] edited the book "Software Diversity
in Computerized Control Systems" in 1988, showing the interest in that issue
at that time.
Also in the 1980s, various researchers addressed the issue of software
diver-sity in experiments, see Section 2.2. They were able to prove beyond doubt
that it was an effective measure to increa..,e software dependability. Also,
math-ematical theories behind software diversity were developed, see Section 2.6.
The growing awareness also found its way into standardization, especially
concerning safety. Germany was early; employees at the TUV, Holscher and
Rader, wrote "Microcomputer in der Sicherheitstechnik" [30] in HJ84. Their
"
ideas were later implemented in DIN-19250 [13] and VDE-0801 [14]. Then
many countries and organisations (for automotive, defence, space, rail, aviation,
healthcare, etc. applications) derived their own guidelines and standards.
The International Electrotechnical Committee, IEC, took up the task and
wrote what is now called IEC61508 [32]. IEC61508 mentions diverse
program-ming in Table A.2, item 3c. It is Recommended (R) for SILl to SIL3 and Highly Recommended (HR) for SIL4. IEC61508 describes diverse programming as
fol-lows:
Aim: Detect and mask residual software design and implementation faults
during execution of a program, in order to prevent safety critical failures of the
system, and to continue operation for high reliability.
Description: In diverse programming a given program specification is
de-signed and implemented N times in different ways. The same input values are
given to the N versions, and the results produced by the N versions are compared.
If the result is considered to be valid, the result is transmitted to the computer
outputs. The N versions can run in parallel on separate computers,
1.2 Terminology
to an internal vote. Different voting strategies can be used on the N versions,
depending on the application requirements, as follows.
• If the system' has a safe state, then it is feasible to demand complete
agreement (all N agree) otherwise an output value is used that will cause
the system to reach the safe state. For simple trip systems the vote can be
biased in the safe direction. In this case the safe action would be to trip
if either version demanded a trip. This approach typically uses only two
versions (N=2).
.
• For systems with no safe state, majority voting strategies can be employed.
For cases where there is no collective agreement, probabilistic approaches
can be used in order to maximise the chance of selecting the correct value,
for example, taking the middle value, temporary freezing of outputs until
agreement returns, etc. This technique does not eliminate residual
soft-ware design faults, nor does it avoid errors in the interpretation of the
specification, but it provides a measure to detect and mask before they can
affect safety.
This describes software diversity very well. In this thesis, I will only address
the case where N=2, often referred to as a 1-out-of-2 system.
1.2 Terminology
The previous section already shows that software diversity is known under
dif-ferent names. Roughly in order of the year of first appearance, authors and
standards refer to it as "dual programming" [22], "parallel progranlming" [22],
. "dual code" [22, 63], "distinct software" [23], "N-version programming" [4],
"dissimilar software" [42], "multi-version software" [17, 33, 35, 37], "software
diversity" [24], "multi-version programming" [36], and "diverse programming"
[32].
I will use the term "multiple-version software diversity" and its shorthand
the others, except that it seems to fit best to earlier work done at the Centre
for Software Reliability.
1.3 The Quest
When I arrived at the Centre for Software Reliability, in February 2003, I
joined a group with a respectable background in the research of software
diver-sity. I was presented the work on modelling software diversity (the Eckhardt &
Lee model, and its extension the Littlewood & l\1iller model) and the research
project DOTS, "Diversity with Off-The Shelf Components" .
The approach to modelling software diversity at CSR is primarily
theoret-ical. With their mathematical background, Kiiito Salako and Bev Littlewood
were working on theoretical aspects of the modelling (e.g. [59]). It was clear that-with my background-my focus would be more pragmatic and, within
the framework of DOTS, Lorenzo Strigini motivated me to st,art thinking and
writing about smart sensors and the use of software diversity [46]. This made
me very aware of the difficulty of doing this kind of research. Although
in-I
teresting observations can be made, it is hard to give hard recommendations,
because their effectiveness can not be measured.
One of my research interests has always been the verification of "facts" vs.
"urban legends". In the field of software diversity, there are many of these. The
fact that software diversity helps improve reliability is fairly well researched,
how much improvement is far more an educated guess, since large collections"of
data have not been used for testing hypotheses of this kind. Other assumptions,
for example about the effectiveness of language diversity in a 1-out-of-2 pair,
have never been measured.
Another observation I made is that the Eckhardt & Lee model is elegant in
its simplicity, and is useful for many a philosophical discourse, but has never
really been applied. \Vhat does a difficulty function look like? What happens
if you multiply real difficulty functions? In other words, in my pragmatic mind,
it needed some legs to stand on to get some grasp of its usefulness.
1.4 The Online Judge
effectiveness, and apply the Eckhardt & Lee model-I needed a large set of programs written to the same specification. I started my quest, and quickly
find out that indeed some interesting examples exist of these.
One example is chess programs. They are written to a very precise
spec-, ificationspec-, and dozens of chess programs can easily be found. Howeverspec-, these
programs struck me as too compli~ated for my analyses.
Then a simpler game "Rock, Paper, Scissors", is the subject of "The
In-ternational RoShamBo Programming Competition". Not only are there many
programs written for this specification, they are also available: all the best
programs of the 1999 competition can be downloaded at https:/ /www. cs.-ualberta. ca/-darse/rsbpc .html. This game is a rather interesting
program-ming challenge, because at first sight it seems that there is only one strategy:
play random. However, as can be easily seen, a random program will also
ran-domly win and lose, and therefore will never win a competition. In spite of the
availability of several dozens of programs and the simplicity of the specification,
I decided not to take this route, because the difference between these programs
is strategy. This will be very hard to analyse. Apart from that, it does not
re-ally fit the concept of software diversity, since that normre-ally addresses programs
that aim at producing the same output.
Of course there are also nlany commercial programs with comparable
spec-ifications, for example spreadsheets, word processing, and smart sensors. This
is certainly a possible way forward, but I decided not to pursue it, because it
has been tried by others before, see Section 2.3.
Many attempts later, I arrived at the website of the Online Judge. lt
pre-sented me a very large set of specifications, and also prepre-sented some statistics.
It showed that very many programs were written to each specification. I realized
that this could give me the opportunity I had been looking for.
1.4 The
Onli~eJudge
The "UVa Online Judge" -Website,
specifi-Continent % Country %
Africa 0.7
Asia 51.4 Bangladesh 13.1
China 11.8
Hong Kong 2.4
India 2.1
Indonesia 2.4
Japan 1.3
Korea 1.9
Taiwan 13.8
Oceania 1.4 Australia 1.2
Europe 25.5 Bulgaria 1.0
France 1.4
Germany 1.4
Poland 3.0
Portugal 1.4
Russia 5.0
Spain 1.9
Ukraine 1.2
North America 12.2 Canada 2.5
USA 9.7
South America 8.7 Brazil 4.7
l\1exico 1.2
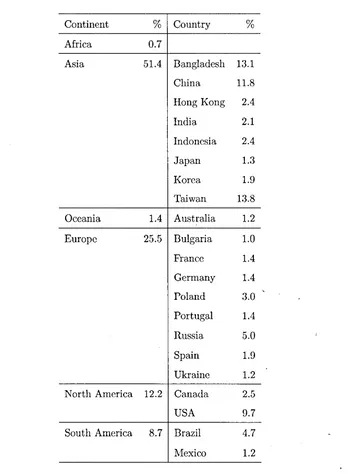
Table 1.1: Distribution of the authors over the continents, and the countries
with more than 1% of the authors (as of l\1ay 2004).
cations for which anyone may submit programs in C, C++, Java or Pascal.
The correctness of a program is automatically judged by the "Online Judge".
l'v1ost authors submit programs repeatedly until one is judged correct. Many
[image:24.542.142.492.87.561.2]o
g
-N
o
g
-o
g
-o
o
-I{)
u
/ '00
i \
I
0o \
j
01 \ 0
o 0
poO' \
. 00 0
o _pooooooooooooo oOooe
I I I I I I I
1960 1965 1970 1975 1980 1985 1990
Birth Year
1.4 The Online Judge
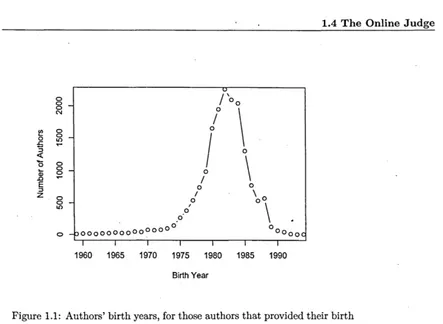
Figure 1.1: Authors' birth years, for those authors that provided their birth
year (as of May 2004). 0
5,000,000 programs for the approximately 1,500 specifications on the website.
Most of my research has been done using the data available in May 2004:
2,545,979 submissions for around 1,500 problems.
Table 1.1 shows the distribution of the authors over the continents and
coun-tries. It appears that they are located all over the world, with some countries
being surprisingly productive and Africa almost absent. Figure 1.1 shows the
birth year of the authors. It appears most of the authors are between 18 and 25
years old, i.e. they are most probably university students. The average birth
date is in July 1981, i.e. the average age is around 22 at the time of submission.
The Online Judge generates feedback to the author of a program, which is
one of the ~ollowing:
Correct (AC). The program's output matches the Online Judge's 'Output.
Wrong Answer. (WA). The output of the program does not match what
the Online Judge expects.
[image:25.513.48.491.61.385.2]produces correct output for the Online Judge's secret data but does not produce
it in the correct format.
Runtime Error (RE). This error indicates that the program performs
an illegal operation when running on the Online Judge's input. Some illegal
operations include invalid memory references such as accessing outside an array
boundary. There are also a number of common mathematical errors such as
divide by zero error, overflow or domain error.
Time Limit Exceeded (TL). The Online Judge has a specified time limit
for every problem. When the program does not terminate in that specified time
limit this error will be generated.
Compile Error (CE). The program does not compile with the specified
language's compiler.
Memory Limit Exceeded (ML). The program requires more memory to
run than the Online Judge allows.
Output Limit Exceeded (OL). The prograrn produce~ more than 4 MD
output within the time limit.
Restricted Function (RF). The program uses some system function call
or tries to access files.
.
.
In my experiments I only use programs that are either classified as accepted
(AC), wrong answer (WA) or presentation error (PE), see Section 3.1.
1.5 Research Questions
The quantification and analysis of the various aspects of software diversity
requires the availability of large amounts of p~ograms written to the same
spec-ification. This is exactly what the Online Judge can provide. Therefore, the
use of the programs provided by the Online Judge gives a unique opportunity
to research software diversity.
The main questions I try to answer in this research project are:
• How effective is multiple-version software diversity as a means to enhance
1.5 Research Questions
• How effective is language diversity as a means to increase the effectiveness of multiple-version software diversity?
• How effective are run-time checks? (Run-time checks constitute a special variety of software diversity.)
Boston Spa, Wetherby
West Yorkshire, LS23 7BQ
www.bl.uk
MISSING PAGE/PAGES
"Chapter
2
Research in Software Diversity
The greatest of faults, I should say, is to be conscious
of none.
Thomas Carlyle (1795-1881)
This chapter presents the existing theory in software diversity in order to
provide the necessary background for the experiments. It also describes some
relevant existing case studies, which will later be used to put the results of the
experiments into perspective.
2.1 Introduction
As explained in the introduction, this research addresses the effectiveness of
software diversity using a large set of programs submitted to an on-line
pro-gramming ~ompetition. Although this has not been done before there is other· research addressing similar issues. In this chapter I will sketch out this related
research and my work: within this context.
Starting in the 1980s, there have been quite a few experiments in which
some of these in Section 2.2.
A possible way to circumvent much of the criticism on these experiments
(and my work) is to analyse various commercial software packages implementing
the same application. I will address this approach in Section 2.3.
In all of the above research, the basic idea is that different versions of the software are generated because different programmers/design teams make
dif-ferent mistakes. Another approach to get many difdif-ferent versions of programs
is fault injection. I will address this in Section 2.4.
A related strategy for software fault tolerance is recovery blocks, which I
will address in Section 2.5.
Furthermore, I need to address the issue of how to model software
diver-sity, which is necessary to be able to do the calculations. I will address the
mathematical models for software diversity in Section 2.6.
2.2
Diversity Experiments
2.2.1 Overview
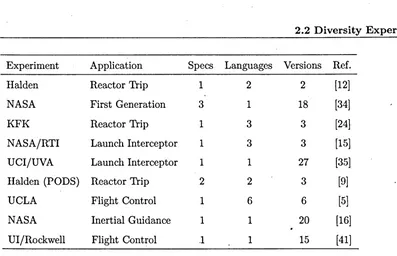
Peter Bishop compiled Table 2.1 [8], which shows some typical software diversity
experiments. J\1ost famous is the work of John Knight and Nancy Leveson,
per-formed in the 1980s, which includes one of experiments addressed (the Launch
Interceptor). I will describe this work separately in the next section.
Some of Peter Bishop's observations relevant to this thesis are:
1. A significant proportion of the faults is similar, and the major cause of
this is (the interpretation of) the specification [12, 24, 34]. The use
of relatively formal notations is effective in reducing specification-related
faults caused by incompleteness and ambiguity.
2. Some experiments address the impact of the choice of programming
lan-guage [5, 9, 12], and fewer faults seem to occur in .the strongly typed,
highly structured languages such as Modula-2 and Ada. However, the
choice of language seems to bear little relationship to the incidence of
2.2 Diversity Experiments
Experiment Application Specs Languages Versions Ref.
Halden Reactor Trip 1 2 2 [12]
NASA First Generation 3 1 18 [34]
KFK Reactor Trip 1 3 3 [24]
NASA/RTI Launch Interceptor 1 3 3 [15]
UCI/UVA Launch Interceptor 1 1 27 [35]
Halden (PODS) Reactor Trip 2 2 3 [9]
UCLA Flight Control 1 6 6 [5]
NASA Inertial Guidance 1 1 20 [16]
UI/Rockwell Flight Control .1 1 15 [41]
Table 2.1: Some software diversity experiments.
My research differs from these experiments in various ways:
1. The number of programs written to the same specification. The highest number of versions in these experiments is 27. There are other experi-ments with slightly higher numbers, e.g. by Per Runeson [58], but there are no experiments with thousands of versions.
2. The way the experiment is controlled. The amount of control in these ex-periments is typically very high. This cannot be said of the contributions to the Online Judge. Little is known about the programmers, except their nationality and age.
3. The programming languages used, and whether different programming languages are used for the different versions. Many experiments do ad-dress the issue of language diversity, some even forced it [40]. Some general observations pave been done but, given the low number of versions, no 'statistically relevant results are available.
[image:31.512.48.445.53.309.2](There are some different specifications of the same problem of the Online
Judge, I did however not analyse this.)
5. The size of the programs. The size of the programs written for the
ex-periments are typically up to 1000 lines of code. This is larger than the
programs written for the Online Judge. In both cases however, the
dif-ference with "real" software is big.
6. Realism of the experiment. In many of the experiments there was an
effort to provide a specification of a realistic problem. However, the
spec-ifications remained fictitious, and as such I don't see much difference with
the specifications of the Online Judge.
For a more elaborate discussions of the limitations of this research see
Chap-ter 5.
2.2.2 Knight and Leveson
In 1986, John Knight and Nancy Leveson reported an experiment in which
27 programmers, from two universities, programmed to the same specification,
describing a (fictitious) defence application launching a missile based on input
radar data [36]. The 27 programmers wrote programs in Pascal that varied
largely in size: from 327 to 1,004 lines of code. The programs were all submitted
to a random test with 1,000,000 demands, their probability of failure on demand
was in all cases lower than 0.01.
A major result was that the authors could reject the assumption of
inde-pendence of failure of the diverse versions to a high confidence level [8].
In a subsequent publication the authors investigated the effectiveness of
software diversity [35]. They were able to 'show that a three-version system,
with majority voting, yielded a reliability gain of a factor 20 to 50 over a single
version. Other researchers investigated the same dataset, e.g. Susan Brilliant
2.3 Commercial Software
2.3 Commercial Software
The ideal software diversity experiment is of course one in which "real" software
is used, i.e. different commercial implementations for the same application. In
theory this would be possible in many application domains, but it is in practice
difficult and very time consuming to do. This is because different commercial
packages are never exactly the same. Their inputs and output formats as well
as the results they provide may be different, and it is therefore hard to exercise
them in ways that are comparable. Additionally, even if a test harness can be
made, it may be hard to find faults, because each test may take ~ome time, and
it may be hard to run many tests.
In this section I wish to present the results of Les Hatton, who compared various seismic data processing packages, nir Gashi, who compared various SQL
servers, and myself on smart sensors.
The reader will notice that, although all these cases clearly give very useful
insights into the possible effectiveness of diversity, it is hard to see how they can
be used to quantitatively assess the possible reliability gain of using software
diversity.
2.3.1 Seismic Data Processing
In 1994, Les Hatton and Andy Roberts reported their findings concerning the accuracy of scientific software [29]. It concerns a four year study of nine
com-mercial seismic data processing packages written independently in the same
programming language and calibrated with the same input data and input
pa-rameters. They show that, after a normal processing sequence, the nine
pack-ages may differ in the first and second decimal place,' which essentially makes
these results useless. They also show that these differences are entirely due to
software errors.
The experiment is carried out in a branch of the earth sciences known as
seismic data processing .. Hatton and Roberts identified around fifteen
inde-pendently developed large commercial packages that implement mathematical
pro-gramming language (Fortran) in their experiments. They reported the results
of processing the same input dataset, using the same user-specified parameters,
for nine of these packages.
Hatton and Roberts show that the differences between the results of the
various packages are big, far bigger than the arithmetical precision, and that
the nature of the disagreement is non-random.
2.3.2 SQL Servers
nir Gashi [18, 19, 20] assessed the dependability gains that may be achieved
through software fault tolerance via modular redundancy with diversity in
com-plex off-the-shelf software. He used SQL database server products in his studies:
they are a very complex, widely-used category of off-the-shelf products.
Gashi used bug reports of the servers as evidence in the assessment: they
were the only direct dependability evidence that was found for these products.
He studied a sample of bug reports from four SQL database server products
(Postgre SQL, Interbase, Microsoft SQL Server, Oracle) and later relea..c;;es of
two of them to check whether they would cause coincident failures in:more
than one of the products. He found very few bugs that affect more than one
product, and none caused failures in more than two. Many of these faults
caused systematic, non-crash failures, a category ignored by most studies and
standard implementations of fault tolerance for databases.
For one of the products, he found that the use of different releases of the
same product appears to tolerate a significant fraction of the faults.
2.3.3 Smart Sensors
In sensors, a silent revolution has taken place: almost aU sensors now contain
software. This has lead to increased functionality, increased precision, and
other advantages. There are also disadantages. The "smart" sensors have
many more failure modes and they also introduce new mechanisms for common
mode failure. I investigated the issue in [45] (Appendix C.1).
sen-2.4 Fault Injection
sors vs. conventional ones using an Failure Modes and Effects Analysis. There
appear to be some significant differences. Some failure. modes do not exist in
conventional sensors, e.g. those involving information overload and timing
as-pects. Other failure modes emerge through the use of different technologies,
. e.g. those involving complexity, data integrity arid human interface. When
us-ing smart sensors I suggested the use of a set of guidelines for their deployment:
1. Do not send data to the smart sensor.
2. Use the smart sensor in burst mode only.
3. Use a smart sensor with the least possible number of operational modes.
4. Use the simplest possible sensor for the application.
In redundant sensor configurations (including those without diversity)
com-mon cause failure becomes the dominant failure scenario. The failure modes of
smart sensors suggest that smart sensors are more susceptible to common cause
failure than conventional ones. Dominant are failures that have their origin in
the human interface, complexity and information overload. The guidelines given
will also reduce the probability of common cause failure.
In redundant sensor configurations a possible design rnethod is the use of
diversity. Diversity has the advantage that it can reduce the probability that
two or more sensors fail simultaneously, although this effect is limited by the
fact that diverse sensors may still contain the same faults. A disadvantage of
diversity can be the increased cOInplexity of maintenance, which in itself can
lead to a higher probability of failure of the smart sensors. Whether the use of
diversity is advisable depends on the design of the sma~t sensors and the details of their application.
2.4 ., Fault Injection
It is possible to create many different programs, mutants, by changing a given
of changing programs is used in "mutation testing" [1, 54, 55, 64]. :Mutation
operators exist for various programming languages, e.g. C [1] and Ada [55].
The Diverse Software Project (DISPO) of the Centre for Software
Relia-bility (CSR, City University) and the Safety Systems Research Centre (SSRC,
University of Bristol), included a set of fault injection experiments [62,21,39].
One of the objectives of these experiments was to study the relationship
be-tween fault diversity and failure diversity, i.e. is there a correlation bebe-tween the
type/location of faults and software failure?
The types of faults injected in these experiments are mainly slips/mistakes,
and not the kind of faults that may be caused' by requirements ambiguities or
other higher-level misunderstandings. In [62], the author concedes that this
does not pose a major concern for testing the hypothesis, because the faults
are realistic; for testing the hypothesis it is not necessary tlla~, the faults reflect
all possible faults nor their distribution. Examples of injected faults ai'e
replac-ing
"<"
with">"
and"=="
with"=",
and are as such comparable to those suggested in mutation testing.The location of faults is varied by injecting faults in the different files that
constitute the entire program. In the experiment, mutants with a pfd higher
than 0.01 are discarded, because they are deemed to be unrealistic.
The experiments can not confirm a relationship between fault diversity and
fail ure di versi ty.
The experiments also lead to some other ,'results, one of which is relevant
for this thesis. When assuming that the mutants form the complete population
of possible programs, and that they are equiprobable (as the author points
out, these are both unlikely assumptions), 'pairs of programs in a 1-out-of-2
configuration fail on average more often than failure independence would imply.
The improvement of the pfd over a single version differs for various experiments,
2.5 Recovery Blocks .
2.5 Recovery Blocks
The recovery block scheme [31] [56] is a strategy for software fault tolerance
'which also employs software diversity. A recovery block consists of a
conven-tional block which is provided with a means of error detection (an acceptance
test) and zero or more stand-by spares (the additional alternates). If none of
. the alternate programs passes the acceptance test, there will be no result.
In contrast to l-out-of-2 systems, the recovery block scheme may also work
when the required output is not unique.
In 1988, Anderson et. al. [2] published the results of an experiment with a
realistic application, a command and control system constructed by professional
programmers to normal commercial standards. Several fault tolerance features
were added, including recovery blocks. In the experiment it was possible to
monitor the improvement of the reliability from the use of fault tolerance. The
experiment showed that 74% of the failures were masked by the use of software
fault tolerance.
2.6 Modelling of Software Diversity
The mathematical theory on modelling software diversity is not very large. Only
Eckhardt & Lee and Littlewood & Miller have made s~gnificant contributions to
mathematically understanding the mechanisms of software failure in redundant
configurations. Only recently, Lorenzo Strigini and Peter Popov added their
work on asymmetric software diversity, i.e. run-time checks and wrappers.
2.6.1 Eckhardt and Lee
The best known probability model in the domain of multiple-version diversity
is that of Eckhardt &, Lee [17]. The assumptions underlying the model are that:
1. Failures of an individual program are deterministic and a program version
either fails or suc~eeds for each input value x. The failure set of a program
7r can be represented by a "score function" w( 7r, x) which produces a zero
2. There is randomness due to the development process. This is represented
as the random selection of a program, II, from the set of all possible
program versions that can feasibly be developed and/or envisaged. The
probability that a particular version 'IT will be produced is P(II = 'IT).
3. There is randomness due to the demands in operation. This is represented
by the random occurrence of a demand, )(, from the set of all possible
demands. The probability that a particular demand will occur is P(X =
x), the demand profile.
Using these model assumptions, the average probability of a program version
failing on a given demand is given by the difficulty function, B(x), where:
B(x) = LW('IT,x)P(II = 'IT) (2.1)
The average probability of failure on demand of a randomly chosen single
program version IIA can be computed using the difficulty function f~r method
A and the demand profile:
pfdA := P(IIA fails on X)
=
L BA(X)P(X=
x) (2.2)x
The average pfd for a pair of diverse programs, IIA and lIB, assuming the
system fails when both versions fail, i.e. a 1-out-of-2 system. would be:
pfdAB
=
L BA(X)BB(X)P(X=
x) (2.3)x
The Eckhardt & Lee model assumes similar development processes for the
two programs A and B and hence identical difficulty functions, i.e. that B A (x) =
BB(X). Therefore, the average pfd for a pair o,f diverse programs is:
(2.4)
If the difficulty function is constant for all x, and therefore var x (B A (X),
BB(X)) = 0, the reliability improvement for a diverse pair will (on average)
satisfy the independence &'3sumption:
2.6 Modelling of Software Diversity
It is always the case that varx(OA(X)) ~ 0, and therefore:
(2.6)
In practice the variance plays an important role, and is often the main factor
of system unreliability. The intuitive explanation for this is that it is harder
for the program developers to properly deal with some demands. The difficulty
function will then be "spiky", and the diverse program versions tend to fail on
the same demands. Diversity is then likely to yield little benefit and pfdAB could be close to pfd A .
I will use the Eckhardt & Lee model in most of our multiple-veorsion diversity
experiments, except those with different programming languages.
2.6.2 Littlewood and Miller
In 1989, Littlewood and Miller published a generalization of the Eckhardt & Lee
model: the Littlewood & Miller extended model
[37].
The difference between the models is that Littlewood and ~diller do not assume that the developmentprocess of the two program versions is the same. Therefore, in their model the
difficulty functions may differ.
The average pfd for a pair of diverse programs, ITA and ITB, developed
using methods A and B (assuming the. system fails when both versions fail, i.e.
a 1-out-of-2 system) would be:
pfdAB := P(ITAfailsonX andITB fails on X) = I:OA(X)OB(X)P(X = x) (2.7)
x
And, as shown in
[37]:
(2.8)
Because COVX(OA(X),OB(X)) can be smaller than zero, the improvement'
can, in prin~iple, be' better than the independence assumption. The intuitive explanation of negative covariance is a circumstance where the "dips" in OA(X)
coincide with the "spikes" in OB(X), so the programs on average fail on different
demands, and the performance of the pair is better than under the independence
Input
Primary Primary Output ..
L
Checker Checker OutputFigure 2.1: Primary/Checker model.
We will use the Littlewood & Miller model in our language diversity
exper-iments with different programming languages.
2.6.3 Strigini and Popov
Doth the Eckhardt
&
Lee and the Littlewood&
Miller model consider symmet-rical redundancy, i.e. both channels have the same functionality. In practicehowever, there are many examples of systems where the redundancy is not
sym-metrical. Examples are wrappers and run-time checks. Lorenzo Str.igini and
Peter Povov work on modelling this kind of redundancy.
Figure 2.1 shows a possible model for asymmetric redundancy, most
ap-plicable to run-time checks. In this case the primary performs the intended
function. The checker observes the inputs and outputs of the primary and can
mark invalid outputs of the primary as such. It may not mark all invalid out-puts, this is often intended behaviour, the idea being that the checker contains
simple functionality only approximating or boundary checking the primary. ~ee
for a detailed discussion [51] and [48].
Now, assume a specification for the primary, S7r:
S7r(x, y)
==
"y is valid primary output for input x" (2.9)Then, we define the score function W7r for a random primary 7r as:
(2.10)
The score function is true when the primary 7r fails to compute a valid
2.6 Modelling of Software Diversity
p'
C --II~
Q) Rest of the
System (ROS) Boiler
T'
E
c:
Q
'> c:
W
Wrapper PID controller OTSC
BC'
Boiler S stem
Figure 2.2: An example of a wrapper in a boiler control system.
The behaviour of a checker a can be described as:
a(x, y)
==
"y
is accepted as valid primary output for inputx"
(2.11)Note the similarity to the specification of the primary, S7r. Whereas the spec-ification is supposed to be correct, we assume that the checker may be faulty: it may erroneously accept an incorrect pair (x, y). The checker fails if there is a discrepancy with the specification.' The score function Wq for the checker is:
wq(a, x, y)
==
S7r(x, y) EEl u(x, y) (2.12)The score function is true when the checker fails to recognize whether y is valid primary output for input x or not.
For our system, as depicted in Figure 2.1 and the variables
(x,rr,a)
for the input,the primary and the checker, there are four possibilities:1. -,w7r(7r, x) 1\ -,wq(u, x, 7r(x)): Correct operation.
3. w7r(7r, x) 1\ -,wq(a, x, 7r(x)): Detected failure.
I will use this model in our experiments with run-time checkers.
output of a control system (primary) and may in some cases replace the control
system's functionality when this fails. Figure 2.2 shows an example of a wrapper
in a boiler application. This example is further explained in [50]. When the
wrapper merely disconnects the output of the control system, it resembles a
Chapter
3
Experiments
Don't be too timid and squeamish about your actions.
All life is an experiment. The more experiments you
make the better.
Ralph Waldo Emerson (1803-1882)
This chapter presents the approach to the software diversity and other
ex-periments.
3.1 Selection of Problems
The Online Judge provides some 1,500 problems, which in theory can all be
analysed. It appears however that some problems are more suitable for analysis
than others. My mai~ selection criteria for selecting a program from the Online Judge are:
At least 1000 submissions to the problem exist, ,preferably
signif-icantly more. For the statistical analyses it is beneficial-if not e'ssential-to
The problem has a unique output for every input. If a problem does
not have a unique answer for every input, it is not possible to build a 1-out-of-2
system, which is the subject of the experiments. If the output deviates within
a given range from the correct output, I treat this as a correct output. This
may occur when the output is a real number. Since the specifications in general
do not specify the maximum deviation, I determined the range. Normally, the
range will at least cover deviations caused by rounding off.
The input can be automatically generated with relative ease. I
generate input files with in most cases contain 2,500 or even 10,000 demands.
It is not possible to create all these demands by hand.
The problems need to cover a mixture of problem domains. This
is necessary to be able to generalize the findings beyond one problem domain
(see Appendix A.3).
There are still many problems that fit these criteria, and I selected randomly
"
from those. This was mainly determined by the order of evaluation. I chose
the first program that seemed to match the criteria listed above.
3.2 Selection of Programs
3.2.1 For all Analyses
From the set of programs for a selected problem, I only use a subset. The
selection criteria are based on information provided by the Online Judge or on
the results of running the program with the benchmark. I used the following
criteria for selecting a progranl for the analysis (they are applied in the order
of the list):
Programs running under the Online Judge. I only use those programs
that have shown to run under the Online Judge, i.e. the Online Judge was
able to compile the program and to run it, and the prograrll would run using
prescribed time and memory resources. This first filter saves me much time,
3.2 Selection of Programs
Programs that succeed for at least _ one demand. I excluded the
completely incorrect submissions, because there is obviously something wrong
with these in a way that is outside my scope (these are often submissions to
the wrong specification, or incorrect formatting of the output, which was often
the case in specification 147 "Dollars").
First submission of each author. I only use one program submitted by
each author and discard all other submissions. These subsequent submissions
have shown to have comparable fault behaviour and this dependence between
submissions would complicate any statistical analysis.
Programs smaller than 40kB. I remove those programs from the analysis
that have a filesize over 40kB. This is the maximum size allowed by the Online
Judge, but was not enforced for a small period of time, and during this time
some authors managed to submit programs exceeding this limit. This restriction
only enforces a restraint that already existed in principle.
3.2.2
For the Analysis of Run-Time ChecksFor the analyses of run-time checks [51, 48], I only selected problems for which
a sensible run-time check can be formulated. Astonishingly, this is often not
the case. For example, for programs that only output Thue/False or Yes/No
the only run-time check is often the check whether the output is Thue/False or
Yes/No, which is not very interesting. I therefore selected problems for which
interesting run-time checks exist, and preferably a few run-time checks, in order
to be able to compare their performance.
3.2.3
For the Analysis of SoftwareMetrics-For the analyses of software metrics [49], I used the following additional selection
"
criteria for programs submitted for a given problem:
Programs that do not consist of look-up tables. I disregard those
programs that consist of look-up tables, because their software metrics are
completely different (the Halstead Volume is in general more than ten times
domi-nating statistical analysis). These programs are very easily distinguishable from
others, because they combine a very high Halstead Volume with a very low
Cy-clomatic Complexity. In rare cases a look-up table has a very high Cyclomatic Complexity, more than a hundred; in these cases the table is programmed with
if-then-else statements.
Programs in C or C++. I only chose programs in C or C++ because my tools calculate the internal metrics for these programming languages. Apart
from this practical reason mixing programming languages in this research might
invalidate the results, or at least complicate their interpretation, because it is
not immediately clear how these metrics compare across language boundaries.
3.3 Test Harness
A test harness has been developed to systematically analyse problems in the
Programming Contest. The test harness contains programs for the f~llowing
tasks:
1. Extraction of source codes from e-mails.
2. Compilation of the source codes.
3. Running the compiled programs, with a benchmark as input.
4. Determining equivalence classes and score functions.
5. A range of statistical functions in R for analysis of the data.
See Appendix B for a description of the tools for analysing a problem.
3.4 Analysis
This section provides the (statistical) calculations that were done for all the
problems analysed. The total number of programs analysed is more than sixty.
Analysing a single problem typically takes between one day or several weeks,
Parameter C C++ Pascal Total
Number of submissions (AC, WA, or PE) 16844 17521 4337 38702
Number of authors 5897 6097 1581 13575
First submission correct 2479 2434 593 5506
Last submission correct 5140 5082 1088 11310
Average number of trials per author 2.86 2.87 2.74 2.85
Average number of trials per author (ex- 2.66 2.68 2.58 2.66
cluding submissions after a correct one)
Average number of trials to correct sub- 2.65 2.66 2.53 2.65
mission
Number of different equivalence classes 1003 1079 384 1991
N umber of different score functions 276 322 112 506
Number of different equivalence classes in 527 527 198 1012
authors' first submissions
Number of 'different score functions in au- 152 160 58 258
thors' first submissions
Table 3.1: Main parameters calculated for the "3n+1"-problem.
the later publications are based on more data than the earlier ones (see
Ap-pendix A.2).
3.4.1 Main Parameters
A first table, available for all problems, presents generic data about the number
of programs in the analysis, the distribution over the progra:mming languages,
the number of correct submissions, the average number of trials until a correct
submission, etc. Table 3.1 shows the table for the '''3n+1''-problem.