City, University of London Institutional Repository
Citation
:
Khalili, N., Wood, J. and Dykes, J. (2009). Mapping the geography of social networks. Paper presented at the GIS Research UK, 17th Annual Conference, 1 - 3 Apr 2009, University of Durham, Durham, UK.This is the unspecified version of the paper.
This version of the publication may differ from the final published
version.
Permanent repository link:
http://openaccess.city.ac.uk/408/Link to published version
:
Copyright and reuse:
City Research Online aims to make research
outputs of City, University of London available to a wider audience.
Copyright and Moral Rights remain with the author(s) and/or copyright
holders. URLs from City Research Online may be freely distributed and
linked to.
City Research Online: http://openaccess.city.ac.uk/ publications@city.ac.uk
Mapping the Geography of Social Networks
Nazanin Khalili, Jo Wood and Jason Dykes
giCentre, School of Informatics, City University London EC1V 0HB Tel.+44 (0)20 7040 0146 Fax +44 (0)20 7040 8584
{nazanin.khalili-shavarini.1 | jwo | jad7} @soi.city.ac.uk
KEYWORDS: social networks, volunteered geographic information, locational uncertainty, geovisualization
1. Introduction
Social relations and interaction patterns are visualised in node link graphs in traditional social network maps (Scott 1991, Wasserman and Faust 1994, Wellman and Berkowitz, 1988). The resultant network graphs frequently alter the geometric relations present in the real world in order to emphasize the connectivity and overall view of the networks. Whilst a node’s position has considerable potential for carrying information regarding network pattern and structure, no spatial information is usually encoded. Location is an important spatial property of social entities (Wellman, 1996) and integrating that information with social network data has the potential of revealing insights into hidden patterns behind communities. The advent of Web 2.0 and popularity of online social networks have resulted in masses of voluntarily submitted locational information being available for study and analysis. Much of this has a geographic component described as Volunteered Geographic Information or VGI by Goodchild (2007). The abundance of VGI provides opportunities for analysing the geography of social networks that has not been used to its full advantage yet and we are interested in visualizing these geographies.
2. Geography in Social Networks
Whilst there is scope for determining multi geographies from large numbers of volunteers the process is by no means straightforward. In reality people are associated with multiple physical locations and VGI provides data through which these might be determined. For example, online geo social networks such as yelp1, flickr2 and Gypsii3 enable us to associate users with home town, point of interest (POI), work place, geo located digital documents, etc. While attempts have been made in the past to relate geography to social entities, (Liben-Nowell, et al, 2005, Escher, 2007, Wellman, 1996) they have tended to focus on one specific location for each node, confining members to a bounding box of a city. This naïve geography although useful for variety of purposes (i.e. small world phenomena, analysis of scientific collaboration and friendship network) is of limited or no use for analysis of multiple locations associated with a social entity. This research takes advantage of the wasted geographies in graph presentation of social networks (Viegas and Donath, 2004) visualization and geovisualization techniques (Henry et al, 2008, Cui et al, 2008 and Henry and Fekete, 2007) for studying and modelling the multi-geographies accessible through VGI.
1
http;//www.yelp.com
2
http://www.flickr.com
3
3. Dataset Requirements
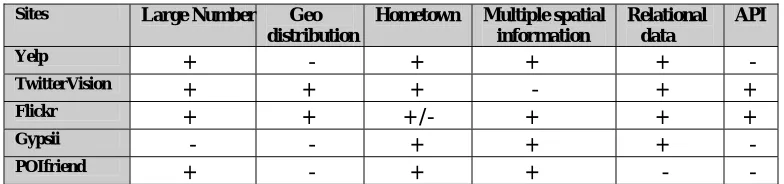
A number of appropriate candidate data set exist for this study. Raper (2008) listed 24 recent geo social sites in his blog4 (17/06/08). Five of these are considered according to the following criteria:
According to the representative sites summarised in table 1 a large number of members (the order of 20,000) are essential requirements in obtaining a representative sample of online socialisers. Secondly, in order to reinforce generalisation of inferences geographically local sites are excluded. The availability of publicly accessible information regarding spatial data (e.g. hometown, POI, workplace, geolocated digital photographs, etc.) and relational data (e.g. public friendship network) are also required. Finally, an Application Programming Interface (API) through which the data may be accessed and manipulated is essential.
The sources listed in Table 1 contain both relational and spatial elements. The table shows that flickr
can satisfy all the assessed research requirements quite successfully. It is an appropriate and interesting dataset for a number of reasons. Firstly, it contains large number of members and geotagged photos (68 million by Oct 2008) distributed around the world. Secondly the photo collections contain geographic information about members’ locations and their uploaded pictures. Thirdly from the social network perspective flickr members have a set of publicly available contacts, friends and family networks in their profiles. Finally, it provides an impressive API with potential for mashing up data and retrieving useful information for different needs.
Sites Large Number Geo distribution
Hometown Multiple spatial information
Relational data
API
Yelp + - + + + - TwitterVision + + + - + + Flickr + + +/- + + + Gypsii - - + + + - POIfriend + - + + - -
Table 1. Assessment results of the selected sites according to research requirements
4. Visualization Requirements
A Java application was developed through flickrj API5 in order to extract the required spatio-social data from flickr database. The results are summarised in Table 2.
Spatial Data Non Spatial Data Relational Data
(lat, long) for uploaded photos
Location of posters (City level)
Number of geo tagged photos Photo Id
Photo accuracy Poster’s user name Poster’s user id
List of public friends of a given poster
Table 2. List of retrieved data from flickr database sorted in three categories.
4
http://isblogs.soi.city.ac.uk/staff/raper
5
[image:3.595.97.489.372.464.2] [image:3.595.90.499.577.662.2]An extensive evaluation of appropriate visualization packages including those designed for social network analysis was conducted according to the following requirements:
R1. Visualize relational / network data
R2. Visualize spatial data
R3. Calculate social network properties
R4. Calculate statistical properties of data
R5. Visualize large networks
R6. Develop interactive visualizations for enabling exploratory analysis of data
R7. Provide developer with flexibility in design (not being a menu driven package)
R8. Provide books, user manuals, tutorials or discussion boards for users.
Assessment results of the sites according to the criteria mentioned above are summarised in Table 3. As can be inferred two visualization development environments have been found as the most promising tools for visualization of spatio-social data: Prefuse6 and Processing7.
Sites Relational Data Spatial Data SNA Properties Statistical Properties Large Networks
Interactivity Flexibility Learning Support Many Eyes + - - - - +/- - + Prefuse + + - + + + + + Processing + + + + + + + + Improvise + + - - ? + - - Pajek + +/- + + + - - + Ucinet +/- +/- + + +/- - - +
Table 3. Assessment results of the visualization packages.
5. Flickr Friendship Network
In accordance with the requirements identified and considering the size of the flickr database our analysis was limited to data sets with the following criteria:
• Users who have geo tagged photos in their collections.
• Photos with the highest available locational accuracy (accuracy level 16).
• Photos uploaded between 9/12/06 to 09/12/08. 15 photos were randomly selected on daily basis during the above two year sampling period.
0 50 100 150 200 250 300
0 1 2 4 8 16 32 64 128 256 512 1024 More
Number of friends
Fr
e
q
uenc
y
Figure 1. Frequency histogram for number of friends in flickr database.
6
http://prefuse.org
7
Figure 1 shows the frequency histogram of the 2231 members who uploaded 12850 geotagged photos during the two year sampling period. The friendship network of flickr members follows a bimodal
distribution with a large population of members with no friends and second population with approximate log-normal distribution. The unexpected number of users with 0 and very high numbers of friends indicate the unpredictable behaviour of social entities that can be affected by different factors e.g. exploring the site, limitations on the maximum number of friends etc. On average flickr
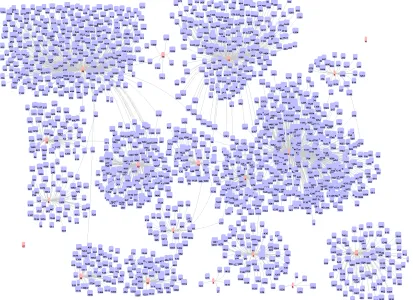
users have 96 friends. The networks of 20 randomly selected members of flickr are visualized with
prefuse and demonstrated in Figure 2 as indicative of the typical patterns of flickr friendship networks. Through the experiment became clear that the expectations suggested by the assessment criteria (Table 3) were met successfully in practice and can be concluded that the result of the experiments in practice and with flickr sample data are consistent with the assessment and evaluation conducted in section 4. Current work is investigating processing and visualizing the same data set with a processing application.
As can be seen the network is neither Small World (Watts and Strogatz, 1998) nor Scale-Free (Barabasi, et al, 2003) and the friendship network grows exponentially. Moreover, in the network of only 20 members without any spatial information included and with one of the most effective force directed layout algorithms (Fruchterman and Reingold, 1991) the layout is cluttered. This confirms the fact that, modelling and exploring the geographical layouts of large networks of this type need novel methods to be developed and new design decisions to be made. Therefore, the aim of this ongoing work is to overcome the challenge of developing spatio-social network maps that can be used effectively in identifying social and spatial relations within large data set. The developed maps are also expected to facilitate the evaluation of the role of geographical proximity in online interactions and friendship patterns.
Figure 2. Social network of randomly selected flickr members. This visualization excludes the geographical layout. Nodes are laid out according to FruchtermanReingold algorithm
[image:5.595.95.508.415.715.2]6. Conclusion
References
Barabasi, A-L, Bonabeau, E. (2003) Scale-free networks. Scientific American, 288(5).
Cui, W. et al.
, 2008. Geometry based clustering for Graph visualization. IEEE Transaction on
Visualization and Computer Graphics, 14(6), 12771284.
Escher, T. (2007) Researching the geography of social relations: Analysis of the spatial distribution of friendship networks on social network sites. Third International Conference in e-Social Science. Fruchterman T. and Reingold E. (1991) Graph Drawing by Force directed Placement. Software- Practice and Experience. 21(11), 1129-1164.
Goodchild M. (2007) Citizens as sensors: The world of volunteered geography. GeoJournal, 69, 211-221.
Henry N., Bezerianos, A. and Fekete J.-D. (2008) Improving the readability of clustered social networks using node duplication. IEEE Transactions on Visualization and Computer Graphics, 14(6), 1317-1324.
Henry, N. and Fekete, J., (2007) MatLink: Enhanced Matrix Visualization for Analyzing Social Networks. Proceedings of the 11th IFIP TC13 International Conference Interact’07, LNCS, 4663, 288-302.
Liben-Nowell D., Novak J., Kumar R., Raghavan P. and Tomkins A. (2005) Geographic routing in social networks. National Academy of Science, 102 (33), 11623-11628.
Scott J. (1991) Social Network Analysis: A Handbook. London: Sage Publications.
Wasserman S. and Faust K. (1994) Social Network Analysis. Cambridge: Cambridge University Press.
Wellman B. and Berkowitz S. (1988) Structural Analysis in the Social Sciences: A Network Approach. Cambridge: Cambridge University Press
Wellman B. (1996) Are personal communities local? A dumptarian reconsideration. Social Networks, 18(4), 347-354.
Viegas F. and Donath J. (2004) Social network visualization: Can we go beyond the graph?
Workshop on Social Networks for Design and Analysis: Using Network Information in CSCW. Watts D. and Strogatz S. (1998) Collective dynamics of 'small-world' networks. Nature 393:440- 442.
Biography
Nazanin Khalili Shavarini is a second year PhD Candidate at the giCentre, City University London with research interests in visualization and geo social networks. She graduated from Tehran Azad University in 2005 in Computer Hardware Engineering and has an MSc in Information Systems and Technology from City University London.