Rowland, S. M. and Bahadoorsingh, S. and Catterson, V. M. and Rudd, S. E. and McArthur, S. D. J.
(2010) Interpretation of partial discharge activity in the presence of harmonics. In: 10th IEEE International
Conference on Solid Dielectrics (ICSD), 4-9 July 2010, Potsdam, Germany.
http://strathprints.strath.ac.uk/
26478
/
Strathprints is designed to allow users to access the research output of the University of
Strathclyde. Copyright © and Moral Rights for the papers on this site are retained by the
individual authors and/or other copyright owners. You may not engage in further
distribution of the material for any profitmaking activities or any commercial gain. You
may freely distribute both the url (
http://strathprints.strath.ac.uk
) and the content of this
paper for research or study, educational, or not-for-profit purposes without prior
permission or charge. You may freely distribute the url (
http://strathprints.strath.ac.uk
)
of the Strathprints website.
Interpretation of Partial Discharge Activity in the
Presence of Harmonics
S. Bahadoorsingh and S. M. Rowland The University of Manchester, School of Electronic and Electrical Engineering, PO Box 88, Manchester, M60 1QD, United Kingdom
V. M. Catterson, S. E. Rudd and S. D. J. McArthur
University of Strathclyde, Institute for Energy and Environment,
Glasgow, G1 1XW, United Kingdom
Abstract—Recent work has identified that circumstances of equipment operation can radically change condition monitoring data. This contribution investigates the significance of considering circumstance monitoring on the diagnostic interpretation of such condition monitoring data. Electrical treeing partial discharge data have been subjected to a data mining investigation, providing a platform for classification of harmonic influenced partial discharge patterns. The Total Harmonic Distortion (THD) index was varied to a maximum of 40%. The results show progressive development for interpretation of condition monitoring data, improving the asset manager’s holistic view of an asset’s health.
Keywords- partial discharges, harmonic analysis, artficial intelligence.
I. INTRODUCTION
Models have previously been published [1, 2] identifying the need to understand the circumstances of electrical plant operation before asset managers can exploit their understanding of ageing mechanisms. Circumstance monitoring originated from the need for improved plant and network diagnostics [1, 3], and defines the collection of data reflecting the real network working environment of in-service equipment. This includes electrical, mechanical, thermal, chemical and environmental stresses. This is distinguished from condition monitoring, which is the collection of data reflecting equipment status.
The evolution of power systems continues to increase nonlinear loads, leading to locations of high harmonic content and reduction of power quality not experienced previously. Short-term polymeric insulation tests have revealed changes in the power quality of the excitation voltage driving electrical tree growth does not radically affect the visual amenity of the tree [4], but does change the pattern of partial discharges observed in the associated phase-resolved partial discharge plot [5].
This paper evaluates the current research approach employed to improve diagnostic interpretation of the influence of harmonics on partial discharge data using artificial intelligence techniques. First a brief review of the methodology and the latest developments are provided.
II. PROGRESS REVIEW
A. Experimental
The experimental approach employed here has previously been described in [3]. Electrical trees were developed using point-plane LY/HY5052 epoxy resin samples with 3 µm radius conditioned hypodermic needles. Samples had a 2 mm insulation gap. Previously, a set of seven composite waveforms, defined in Table I, containing (including the 50 Hz fundamental) various controlled magnitudes of harmonic components [3] were applied. The peak signal voltage was held constant in each test between 10.8 kV and 14.4 kV peak. THD was varied between tests up to a value of 40%.
Table I. Waveforms employed in previous experiments [3-5]
Harmonic Composition + 50 Hz Waveform
ID # Harmonic Order % Magnitude
per Harmonic Phase
ϕ
THD %
1 3 40.0 0 40.0
7 1 100 0 0.00
8 5 5.00 0 5.00
9 7 5.00 0 5.00
11 7 17.8 0 17.8
12 5,7,11,13,23,25 3.20 0 7.85
13 5,7,11,13,23,25 2.00 0 5.00
B. Classification Technique and Outcome
This exercise started with the aim to train accurate classifiers for identifying certain waveform attributes. The accuracy of each classifier can be used to draw conclusions about the effects of particular attributes, such as the relative importance of particular harmonic orders.
for specific harmonic combination sets, including the 5th and
7th harmonic orders. Accuracies of 83.8% and 90.9% were
reported with the C4.5 method for identification of the 5th and
7th harmonic respectively. Application of a Support Vector
Machine (SVM) provided marginally increased accuracy of 91.2% identifying the 7th harmonic [3].
Acceptable classifier accuracies were achieved with C4.5 and SVM techniques for identifying harmonic attributes from harmonic influenced electrical treeing partial discharge patterns. This prompted the investigation of THD assessment using specific harmonic combinations. However, the waveforms described in Table I possessed too much variability in harmonic orders for suitability as a training set for a THD identification technique. For example, waveform 1 is the only wave with 40% THD and the 3rd harmonic present,
making it impossible to verify whether a classifier is training on features due to the THD (as desired) or on features due to the harmonic order. As a result, this paper focuses on two key harmonic orders, the 5th and the 7th, and investigates finer
granularity in THD variation.
III. METHOD
In this series of experiments, composite waveforms using the 5th and 7th (individually and combined) were employed at a
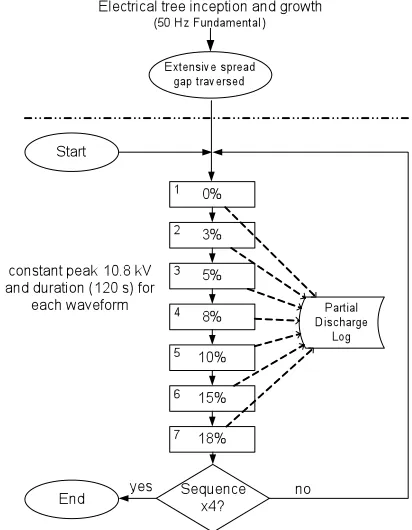
constant peak voltage of 10.8 kV peak. An extensively grown electrical tree traversing the insulation gap was developed through excitation by the 50 Hz fundamental only. A sequence of seven composite waveforms (including the fundamental) was then introduced. The harmonic content was increased every 120 s in a step-wise fashion from the pure fundamental excitation waveform to the following THD (%) levels: 3, 5, 8, 10, 15 and 18. Figure 1 illustrates the waveforms for the combined 5th and 7th harmonic orders.
[image:3.595.324.530.136.401.2]In these experiments the peak value of voltage was maintained constant.
Figure 1. Illustration of the seven applied waveforms using varied yet equivalent magnitudes of both 5th and 7th harmonic orders.
[image:3.595.46.281.482.675.2]This sequence was applied for four complete cycles without power supply de-energization, lasting a total of 56 minutes as shown in Figure 2. During this exercise, the partial discharge activity of the electrical tree in the epoxy resin sample was captured [3]. Waveforms of the same THD levels were utilized for the 5th and 7th harmonic orders separately.
Figure 2. Schematic of testing sequence for application of the composite waveforms.
A. Feature Selection
The feature selection procedure introduced in [3] was re-applied for identification of the THD level. A large set of prospective features of the phase-resolved partial discharge pattern were calculated, including statistics of pulse distribution across the positive and negative voltage half-cycles (e.g. mean discharge amplitude, discharge count [7, 8]); statistics calculated from six equal-width phase windows [9]; mean discharge amplitude calculated from 100 equal-width phase windows [10]; and pattern descriptors (e.g. shape can be “chopped sine”, “knife blade”, “podium”, etc.) that a human expert would use to describe the phase-resolved pattern [11].
These 147 features were ranked by calculating the Information Gain Ratio of each for predicting THD. Subsets of the top features were used to train C4.5 decision trees for THD identification, with the most accurate subset deemed the best feature vector. Further description and rationale for this procedure can be found in [3].
Interestingly, many of the features that were ranked highly for identifying the presence of the 5th and 7th harmonics [3],
the top, and the positive rising segment, i.e. the 0º–60º window, close to the bottom. However, when identifying THD, most of these phase window statistics have an Information Gain Ratio of zero, meaning they give no information about THD at all. The positive rising segment and the negative falling segment (180º–240º) were the exceptions, coming at the top of the ranking. This result confirms that different features of the partial discharge pattern are related to THD and the harmonic orders present. This strengthens support for the hypothesis that THD can be identified from the phase-resolved partial discharge patterns.
B. THD Identification
This ongoing study sought to develop and assess an intelligent system technique, trained to recognize THD levels from phase-resolved partial discharge patterns. Since THD is a continuous-valued variable, the first approach involved training a regression technique to identify the function linking partial discharge features to THD values. The potential benefit of a regression approach is that the function should be able to interpolate between training values. The training set contained examples of 3% and 5% THD (from the waveforms described in Figure 1) as well as an accurately trained function with the potential to interpolate to an unseen 4% THD sample.
Two methods of regression were tried, each from a different family of techniques. A multi-layer perceptron (MLP) artificial neural network (ANN) was chosen for its ability to approximate non-linear functions [12]. Training consisted of iteratively updating the weights of each neuron in the network. Secondly, the K* algorithm was selected as an instance-based learning approach [13]. Training here involved clustering the (training) samples, using entropy as a distance measure between clusters.
The accuracies of these techniques were approximately similar with K* performing moderately better, as outlined in Table II. Both were trained using 10-fold cross validation. The feature vector included two binary attributes indicating the presence of the 5th harmonic and the presence of the 7th
[image:4.595.314.549.542.705.2]harmonic, since previous work suggested this could be accurately identified [3]. It was assumed this information would aid THD identification. This was subsequently confirmed by training K* with and without these two features.
Table II. Accuracy of various regression techniques evaluated
Technique Correlation coefficient Mean absolute error
MLP with harmonics 0.6352 3.88
K* without harmonics 0.6379 2.97
K* with harmonics 0.6896 2.68
The most accurate technique was K* with harmonic order features. However, even in this case the accuracy was not particularly impressive. For example, the mean absolute error of 2.7 meant in the average case the THD estimate is ± 2.7%. For a utility interested in monitoring THD levels, this level of discrimination is not very good.
On the other hand, from a utility’s perspective the exact figure is somewhat less important than a judgment on whether
[image:4.595.41.285.557.611.2]THD is low or high, acceptable or unacceptable and whether it is likely to impact partial discharge data. As an alternative to regression techniques, THD levels were labeled and grouped into sets, and a classifier trained to identify the label. Table III shows the selected THD labels to train a C4.5 classifier tree. The best feature vector was only 16 features long, and the overall accuracy was 67.7%. The confusion matrix for the classification labels is also given in Table III.
Table III. Confusion matrix for the classification of THD labels
THD Classified as
Level (%) Label Low Moderate High Very High
0,3 Low 457 53 36 16
5,8 Moderate 51 395 121 30
10,15 High 40 123 403 88
18 Very High 15 37 84 199
IV. DISCUSSION
While not directly comparable, the mean absolute error of the K* classifier and the number of misclassifications of the C4.5 tree suggested the decision tree is most practical for utility monitoring. On average, the error produced by K* gives a wide range of possibilities for THD, whereas the confusion matrix for C4.5 shows better than average THD label accuracy (approximately two in three).
A deeper analysis into the accuracy information of Table III further reveals some interesting results. Accuracy comparison of the three polluted waveform harmonic groupings is shown approximately equal in Table IV. However, the unpolluted fundamental frequency yields 100% accuracy: all 294 partial discharge patterns were correctly classified as “low”.
Table IV. Approximately equivalent accuracy for recognition of the three harmonic groups evaluated.
Harmonic Orders
5th 7th 5th and 7th
Accuracy (%) 61.52 63.43 62.88
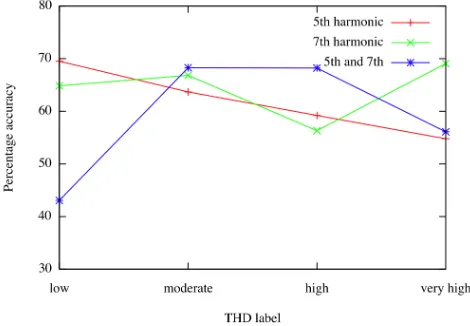
It may be expected that higher levels of distortion would be easier to identify improving accuracy with the corresponding label ordering. However, the plots depicted in Figure 3 do not suggest such a relationship.
The 5th harmonic group showed a linear opposite trend,
displaying highest accuracy for “low” THD and least on “very high” THD. There were varied results for the 7th (individually)
as well as, the 5th and 7th (combined) harmonic orders.
However, there was no strong trend to draw firm conclusions identifying THD using these harmonic orders and magnitudes. While this classifier shows 67.7% accuracy overall, it is still incorrect approximately one third of the time and mitigation approaches should be explored.
A common approach is to re-examine the feature vector used. However, through the feature selection procedure outlined above, a variety of feature vectors have already been tested, and the results reported here correspond to the feature set with highest accuracy.
A second approach is to examine different classification algorithms from various technique families. Using the THD labels, classifiers were trained using K* (classification rather than regression) and a second instance-based learner called IB1. Accuracies were no better than C4.5, at 66.8% and 61.1% respectively. Other families, including the Radial Basis Function ANN and the Naïve Bayes Bayesian classifier gave significantly poorer results. Consequently, it is unlikely these results can be significantly improved by using a technique other than the C4.5 tree reported here.
Taking into account the engineering context of the problem suggests a third route. Thus far, classification of THD (and harmonic content before that [3]) has been based on individual phase-resolved partial discharge patterns. Partial discharge monitoring of plant in the field tends to take place over a period of time, resulting in a set of patterns taken over a few minutes, hours, or even days.
It may be possible to improve THD and harmonic content identification accuracies by classifying a set of patterns captured chronologically and comparing the results. This comparison would involve a second level of reasoning considering the likelihood that step changes in THD and harmonic content may occur at the same time. At its simplest, this could mean taking the majority opinion on three successive partial discharge patterns. Since the THD classifier is accurate two thirds of the time, this should improve the overall accuracy. Further investigations will consider the number of consecutive patterns required to determine confidence levels, in addition to the most appropriate method of evidence combination for this task.
V. CONCLUSIONS
This work has illustrated THD levels can be identified independently of knowing the specific harmonic attributes polluting the excitation voltage wave. In the case presented here, knowledge of whether the 5th and 7th harmonics are present can improve classification. The K* regression technique was used to identify the THD level from test data. These results while acceptable were not as dependable as anticipated. This led to THD identification in groups clustered around four defined THD levels and labels. A classifier was
trained to identify the appropriate label, giving 67.7% accuracy. Future work will investigate the application of this technique into a practical system for online monitoring of harmonics, and its use in interpreting partial discharge data in the presence of harmonics.
ACKNOWLEDGMENT
This work was funded through the EPSRC Supergen V, UK Energy Infrastructure (AMPerES) grant in collaboration with UK electricity network operators working under Ofgem's Innovation Funding Incentive scheme; - details on http://www.supergen-amperes.org
REFERENCES
[1] S. Bahadoorsingh and S. M. Rowland, "A framework linking knowledge of insulation ageing to asset management " IEEE
Electrical Insulation Magazine, vol. 24, pp. 38-46, 2008.
[2] P. Caramia, G. Carpinelli, P. Verde, G. Mazzanti, A. Cavallini, and G. C. Montanari, "An approach to life estimation of electrical plant components in the presence of harmonic distortion," in
International Conference on Harmonics and Quality of Power.
Orlando, USA, 2000, pp. 887-892.
[3] S. Bahadoorsingh, S. M. Rowland, V. M. Catterson, S. E. Rudd, and S. D. J. McArthur, "The role of circumstance monitoring on the diagnostic interpretation of condition monitoring data," in
IEEE International Symposium on Electrical Insulation. San
Diego, USA: to be presented, 2010.
[4] S. Bahadoorsingh and S. M. Rowland, "Investigating the impact of harmonics on the breakdown of epoxy resin through electrical tree growth," IEEE Transactions on Dielectrics and Electrical
Insulation - submitted, 2009.
[5] S. Bahadoorsingh and S. M. Rowland, "Application of a hyperbolic function to model harmonic influenced electrical treeing partial discharge patterns," IEEE Transactions on
Dielectrics and Electrical Insulation - submitted, 2009.
[6] J. R. Quinlan, C4.5: Programs for Machine Learning: Morgan Kaufmann Publishers, 1993.
[7] E. Gulski and A. Krivda, "Neural Networks as a Tool for Recognition of Partial Discharges," IEEE Transactions on
EIectrical Insulation, vol. 28, pp. 984-1001, 1993.
[8] S. M. Strachan, S. Rudd, S. D. J. McArthur, M. D. Judd, S. Meijer, and E. Gulski, "Knowledge-based diagnosis of partial discharges in power transformers," IEEE Transactions on Dielectrics and
Electrical Insulation, vol. 15, pp. 259-268, 2008.
[9] A. J. Brown, V. M. Catterson, M. Fox, D. Long, and S. D. J. McArthur, "Learning Models of Plant Behaviour for Anomaly Detection and Condition Monitoring," in International Conference
on Intelligent Systems Applications to Power Systems, 2007, pp.
1-6.
[10] L. Hao, P. L. Lewin, and S. J. Dodd, "Comparison of support vector machine based partial discharge identification parameters,"
in IEEE International Symposium on Electrical Insulation.
Toronto, Canada, 2006, pp. 110-113.
[11] S. Rudd, S. D. J. McArthur, and M. D. Judd, "A generic knowledge-based approach to the analysis of partial discharge data," IEEE Transactions on Dielectrics and Electrical Insulation, vol. 17, pp. 149-156, 2010.
[12] S. Russell and P. Norvig, AI: A Modern Approach: Prentice Hall, 1995.
[13] J. G. Cleary and L. E. Trigg, "K*: An Instance-Based Learner Using an Entropic Distance Measure," in International Conference