Title: “Arc Mapping research”
Authors: Nicholas Carey PhD and Niamh Nic Daeid PhD
Abstract
Establishing a compartment fire’s area of origin when it has been burning at post-flashover conditions is a difficult process. Burn patterns traditionally used by fire investigators following post-flashover fires can be erroneous. This paper details research that explored the reliability of using the electrical wiring in a building to establish the origin of a fire. Forty two fully furnished experimental compartment fires using repetitive room configurations were used in the research and the resultant artefacts analysed with various types of microscopy.
The analysis of the three-dimensional data indicated that there is a high probability that arcing damage observed on electrical conductors occurred in close proximity to the fire’s area of origin. The series of experimental fires with repeated scenarios validated the reliability of using the arc fault mapping methodology during the investigation of fire scenes.
Introduction
The arcing damage to electrical conductors that is often found at a post-fire scene where the electrical installation was energised during the early development of the fire. This damage can be useful to the investigation as it can provide reliable data to establish a fire’s area of origin. This data can be of particular importance when the fire has reached flashover conditions whereby the conventional burn patterns often relied upon by investigators have been overwritten by the flashover and ventilation effect patterns.
The melting temperature of pure copper is 1084º C [1] and commercially available electrical conductors are generally 99.99% copper [2]. Compartment fire temperatures can vary depending upon the fuel packages and the ventilation that are available in the fire and tests have shown that these compartment fire temperatures do not often exceed 900º C at ceiling level [3]. As the fires in the compartment interact with the energised cables, the fire burns through the cable insulation materials and electron flow occurs between the conductors due to either the conductors coming into contact with each other, or through the carbonised plastic cable insulation that has become conductive due to the effects of the heat. When electron flow is established between the energised conductors an arcing event often takes place. The localised melting of copper conductors during an arcing event survives the fire and may be observed by an investigator who undertakes a careful examination of the electrical installation during the fire investigation process.
Arc mapping description and history
circuit. Multiple cables can be used to locate the area of origin of a fire in a compartment by detailing the arcing locations on the cables on a diagram of the electrical system in that compartment. This was first used by Svare in the late 1970’s [4], and the methodology was first published by Deplace and Vos in 1983 [5].
A more detailed description of the scene examination process was described by Rothchild in 1986 [6]. Svare detailed the use of this methodology whilst presenting at a conference in China in 1988 [7], in course handouts for the Federal Bureau of Alcohol Tobacco and Firearms in 1998 [8], and in the UK for the first time in 1999 [9]. Compartment fire tests undertaken in the US using UK wiring by Carey and Svare in 1999 [10, 11] showed that this methodology could also be applied successfully to UK wiring and European circuit protection devices. More recently others have published this methodology [12-16] and some additional compartment fire tests have been undertaken in the US using fixed electrical wiring, extension cables, and appliance cables [12, 17].
Scene examination
The majority of fire scenes generally encountered are those in which arc mapping can be applied. They will often include residential properties, retail units, industrial buildings, and factories. The fixed electrical installations, extension flexible cables, and electrical appliance flexible cables should all be examined closely where they have interacted with the fire. Each circuit needs to be identified and traced from the electrical distribution/panel board(s) containing the circuit protection devices for each of the circuits involved in the fire. A diagram of the electrical circuits should be overlaid on to the plan of the fire damaged compartment(s) within the building.
A careful and methodical examination of the conductors will often identify arcing damage where the fire first attacked the wiring insulation. Disposable gloves over hands are normally what are required to feel the beads, notches, welded points etc. that suggests evidence of an arcing event. Care needs to be taken not to misidentify other conductor damage in the form of alloying (eutectic melting), thermal damage, or mechanical damage that may appear to be electrical arcing damage [11, 18]. Churchward’s [19] description of the conductor examination is a detailed and accurate explanation of the care that is needed to achieve this type of electrical examination at a fire scene.
This research established that a clear demarcation area between the localised metallic damage of the electrical conductors and the undamaged area is an important physical feature to establish electrical arcing from other types of conductor damage (gross melting etc.).
Experiments
A literature review indicated that prior to this research the reliability of arc mapping had not been established with a series of full-scale experimental fires where different compartment scenarios were repeated. Forty two fully furnished compartments (including 3 blind tests) were wired with four separate electrical circuits. This led to the generation of 141 exhibits/artefacts of electrical arcing damage to copper conductors.
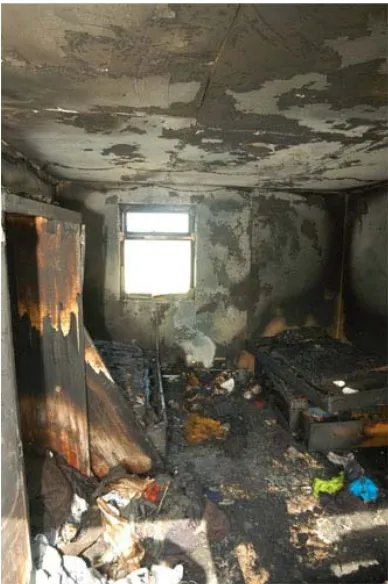
Figure 1 – a view of an experiment fire during flashover conditions.
Figure2 - a post-fire scene prior to exhibit recovery.
Results
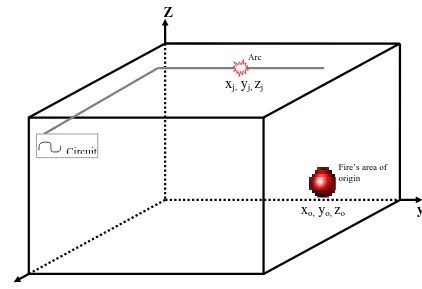
One of the major issues of the research was the mathematical evaluation of the three-dimensional data collected during the full-scale experimental fires. A mathematical method was used to establish the relationship between the fire’s area of origin and the arcing damage locations for the experimental fires [20]. x, y and z co-ordinates were used to describe the fire’s area of origin and the arcing damage for each separate electrical circuit in the compartment. Figure 3 details the x,y,z co-ordinates for one circuit within a compartment/room. Figure 4 details a cross-sectional view of a compartment, the fire’s area of origin, the actual arcing location and the minimum distance between the circuit and the fire’s area of origin.
R
oj is the distance between the fire’s area of origin and thearcing damage on a circuit in the experimental fires and
R
minis the minimum distance between theFigure 3 – Three-dimensional diagram showing the relationship between the fire’s area of origin and the arcing damage on one circuit.
Figure 4 – A cross sectional view showing the two different distances from the fire’s area of origin to the circuit’s arcing point and the minimum possible distance.
The data for
R
ojandR
minwith each circuit and experiment was inputted into and Excel spreadsheetusing the x, y, z coordinates for all locations of the area of origin for each of the experimental fires,
Z
y
x
j,y
j,z
jx
o,y
o,z
oFire’s area of origin
Circuit
Arc
R
ojR
minFire’s origin (
R
o) Arcing point [image:4.595.56.397.472.639.2]the actual arc locations on the circuit, and the closest possible arcing locations from the fire’s area of origin and the circuit were also inputted in this format. For the purposes of the calculations, only fires which were set with one area of origin were included (22 experimental fires in total).
The formulas to calculate
R
min/ R
oj were inputted into the same spreadsheet. The data was analysed for each scenario and separate histograms created for the repeat tests. The three-dimensional location of the arcing damage for each circuit was compared to the closest point on that circuit to the fire’s area of origin in each case.Testing the reliability of arc mapping
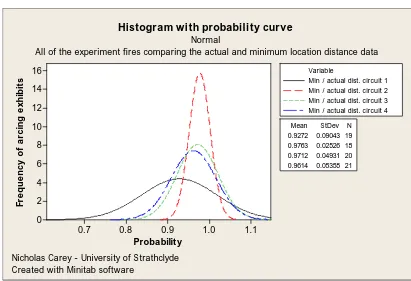
The spreadsheet data was imported and analysed with the statistical software package MiniTab version 15 (Minitab Inc. State College, PA. USA) and the results are detailed in figure5. This software package was able to display all four separate circuit results on to one histogram chart.
Statistical analysis suggests that the majority of the arcing events occurred on the electrical circuits within a short distance or adjacent to the closest possible points on the circuit to the fire’s area of origin. The majority of the probability results were in the 0.85 to 1.0 range (at a 95% confidence level). This suggests that there is a high probability (85% or higher at the confidence level tested) that the arc occurred within a close proximity to the fires area of origin.
A reduced probability for circuit 1 was observed for almost all of the experiments. The location of the cable for circuit 1 (the power ring circuit) was consistent throughout all of the experimental fires. The cable was located at the junction of the top of the walls and the ceiling. The fire dynamics appear to have slightly delayed the exposure of the PVC insulation to the heat flux in the fire’s early development resulting in arcing damage occurring further away from the area of origin in some cases and resulting in a greater spread of results.
1.1 1.0 0.9 0.8 0.7 16 14 12 10 8 6 4 2 0 Probability Fr e q ue nc y o f a rc in g e xhi b it s
0.9272 0.09043 19 0.9763 0.02526 18 0.9712 0.04931 20 0.9614 0.05358 21 Mean StDev N
Min / actual dist. circuit 1 Min / actual dist. circuit 2 Min / actual dist. circuit 3 Min / actual dist. circuit 4 Variable
Histogram with probability curve
All of the experiment fires comparing the actual and minimum location distance data
Nicholas Carey - University of Strathclyde Created with Minitab software
[image:5.595.90.501.437.718.2]Normal
Figure 5 – Histogram detailing the probability of the arcing damage compared to the closest point on a circuit.
A series of three blind test fires was undertaken using compartment fires with scenarios that were unknown to the researchers. Four electrical circuits were installed into empty compartments in the same configuration as described previously. The compartments were later furnished and then ignited. No observations were made of the interior of the three compartments until each of the fires had been extinguished. The scenarios were furnished as a domestic lounge, a bedroom and a travel agents office. The electrical conductors within the three scenarios were examined and the arcing locations were identified and documented. The fire’s area of origin for each blind test was successfully determined using the arc mapping methodology. All three blind tests were scrutinised by two members of an independent external agency [21] and deemed to be successful.
Conclusions
Analysis of the three-dimensional data recorded during the experiments and the arcing events has indicated that there is a high probability of arcing damage occurring to electrical conductors located close to the fire’s area of origin. The series of full-scale experimental fires with repeated scenarios mathematically validated the reliability of the arc mapping methodology and confirmed that the arcing events occurred irrespective to the fuel loads and fuel configuration within the compartment. Blind testing where the arcing damage was used to suggest an area of origin of the fire was successful in all tests and illustrates the value of this methodology in scene investigation particularly when post flashover has occurred.
Acknowledgements
The authors with to thank the University of Strathclyde and the Forensic Science Society for financial support. The authors also wish to acknowledge the following for their invaluable support – Gardiner Associates Ltd and the London Fire Brigade Fire Investigation Group.
References
1. Thermal and physical properties of pure metals, in CRC Handbook of Chemistry and Physics 1998-1999 17th Edition, D. Lide, Editor. 1998, The Chemical Rubber Publishing Company. p. 12-191.
2. The Elements, in CRC Handbook of Chemistry and Physics 1998-1999 17th Edition, D. Lide, Editor. 1998, The chemical Rubber Publishing Company. p. 4-9.
3. Carey N J, Developing a reliable systematic analysis for arc fault mapping, PhD thesis 2009, Univeristy of Strathclyde: Glasgow.
4. Svare, R., Arc Mapping. 1999.
5. Deplace, M. and E. Vos, Electric short circuits help the investigator determine where the fire started. Fire Technology, 1983. 19(3): p. 185-191.
6. Rothchild, L., Some fundamental electrical concepts in locating the cause and origin of a fire. . National Association of Forensic Engineers (NAFE) Journal, 1986. 175A: p. 37-44. 7. Svare, R., Determining Fire Point-of-Origin and Progression by Examination of Damage in
the Single Phase, Alternating Current Electrical System. Journal of People to People, International Arson Investigation Delegation to the People's republic of China and Hong Kong, 1988.
8. Svare, R., Using the electrical system to help reconstruct the fire scene. . 1998, Svare Professional Engineering.: Isanti, MN. p. 113-116.
9. Svare, R. Arc Mapping. in Live, Learn, Pass It On. 1999. Brunel University, Uxbridge, London.
11. Carey, N., Powerful Techniques - Arc Fault Mapping. Fire Engineers Journal, 2002: p. 47-50.
12. Churchward, D., R. Cox, and D. Reiter, Arc surveys as a means to determine fire origin in residential structures., in International symposium on Fire Investigation, Science & Technology (2004), Fire Service College, UK.
13. DeHaan, J.D., Kirk's Fire Investigation - Sixth Edition. 2006, Pearson - Prentice Hall: Upper Saddle River, NJ. p. 415-418.
14. Hoffman, D.J., Arc mapping to determine Fire ‘Point-of-Origin’. 2002, SEL report, (Safety Engineering Laboratories Inc., Michigan, USA).
15. Icove, D. and J.D. DeHaan, Forensic fire scene reconstruction. 2004, Prentice Hall, Upper Saddle River, NJ. p. 137-138.
16. Sanderson, J., Arc Mapping - special report. Fire Findings 2005. 13(2): p. 7-11.
17. Johnson, W. and L. Rich. Arc Fault Analysis: Post flashover studies of the power cord. in
Fire and Material Conference, 2007. San Francisco, USA.
18. Svare, M.J., M. Dubbin, and N.J. Carey. Reconstructing the fire scene using the electrical system. in International Association of Arson Investigators, ATC. 2006. Denver, USA. 19. Churchward, D., R. Cox, and D. Reiter, Arc surveys as a means to determine fire origin in
residential structures. Fire & Arson investigation conference proceedings, Fire Service College (UK) and NFPA 921 committee, June 2004.
20. Quintiere J, Calculations to undertake a probability analysis of three dimensional points. Personal communication, 2007