City, University of London Institutional Repository
Citation
:
Curran, P. J., Dungan, J. and Gholz, H. (1990). Exploring the relationship
between reflectance red edge and chlorophyll content in slash pine. Tree Physiology, 7(1-4),
pp. 33-48. doi: 10.1093/treephys/7.1-2-3-4.33
This is the published version of the paper.
This version of the publication may differ from the final published
version.
Permanent repository link:
http://openaccess.city.ac.uk/12994/
Link to published version
:
http://dx.doi.org/10.1093/treephys/7.1-2-3-4.33
Copyright and reuse:
City Research Online aims to make research
outputs of City, University of London available to a wider audience.
Copyright and Moral Rights remain with the author(s) and/or copyright
holders. URLs from City Research Online may be freely distributed and
linked to.
City Research Online:
http://openaccess.city.ac.uk/
[email protected]
Tree Physiology 7,33-48
0 1990 Heron PublishinffVictoria, Canada
Exploring the relationship between reflectance red edge and
chlorophyll content in slash pine
PAUL J. CURRAN,’ JENNIFER L. DUNGAN’ and HENRY L. GHGLZ3
’ Department of Geography, University College of Swansea, Singleton Park, Swansea SA2 8PP, UK 2 TGS Technology Inc., NASA, Ames Research Center, MofSett Field, CA 94035, USA
’ Department of‘ Forestry, University of Florida, Gainesville, FL 32611, USA
Summary
Chlorophyll is a key indicator of the physiological status of a forest canopy. However, its distribution
may vary greatly in time and space, so that the estimation of chlorophyll content of canopies or branches
by extrapolation from leaf values obtained by destructive sampling is labor intensive and potentially
inaccurate.
Chlorophyll content is related positively to the point of maximum slope in vegetation reflectance
spectra which occurs at wavelengths between 690-740 nm and is known as the “red edge.” The red edge
of needles on individual slash pine (Pinus elliottii Engelm.) branches and in whole forest canopies was
measured with a spectroradiometer. Branches were measured on the ground against a spectrally flat
reflectance target and canopies were measured from observation towers against a spectrally variable
understory and forest floor. There was a linear relationship between red edge and chlorophyll content of
branches (R* = 0.91). Measurements of the red edge and this relationship were used to estimate the
chlorophyll content of other branches with an error that was lower than that associated with the
calorimetric (laboratory) method. There was no relationship between the red edge and the chlorophyll
content of whole canopies. This can be explained by the overriding influence of the understory and forest
floor, an influence that was illustrated by spectral mixture modeling.
The results suggest that the red edge could be used to estimate the chlorophyll content in branches but
it is unlikely to be of value for the estimation of chlorophyll content in canopies unless the canopy cover
is high.
Introduction
The chlorophyll content of a forest canopy can be an indicator of such measures of physiological status as photosynthetic capacity, developmental stage, productivity, and stress (Vernon and Seely 1966, Whittaker and Marks 1975, Danks et al. 1983, Ustin et al. 1988). However, the distribution of chlorophyll within a forest canopy varies in time and three-dimensional space. As a consequence, estimating the chlo- rophyll content of branches and canopies by extrapolation from individual leaf chlorophyll measurements obtained by destructive sampling is labor intensive and potentially inaccurate. Ideally a method is required that is accurate, nondestructive, simple to use, and is at the spatial scale of the branch or canopy rather than the leaf. The measurement of radiation reflected in visible and near infrared wavelengths may be such a technique.
34 CURRAN, DUNGAN AND GHOLZ
1983, Schanda 1986). Red reflectance, especially when standardized by reflectance in a non-absorbing waveband, is highly correlated with chlorophyll content (Turrell et al. 1961, Everitt et al. 1985, Thomas and Gausman 1977). Therefore, red reflec- tance should be a reliable metric for chlorophyll content (Horler et al. 1980, Tsay et al. 1982, Ajai et al. 1983, Demetriades-Shah and Court 1987). In practice, measure- ments of red reflectance from branches and canopies couple both chlorophyll content and vegetation amount and are very sensitive to the effects of variable irradiance, variable background, the asymptotic form of the red reflectance-chlorophyll rela- tionship, and the geometrical arrangement of the scene, sensor, and surface (Curran 1983, Cut-ran and Milton 1983). A measure of reflectance that is less sensitive to these factors is the point of maximum slope in vegetation reflectance spectra which occurs between wavelengths 690 and 740 nm (Barber and Horier 1981, Ferns et al.
1984, Salisbury et al. 1987). This point defines the “red edge” and marks the boundary between the processes of chlorophyll absorption in red wavelengths and within-leaf scattering in near infrared wavelengths.
The red edge is usually defined on the first or second derivative of reflectance spectra, depending on the signal to noise characteristics of the sensor (Dixit and Ram 1985). The calculation of derivative spectra eliminates additive constants (e.g., illumination changes) and reduces linear functions (e.g., linear increase in back- ground reflectance with wavelength) to constants. This has led researchers to con- clude that the red edge is essentially invariant with illumination or the amount of background within the field-of-view of the spectroradiometer. The former is always the case, but the latter conclusion rests on the assumption that the background is spectrally flat, which is usually true in the laboratory (Horler et al. 1983a), or increases regularly with wavelength, which is usually true for mineral soils in the field (Demetriades-Shah and Steven 1988, Ustin et al. 1988,1989). If the reflectance of the background varies nonlinearly with wavelength, then the assumption is invalid and the derivative spectra will not be independent of the background. This point will be developed later in this paper.
The red edge<hlorophyll relationship
RELATIONSHIP BETWEEN RED EDGE AND CHLOROPHYLL 35
for leaves, branches and canopies, respectively (Dockray 1981, Rock et al. 1988a, Ustin et al. 1988, Curtiss and Ustin 1989, 1990).
The prevailing explanation for the red edge and its movement is drawn from the Beer-Lambert Law and the principles of gas and liquid spectroscopy. According to the Beer-Lambert Law, a negative exponential relationship exists between chemical concentration (chemical content per unit volume) and absorption (Wiffen 1972, Banwell 1983). The principles of gas and liquid spectroscopy state that the bandwidth of this increased absorption is related to the pressure (i.e., concentration) of the chemical (Goody 1964, Schanda 1986). Therefore, an increase in chlorophyll concentration will cause both deepening and, more importantly, broadening of its absorption feature (and thereby red edge) to longer wavelengths (Dockray 1981, Horler et al. 1983a, Rock et al. 1988a, Ustin et al. 1988). Therefore, the red edge could be expected to provide an estimate of chlorophyll content up to the absorption maximum, which will occur when the photoreceptive sites are saturated (Gates 1980, Baret et al. 1987).
Problems in measuring the red edge-chlorophyll relationship
Despite a causal relationship between red edge and chlorophyll content, the linear correlation between the two variables is low (Dockray 1981). This has usually been attributed to violation of one of the two implicit assumptions underlying the relation- ship, or to the effects of a changing leaf chemical content, chlorophyll a/b ratio or fluorescence.
Violation of implicit assumptions
The theoretical relationship between the red edge and chlorophyll content makes many assumptions about the method of measurement. For example, it is assumed that the majority of the radiation received by the sensor from the leaf has been reflected from within the leaf, and the red edge is independent of illumination level. These assumptions hold under usual conditions of illumination, observation and data processing (Salisbury et al. 1987). However, movements of the red edge have been observed that can be attributed to violation of one or both of these assumptions. Typically, these are the result of either measuring a considerable amount of specular radiation, which by definition has not entered the leaf (Vanderbilt et al. 1985, Guyot and Baret 1988), or measuring the movement of the red edge on reflectance spectra rather than derivative reflectance spectra (Schutt et al. 1984, Vanderbilt et al. 1988, Westman and Price 1988). These two examples illustrate the care that is needed if the red edge is to be measured reliably.
Influence of other leaf chemicals on the red edge
36 CURRAN, DUNGAN AND GHOLZ
1989). This is the case for some red pigments such as amaranthin, which is found in the leaves of Amurunthus tricolor. For example, a linear relationship between red edge and chlorophyll concentration for this species was confounded by amaranthin concentrations as low as 0.01 mg g-’ (Curran et al., unpublished observations).
Injluence
qf
the chlorophyll alh ratio on the red edgeThe absorption maximum of chlorophyll a is at a wavelength that is around 20 nm longer than that of chlorophyll b. Therefore, if the relative proportion of chloro- phyll a were to increase there would be a movement of the red edge to longer wavelengths, independent of total chlorophyll content (Guyot and Baret 1988). Likewise, a decrease in the relative proportion of chlorophyll a would result in a movement of the red edge to shorter wavelengths, also independent of total chloro- phyll content. The effect of a changing chlorophyll a/b ratio on the red edge is likely to be minor compared to the effect of the total chlorophyll content. Consequently, the effect of a change in chlorophyll a/b ratio on the red edge has proved difficult to observe (Chang and Collins 1983, Horler et al. 1983a, 1983b). However, its effect has been suspected (Banninger 1989) and in one case quantified (Rock et al. 1988~) in a stressed forest canopy.
Influence ofjluorescence on the red edge
The chlorophyll fluorescence spectrum has a maximum at 690 nm, which is near to the maximum of a chlorophyll absorption spectrum (Nobel 1983, Lichtenthaler et al. 1986, Rinderle and Lichtenthaler 1989). The fluorescence yield at a wavelength of 690 nm is only a few percent of the absorbed energy and this is partially reabsorbed by chlorophyll before it reaches the leaf surface. However, as chlorophyll content decreases this reabsorption decreases markedly. The result is the slightly enhanced movement of the red edge to shorter wavelengths, but only when the chlorophyll content is very low (Lichtenthaler and Bushmann 1987, Lichtenthaler 1989).
These four effects on the red edge are likely to be minor if measurements are taken with care, and should not severely inhibit our ability to use the red edge to estimate the chlorophyll content of green vegetation (Goetz 1989).
The aim of this study was to explore the relationship between the red edge and the chlorophyll content of foliage in branches and canopies of slash pine (Pinus elliottii
Engelm.).
Study site
RELATIONSHIP BETWEEN RED EDGE AND CHLOROPHYLL 37
all-sided leaf area index (LAI) of 3.5 (Gholz et al. 1990) at the time the measurements were made. The understory comprised a sparse shrub cover, of under 0.5 LAI, dominated by saw palmetto (Serenoa repens) and an even sparser cover of grasses and forbs overlying dead pine needles.
In 1986, sixteen 50 x 50 m plots were established at the study site. Eight of the plots were fertilized quarterly with a complete fertilizer, starting in February 1987, and the other eight plots were left as controls (Gholz et al. 1990).
Red edge and chlorophyll measurements
The red edge and chlorophyll content of intact needles on individual branches and on whole canopies were measured. The relative radiance of the branches or canopy and a white Fiberfrax (ceramic wool fiber) target were recorded with a Spectron SE590 spectroradiometer (Milton 1987). This sensor samples every 2.8 nm from 400-l 100 nm. In this case it was used with a 15” field-of-view lens and only the spectral range from 400-850 nm was analyzed. The relative radiance of the branches or canopy and the target were spectrally calibrated, using data from an integrating sphere and narrow waveband filters, then ratioed to provide reflectance spectra. Reflectance spectra were converted to first derivative spectra (Dixit and Ram 1985), to locate the point of maximum change in reflectance with wavelength: the red edge. Concentrations of chlorophyll a and b were estimated by the calorimetric method of Harbome (1973). Each sample was lyophilized for 48 h, or until a constant weight was reached. Between lo-20 g of needles per sample were ground through a l-mm mesh screen with a cyclone sample mill and each weighed sample was then ground twice with acetone. The absorption of the resultant liquid at wavelengths of 664 and 667 run was used to estimate chlorophyll concentration in mg g-’ of dry sample. As the weight was related linearly to the area and volume of the leaves, only this measure of concentration was employed.
Two experiments were undertaken using these measurement techniques. The first explored the red edge-chlorophyll relationship for foliage in branches and the second explored the red edge-chlorophyll relationship for foliage in canopies.
The red edge~hlorophyll relationship for branches
One or two branches were shot from the upper canopy of each of the sixteen plots with a Winchester model 43-2 18 Bee rifle. The foliated portions of nineteen branches were divided into new (< 1 year) and old (> 1 year) to give two samples per branch and a sample size of 38. Each sample was placed at the center of a spectrally flat (white), Fiberfrax target and the relative radiance was measured from a height of 1 m, using a tripod-mounted Spectron SE590 spectroradiometer. A bare Fiberfrax target was also measured. Samples were collected and spectral measurements were made over seven days (February 18-24,1988), under clear skies and with a solar elevation range of 40 to 47”.
38 CURRAN, DUNGAN AND GHOLZ
ice to the University of Florida where they were stored at -74 “C. Once all samples had been collected they were packed in dry ice and flown to NASA/Ames Research Center where they were stored at -18 “C until analyzed for chlorophyll. The chlorophyll concentration was determined and multiplied by the weight of the sample to give a measure of chlorophyll content (mg) per sample. The red edge was determined as described above (Figure 1).
It is unwise to develop a functional or calibration relationship (Curran and Hay 1986) using the data on red edge and chlorophyll content because measurement error exists in both variables (Webster 1989). Replicate measurements indicate that the root-mean-square (rms) error due to imprecision was 2.7 nm (around 3 percent of mean) and 12.3 mg (around 9 percent of mean) for the red edge and chlorophyll content, respectively. Therefore, estimates were made by regression because this allocates all of the error to the estimate of chlorophyll content.
Twenty-eight of the samples were selected at random and used to develop an
CHLOROPHYLL CONTENT, mg - 95.3
--- 150.9
ii -
2 .8- u _ Y IA .6-
w
K -
g .4- w -
w 0 - F -.2 1
I- -.2 L ’ ’ I I I I I I I I I I I I I I I I I %
% 400 400 480 480 560 560 640 640 720 720 800 800 850 850 ri
[image:7.463.39.256.284.594.2]ri WAVELENGTH, WAVELENGTH, nm nm
Figure I. The reflectance spectrum (a) and derivative reflectance spectrum(b) of two slash pine branches,
recorded against a spectrally flat Fiberfrax target. Note that the higher chlorophyll content is associated
with a red/near infrared boundary that is displaced toward longer wavelengths in (a) and a derivative
RELATIONSHIP BETWEEN RED EDGE AND CHLOROPHYLL 39
estimation equation over the red edge range of 706 to 726 mn (Figure 2).
Chlorophyll content (mg) = -35 10.43 + 5.07 x Red edge (nm)
(n = 28, R2 = 0.91, standard error of estimate = 10.48 mg)
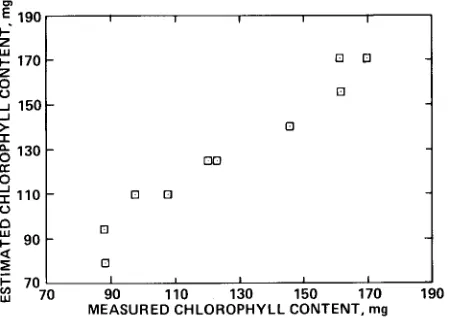
This equation was used to estimate the chlorophyll content of the remaining ten samples (Figure 3). The rms error of the estimate of chlorophyll content was 7.44 mg (around 6 percent of mean), which was slightly more than half of the error associated with the calorimetric determination of chlorophyll content.
g 70 I I I I I I 1 _ 700 704 708 712 716 720 724 729
[image:8.461.71.296.228.397.2] [image:8.461.71.297.460.619.2]RED EDGE POSITION, nm
Figure 2. The relationship between red edge and chlorophyll content for 28 slash pine branches, R* =
0.91.
$190 5 E 170 B -I 150 ? L 130 2 s 1110 0 I
$190 I I I I I I I I I I
5
E 170- a 0 0 0
B 0 0
-I 150-
? 0
L
2 130- 00 00 s
1110 - 0 0 0 0 0
[3
p go- El El z a a
$ 70 I I 1 1 I I , ,
w 70 90 90 110 110 130 130 150 150 170 170 190 190 MEASURED CHLOROPHYLL CONTENT, mg MEASURED CHLOROPHYLL CONTENT, mg [3
p 90 z $ 70 t w 70
Figure 3. The chlorophyll content of 10 slash pine branches measured in the laboratory and estimated
40 CURRAN, DUNCAN AND GHOLZ
-The procedure was repeated using chlorophyll concentration (mg g-l) in place of chlorophyll content (mg). This resulted in a nonsignificant R2 (5 percent confidence level) and a near tripling of the standard error of the estimate.
The red edge-chlorophyll relationship for canopies
The relative radiance of a canopy and a Fiberfrax target were measured from four observation towers under the same conditions reported for the branch measurements. The plots surrounding each tower were, 1: fertilized, LA1 of 3.69,2: control, LA1 of 3.06,3: control, LA1 of 2.23, and 4: fertilized, LA1 of 3.09 (Gholz et al. 1990). Two to eight measurements were made from each tower at up to fifteen different angles of observation and azimuth. This involved pointing the spectroradiometer from vertical to 45” off-vertical over an azimuth range of 0” (upsun) to 180” (downsun).
In each plot, three branches were shot from the measurement-side of the tower. The new and old needles were separated and chlorophyll concentrations (mg g-l) of three new and three old needle samples per plot were determined. As part of a parallel project new and old biomass (kg ha-‘) was estimated for each plot by the harvest technique discussed in Gholz et al. (1990). The chlorophyll concentration was multiplied by the biomass to give chlorophyll content for the new and old biomass per unit area (kg ha-‘). There was, on average, a higher chlorophyll concentration and content in the fertilized plots (Table 1).
The red edge was very similar for all four plots, with a mean value of around 7 13 nm when looking vertically, to around 716 nm when looking obliquely. There was no change in the red edge that was attributable to the azimuth of observation. These effects are illustrated using the results from Tower 3 (Figure 4). For the four towers, the maximum red edge had a lower variability than the minimum red edge and these were on average 1.2 and 2.1 nm, respectively. Both the minimum and maximum average red edge were slightly higher (but not significantly, 95 percent confidence level), by 0.6 nm for Plot 4 (fertilized).
Most of the variability in the red edge was attributable to the amount of canopy within the field-of-view of the spectroradiometer, not the chlorophyll in the canopy. The effect of canopy cover on the red edge can be illustrated using a simple spectral mixture model in which multiple scattering is assumed to be invariant with wave-
Table 1. The ranges, at one standard deviation, of chlorophyll concentration and content on the four plots.
Plot number Treatment Chlorophyll
Concentration (mg g-9
Content (kg ha-‘)
1 Fertilized 1.36- 1.68 2.40 - 3.05
2 Control 1.22- 1.69 1.86 - 2.61
3 Control 0.80- 1.41 1.13 - 1.80
[image:9.461.40.390.550.647.2]RELATIONSHIP BETWEEN RED EDGE AND CHLOROPHYLL
TOWER 3
716.5
80
[image:10.461.75.296.77.331.2]41
Figure 4. The red edge of a slash pine canopy recorded from Tower 3, one of the four observation towers
used in the experiment. Note that the red edge is related to elevation angle but not azimuth angle.
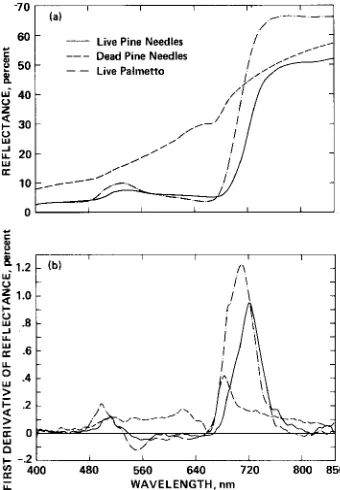
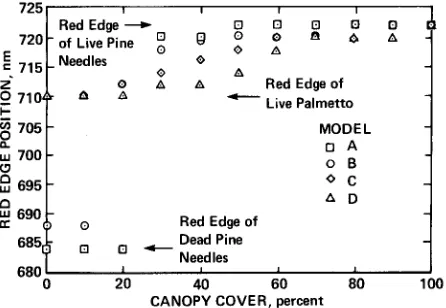
length. The model considers a canopy of live pine needles (red edge of 722 nm) above a background of live palmetto (red edge of 7 10 nm) and dead pine needles (red edge of 684 nm). A spectrum representative of each of these three cover types is illustrated in Figure 5.
Four models were developed to encompass the range of likely backgrounds (Table 2). For each model the reflectance spectra and derivative reflectance spectra were calculated for the composite scene assuming a canopy coverage of live pine needles between 0 to 100 percent (Figures 6 to 9). The reflectance spectra for each model illustrate the negative relationship between reflectance and canopy cover (Figures 6a-9a) and comparison between the reflectance plots illustrates the positive relationship between reflectance and the proportion of dead pine needles in the background (Figures 6a-9a). The combined effect of these two relationships on the red edge can be seen in the derivative reflectance spectra (Figures 6b9b).
42 CURRAN, DUNGAN AND GHOLZ
-70 (al
w- - Live Pine Needles ;
; 50- --- Dead Pine Needles e: - - Live Palmetto
0
E
k
ti
1.22 1.0 L 5 .8 k e 5 b 5
.4 F 5
.2 z 0 x $ -2
[image:11.461.36.206.82.327.2]: 400 480 560 640 720 800 850 WAVELENGTH, nm
Figure 5. The reflectance spectrum (a) and derivative reflectance spectrum (b) of the three materials used
in spectral mixture modeling (Figures 6 to 9).
Table 2. The four spectral mixture models. Each mode1 has a canopy of live pine needles that ranges from
0 to 100 percent cover. The differences between the models are determined by the material in the
background, from a complete coverage of dead pine needles in model A to a complete coverage of live
palmetto in model D. The spectra developed with these models are presented in Figures 6 to 9.
Model Material within sensor field-of-view, percent cover
Live pine needles Dead pine needles Palmetto
A o- 100 100-O 0
B o- 100 15-O 25 - 0
C O-100 50-O 50-O
D O-loo 0 100-O
[image:11.461.39.387.439.515.2]RELATIONSHIP BETWEEN RED EDGE AND CHLOROPHYLL 43
60 CANOPY COVER, percent E -0
0 -.2 I I 5 400 480 560 640 720 800 850 @c
[image:12.461.70.238.80.331.2] [image:12.461.70.236.370.614.2]ii WAVELENGTH, “m
Figure 6. The reflectance spectra (a) and derivative reflectance spectra (b) for model A (Table 2), in
which the canopy cover is varied from O-100 percent over a background of dead pine needles.
7o (al I
60 - CANOPY COVER, percent : -0
g 50- -- 20
0
E
‘: ;1.2 Y Q 1.0 L y .8 k cz .6
b
LII .4 2 k .2 2 5 O 2 -.2’
2 400 480 560 640 720 800 850 ii WAVELENGTH, nm
Figure 7. The reflectance spectra (a) and derivative reflectance spectra (b) for model B (Table 2), in
which the canopy cover is varied from O-100 percent over a background of three-quarters dead pine
44 CURRAN, DUNGAN AND GHOLZ
ia)
CANOPY COVER, percent -0
E
il.2
w’ y 1.0 2 .8 !? :: .6 OT "0 A s 5 .2
> z 0 x -.2
$ 400 480 560 640 720 800 850
E
[image:13.461.38.206.76.321.2] [image:13.461.38.213.372.618.2]WAVELENGTH, nm
Figure 8. The reflectance spectra (a) and derivative reflectance spectra (b) for model C (Table 2), in
which the canopy cover is varied from O-100 percent over a background of one-half dead pine needles
and one-half live palmetto.
CANOPY COVER, ,xrcent
:: t
Xl.2
ui 2 1.0 5 .8
2 ; .6
s .4,
9 F .2
5 E 0 i4 + -.2
2 400 480 560 640 720 800 850
z WAVELENGTH, nm
Figure 9. The reflectance spectra (a) and derivative reflectance spectra (b) for model D (Table 2), in
RELATIONSHIP BETWEEN RED EDGE AND CHLOROPHYLL 45
[image:14.463.71.294.83.237.2]40 60 80 100 CANOPY COVER, percent
Figure 10. The relationship between canopy cover and red edge for the four models A, B, C and D
(Figures 6 to 9).
previously unreported artifact of the red edge definition has implications for the use of the red edge when vegetation cover is low and the background is organic.
These four models led us to the generalization that the red edge of forest canopies can be considered independent of the background in two cases. The first case is when the canopy cover is greater than approximately 75 percent and the background has a red edge in the region of the red edge of the canopy. The second case is when the canopy cover is greater than approximately 25 percent and the background has a flat derivative spectrum in the region of the red edge of the canopy.
In this study, the canopy cover within the field-of-view of the spectroradiometer ranged from 0 to 100 percent when looking vertically to 100 percent when looking at an angle of 45”. The mixture modeling of the three main materials helped to explain why the red edge recorded vertically was both lower and more variable (7 13 f 2.1 nm) than the red edge recorded obliquely (716 -t 1.2 nm) and under what conditions the red edge of the background can dominate the red edge of the forest canopy.
Conclusions
There was a linear relationship between the red edge and chlorophyll content of detached branches measured against a spectrally flat background (R* = 0.91). The red edge was used to estimate the chlorophyll content of branches with an rms error of 7.44 mg, which was slightly more than half the error associated with the calorimetric determination of chlorophyll content.
There was no relationship between the red edge and the chlorophyll content of whole canopies. This was likely due to the overriding influence of the background.
46 CURRAN, DUNCAN AND GHOLZ
average of the two, but if the background had a red edge that was dissimilar to that of the canopy then the red edge of the canopy would be a discontinuous function with canopy cover.
Acknowledgments
This work was partially funded by the NASA Earth Sciences Applications Division while PJC held a
Senior NRC/NASA Research Associateship at NASA Ames Research Center under a grant from the
NASA Life Sciences Division and by NSF Grant number 8106678. The authors thank Wendell Cropper
Jr., David Delgado, David Nolletti, and Sherry Vogel, Department of Forestry, University of Florida, for
assistance in the field; Pam Matson, Tina Billow, and Kelly Dao, NASA Ames Research Center, for
assistance in the laboratory; Pierson Chiou and Xoan Trinb, NASAAmes Research Center, for assistance
with data processing; Laurie Richardson, NASA Ames Research Center, for providing Spectron calibra-
tion measurements, and Dave Peterson and Vem Vanderbilt, NASA Ames Research Center, for their
comments on the manuscript.
References
Ajai, D.J. Kamat, G.S. Chaturvedi, A.K. Singh and S.K. Sinha. 1983. Spectral assessment of leaf area
index, chlorophyll content and biomass of chickpea. Photogr. Engineer. Remote Sensing 49: 1721-
1727.
Banninger, C. 1989. Laboratory fluorescence, reflectance and chlorophyll measurements of foliage from
a stressed spruce forest. Proc. 12th Can. Symp. Remote Sensing and IGARSS. IEEE Geoscience and
Remote Sensing, Vancouver, pp 661.
Banwell, C.N. 1983. Fundamentals of molecular spectroscopy. Third Edn. McGraw Hill, London.
Barber, J. and D.N.H. Horler. 1981. Fundamental relationships between plant spectra and geobotanical
stress phenomena. NAS5-23738, NASA, Goddard Space Flight Center, MD.
Baret, F., L. Champion, G. Guyot and L. Podaire. 1987. Monitoring wheat canopies with a high spectral
resolution radiometer. Remote Sensing Environ. 22:367-378.
Chang, S.H. and W. Collins. 1983. Confirmation of the airborne biogeochemical mineral exploration
technique using laboratory methods. Econ. Geol. 78:723-736.
Collins, W. 1978. Remote sensing of crop trpe and maturity. Photogr. Engineer. Remote Sensing
44:43-55.
Collins, W., S.H. Chang, G. Raines, F. Canney and F. Ashley. 1983. Airborne biogeochemical mapping
of hidden mineral deposits. Econ. Geol. 78:737-749.
Curran, P.J. 1983. Multispectral remote sensing for the estimation of green leaf area index. Phil. Trans.
Roy. Sot., London, Series A 309:257-270.
Curran, P.J. 1989. Remote sensing of foliar chemistry. Remote Sensing Environ. 30:271-278.
Curran, F?J. and A.M. Hay. 1986. The importance of measurement error for certain procedures in remote
sensing at optical wavelengths. Photogr. Engineer. Remote Sensing 52:229-241.
Curran, P.J. and E.J. Milton. 1983. The relationship between the chlorophyll concentration, LAI, and
reflectance of a simple vegetation canopy. Int. J. Remote Sensing 4:247-255.
Curtiss, B. and S.L. Ustin. 1989. Parameters affecting reflectance of coniferous forests in the region of
chlorophyll pigment absorption. Proc. 12th Can. Symp. Remote Sensing and IGARSS. IEEE Geosci-
ence and Remote Sensing, Vancouver, pp 2633-2636.
Curtiss, B. and S.L. Ustin. 1990. The remote detection of early stages of air pollution injury in coniferous
forests using imaging spectrometry. Int. J. Remote Sensing. In press.
Danks, S.M., E.H. Evans and P.A. Whittaker. 1983. Photosynthetic systems. Structure, function and
assembly. John Wiley, New York.
Demetriades-Shah, T.H. and M.N. Court. 1987. Oblique view reflectance for assessing nitrogen status of
incomplete canopies. Int. J. Remote Sensing 8:1049-1055.
Demetriades-Shah, T.H. and M.D. Steven. 1988. High spectral resolution indices for monitoring crop
growth and chlorosis. Proc. 4th Int. Colloq. Spectral Signatures of Objects in Remote Sensing.
European Space Agency, Paris, ESA SP-287, pp 299-302.
RELATIONSHIP BETWEEN RED EDGE AND CHLOROPHYLL 41
Dixit, L. and S. Ram. 1985. Quantitative analysis by derivative electronic spectroscopy. Appl. Spectr.
Rev. 21:311-418.
Dockray, M. 1981. Verification of a new method for determining chlorophyll concentration in plants by
remote sensing. M.Sc. Thesis, Imperial Coil. Sci. and Technol., Univ. London.
Eve&, J.H., A.J. Richardson and H.W. Gaussman. 1985. Leaf reflectance-nitrogen-chlorophyll relations
in buffelgrass. Photogr. Engineer. Remote Sensing 51:463-466.
Ferns, D.C., S.J. Zara and J. Barber. 1984. Application of high resolution spectroradiometry to vegeta-
tion. Photogr. Engineer. Remote Sensing 50: 1725-1735.
Gates, D.M., H.J. Keegan, H.J. Schleter and V.R. Weidner. 1965. Spectral properties of plants. Appl.
Optics 4: 1 l-20.
Gates, D.M. 1980. Biophysical ecology. Springer-Verlag, New York.
Gholz, H.L., S.A. Vogel, W.P. Cropper Jr., K. McKelvey, K.C. Ewel, R.O. Teskey and P.J. Curran. 1990.
Dynamics of canopy structure and light interception in Pinus elliottii stands of North Florida. Ecol.
Monogr. In press.
Goetz, A.F.H., B.N. Rock and L.C. Rowan. 1983. Remote sensing for exploration: an overview. Econ.
Geol. 78:5773-590.
Goetz, A.F.H. 1989. Spectral remote sensing in geology. In Theory and Applications of Optical Remote
Sensing. Ed. G. Asrar. John Wiley, New York, pp 491-526.
Goody, R.M. 1964. Atmospheric radiation: 1 Theoretical basis. Oxford University Press, Oxford.
Guyot, G. and F. Baret. 1988. Utilisation de la haute resolution spectral pour suivre l’etat des couverts
vegetaux. Proc. 4th Int. Symp. Spectral Signatures of Objects in Remote Sensing. European Space
Agency, Nordwijk ESA SP 287:279-286.
Harbome, J.B. 1973. Phytochemical methods. Aguide to modem techniques of plant analysis. Chapman
and Hall, London.
Hare, E.W., J.R. Miller and G.R. Edwards. 1984. Studies of the vegetation red edge in geobotanical
remote sensing in eastern Canada. Proc. 9th Canadian Symp. Remote Sensing. Canadian Centre for
Remote Sensing, Ottawa, pp 433-440.
Horler, D.N.H., J. Barber and A.R. Barringer. 1980. Effects of heavy metals on the absorbance and
reflectance spectra of plants. Int. J. Remote Sensing 1:121-136.
Horler, D.N.H., M. Dockray and J. Barber. 1983~. The red edge of plant leaf reflectance. Int. J. Remote
Sensing 4:273-288.
Horler, D.N.H., M. Dockray, J. Barber and A.R. Barringer. 1983h. Red edge measurements for remotely
sensing plant chlorophyll content. Adv. Space Res. 3:273-277.
Howard, J.A., R.D. Watson and T.D. Hessin. 1971. Spectral reflectance properties of Pinus ponderosa
in relation to the copper content of the soil, Malachite Mine, Colorado. Proc. 7th Int. Symp. Remote
Sensing of Environment. Univ. Michigan, Ann Arbor, pp 285-296.
Lichtenthaler, H.K., C. Buschmann, U. Rinderle and G. Schmuck. 1986. Application of chlorophyll
fluorescence in ecophysiology. Rad. Environ. Biophys. 25:297-308.
Lichtenthaler, H.K. and C. Buschmann. 1987. Reflectance and chlorophyll fluorescence signatures of
leaves. Proc. Int. Geoscience and Remote Sensing Symp. IEEE Publ. 87CH2434-9, New York,
pp 1201-1206
Lichtenthaler, H.K. 1989. Possibilities for remote sensing of terrestrial vegetation by combination of
reflectance and laser-induced chlorophyll fluorescence. Proc. 12th Can. Symp. Remote Sensing and
IGARSS. IEEE Geoscience and Remote Sensing, Vancouver, 3, pp 1349-1354.
Miller, J.R., E.W. Hare, A.B. Hollinger and D.R. Sturgeon. 1987. Imaging spectrometry as a tool for
botanical mapping. In Imaging Spectroscopy II. Ed. G. Vane. Int. Sot. Optical Engineering, Belling-
ham, 834: 108-l 13.
Milton, E.J. 1987. Principles of field spectroscopy. Int. J. Remote Sensing 8:1807-1827.
Milton, N.M., W. Collins, S.H. Chang and R.G. Schmidt. 1983. Remote detection of metal anomalies on
Pilot Mountain, Randolf County, North Carolina. Econ. Geol. 78:605-617.
Milton, N.M. and D.A. Mouat. 1989. Remote sensing of vegetation responses to natural and cultural
environmental conditions. Photogr. Engineer. Remote Sensing 55: 1167-l 173.
Milton, N.M., C.M. Ager, B.A. Eiswerth and M.S. Power. 1989. Arsenic and selenium-induced changes
48 CURRAN.DUNGANANDGHOLZ
Nobel, P.S. 1983. Biophysical plant physiology and ecology. W.H. Freeman and Co., San Francisco.
Rinderle, U. and H.K. Lichtenthaler. 1989. The various chlorophyll fluorescence signatures as a basis for
physiological ground truth control in remote sensing of forest decline. Proc. 12th Can. Symp. Remote
Sensing and IGARSS. IEEE Geoscience and Remote Sensing, Vancouver, pp 674-677.
Rock, B.N., D.L. Williams and J.E. Vogelmann. 1985. Field and airborne spectral characterization of
suspected acid deposition damage in red spruce (Picea ruhens) from Vermont. Proc. Machine
Processing of Remotely Sensed Data. Purdue Univ., W. Lafayette, pp 71-8 1.
Rock, B.N., T. Hoshizaki and J.R. Miller. 1988a. Comparison of in situ and airborne spectral measure-
ments of the blue shift associated with forest decline. Remote Sensing Environ. 24:109-127.
Rock, B.N., C.D. Elvidge and N.J. Defeo. 19886. Assessment of AVIRIS data from vegetated sites in the
Owens Valley, California. Ed. G. Vane. Proc. Airborne Visible/Infrared Imaging Spectrometer (AVI-
RIS) Performance Evaluation Workshop. Jet Propulsion Laboratory Publication 88-35, Pasadena, pp
88-93.
Salisbury, J.W., N.M. Milton and P.A. Walsh. 1987. Significance of non-isotropic scattering from
vegetation for geobotanical remote sensing. Int. J. Remote Sensing 8:997-1009.
Schanda, E. 1986. Physical fundamentals of remote sensing. Springer-Verlag, New York.
Schutt, J.B., R.R. Rowland and W.H. Heartly. 1984. A laboratory investigation of a physical mechanism
for the extended infrared absorption (“red shift”) in wheat. Int. J. Remote Sensing 5:95-102.
Thomas, J.R and H.W. Gausman. 1977. Leaf reflectance vs. leaf chlorophyll and carotenoid concentra-
tions for eight crops. Agron. J. 69:799-811.
Tsay, M.L., D.H. Gjerstad and G.R. Glover. 1982. Tree leaf reflectance: a promising technique to rapidly
determine nitrogen and chlorophyll content. Can. J. For. Res. 12:788-792.
Turrell, EM., J.R. Weber and S.W. Austin. 1961. Chlorophyll content and reflection spectra of citrus
leaves. Bot. Gaz. 123:10-16.
USDA. 1954. Soil survey. Alachua County, Florida. USDA, Washington, D.C.
Ustin, S.L., B. Curtiss, S. Martens and V.C. Vanderbilt. 1988. Use of high spectral resolution sensors to
detect air pollution injury in conifer forests. In Remote Sensing Applications for Acid Deposition. Ed.
L.K. Ferstemraker. US Environmental Protection Agency, Las Vegas, NV, 89293-3478, pp 72-85.
Ustin, S.L., B. Curtiss, S. Martens and V.C. Vanderbilt. 1989. Early detection of air pollution injury to
coniferous forests using remote sensing. In Effects of Air Pollution on Western Forests. Eds. R.K.
Olson and A.S. Lefohn. Trans. Air and Waste Manage. Assoc., Anaheim, CA, pp 35 l-378.
Vanderbilt, V.C., L. Grant. L.L. Biehl and B.F. Robinson. 1985. Specular diffuse and polarized light
scattered by two wheat canopies. Appl. Optics 24:2408-2418.
Vanderbilt, V.C., S.L. Ustin and .I. Clark. 1988. Canopy geometry changes due to wind-caused red-edge
spectral shift. Proc. Int. Geoscience and Remote Sensing Symp. IEEE Geoscience and Remote
Sensing, Edinburgh, pp 835-836.
Vernon, L.P. and G.R. Seely. 1966. The chlorophylls. Academic Press, London.
Webster, R. 1989. Is regression what you really want? Soil Use Manag. 5:47-53.
Westman, W.E. and C.V. Price. 1988. Spectral changes in conifers subject to air pollution and water
stress: experimental studies. IEEE Trans. Geosci. Remote Sensing 26: 11-21.
Wiffen, D.H. 1972. Spectroscopy. 2nd Edn. Longman, London.
Whittaker, R.H. and P.L. Marks. 1975. Methods of assessing terrestrial productivity. In Primary Produc-