City, University of London Institutional Repository
Citation:
Blake, D., Byrne, A. & Mannion, G. (2010). Pension Plan Decisions. Review of Behavioural Finance, 2(1), pp. 19-36. doi: 10.1108/19405979201000002This is the accepted version of the paper.
This version of the publication may differ from the final published
version.
Permanent repository link:
http://openaccess.city.ac.uk/17361/Link to published version:
http://dx.doi.org/10.1108/19405979201000002Copyright and reuse: City Research Online aims to make research
outputs of City, University of London available to a wider audience.
Copyright and Moral Rights remain with the author(s) and/or copyright
holders. URLs from City Research Online may be freely distributed and
linked to.
City Research Online: http://openaccess.city.ac.uk/ [email protected]
DISCUSSION PAPER PI-0903
Pension Plan Decisions
Alistair Byrne, David Blake and Graham Mannion
September 2009
ISSN 1367-580X
The Pensions Institute
Cass Business School
City University
106 Bunhill Row London
EC1Y 8TZ
UNITED KINGDOM
Pension Plan Decisions
Alistair Byrne∗
University of Edinburgh Business School 50 George Square
Edinburgh EH8 9JY United Kingdom Tel. +44 (0) 131-651-5045 Fax. +44 (0) 131-668-3053
David Blake The Pensions Institute Cass Business School London EC1Y 8TZ
United Kingdom Tel. +44 (0) 20-7040-5143 Fax. +44 (0) 20-7040-8881
Graham Mannion PensionDCisions Ltd
57 Mortimer Street London W1W 8HS United Kingdom Tel. +44 (0) 20-7436-7337 Fax. +44 (0) 02-7436-6212
This version: 1 September 2009
∗
Pension Plan Decisions
Abstract
We examine the contribution and investment decisions made by members of a large
UK-based DC pension plan. We find that many employees appear to be relatively financially
sophisticated and follow approaches consistent with economic and financial theory in terms of
savings rates and investment strategies. However, there are also many less sophisticated
employees who stick with plan default arrangements and/or follow simple rules of thumb in
saving and investing. The challenge for corporate sponsors of pension plans is in designing
arrangements and communication strategies that reduce the chances of these less sophisticated
plan members making mistakes – in the sense of systematic deviations from optimal
behaviour.
Keywords: Pensions; Defined Contribution; Contribution Rates; Investment Choice;
Behavioural Biases.
1. Introduction1
Defined contribution (DC) pension plans are becoming increasingly common in many
countries, including the US and the UK. Individuals with DC plans have to make complex
saving and investment decisions which may have significant welfare implications for them.
DC plans typically give individual plan members responsibility for deciding how much to
contribute to the plan and how to invest these contributions. The evidence to date (see, for
example Byrne, 2004, and Mitchell and Utkus, 2004, for reviews) indicates that there are
wide divergences from the behaviour expected if plan members were fully rational and made
optimal savings and investment decisions over their life cycle (see, e.g., Campbell and
Viceira, 2002, and Gomes and Michaelides, 2005).
In this paper, we use a private administrative dataset to examine the contribution and
investment decisions made by members of one large UK-based DC plan which is sponsored
by a FTSE-100 company. The company wishes to remain anonymous, but we can say that the
workforce spans a broad range of skill and education levels with activities ranging from
manufacturing through to research and development, and that the company does not operate
in the financial services industry. The company is committed to providing good pension
benefits for its employees and actively communicates with its workforce on pension issues.
The data allow us to test key rational and behavioural economic theories that relate to
retirement saving. In broad terms, we find that many members appear to be relatively
financially sophisticated and make decisions consistent with rational theory. However, there
are also many employees who stick with scheme default arrangements and/or appear to use
simple rules of thumb in their saving and investment decisions.
We find that the members’ contribution rates are positively related to their age and level of
income, which, contrary to much of the recent evidence from behavioural studies, is broadly
consistent with lifecycle saving theory. We also find that male plan members save more than
females, and that individuals who have made an active choice of investment fund save more
than those who have accepted the default fund. The latter finding might be consistent with the
idea that more financially sophisticated members save at higher rates because they are more
aware of the consequences of inadequate pension savings for their standard of living in old
age. Contrary to the proposition that conservative investors who adopt lower risk / lower
1
expected return investment strategies need to save more to reach a given level of retirement
income, we find that investors choosing equity-dominated investment funds actually save
more than investors choosing fixed-income-dominated-funds. This might be because equity-dominated investors are more financially sophisticated investors and hence have a better
understanding of their lifecycle needs.
In terms of investment choice, we are able to investigate members’ investment decisions in
the absence of the complication of members being able to invest their contributions in the
employer’s own stock . This is not an option in this plan, nor is it a common investment
choice in DC pension plans outside of the US. We are therefore able to analyse pure
investment decision making by plan members who are unencumbered by the pressure to
support their employer by investing some of their pension assets in employer stock (see
Agnew, 2006).
We find that use of the default fund declines with income, but increases with age which may
be because the default in this case comprises bond-type investments. There is a non-linear
relationship between default fund use and tenure, with the probability of making an active
fund choice initially increasing and then declining. After controlling for whether or not the
plan member has made an active choice of investment fund, we find that equity allocation
increases with age until the member’s late-20s and thereafter decreases with age, is higher for
males than females (by approximately 9 percentage points) and increases with income (for
example, by 2 percentage points for a salary of £50,000 relative to £30,000). Plan members
have relatively high weightings in domestic assets, but the degree of “home bias” is less
marked than documented elsewhere and is lower amongst investors with complex portfolios.
Very few plan members appear to follow the naïve 1/n diversification approach documented
by Benartzi and Thaler (2001) whereby members invest equally across all available
investment funds. However, there is some evidence of a minority of members following a
conditional 1/n diversification strategy (Huberman and Jiang, 2006), whereby contributions are invested equally across the subset of funds chosen by the member.
The remainder of this paper is organised as follows. Section 2 discusses the previous
academic literature on contribution and investment decisions in DC pension plans, including
3 describes the dataset we use in our analysis, while Section 4 outlines the method of analysis.
Section 5 presents our results, and Section 6 concludes.
2. Literature
2.1 Contribution Decisions
Standard economic theory provides an explanation for the savings rates that individuals
should choose throughout their working life if they are behaving optimally. The lifecycle
saving theory of Ando, Brumberg and Modigliani (Modigliani and Brumberg, 1954; Ando
and Modigliani, 1957), and Friedman’s permanent income hypothesis (1957) both imply that
individuals attempt to smooth consumption over their lifetime in order to maximise expected
lifetime utility. In essence, in each period an individual can consume up to the annuity value
of his or her expected total (i.e., financial and human) wealth, and saving will take place only
when current income exceeds this annuity value.
Behavioural economics provides an alternative view that suggests saving decisions may be
driven by behavioural biases and thus may not be consistent with optimal behaviour. Previous
research shows that a large proportion, and often the majority, of employees are inclined to
take the ‘path of least resistance’ and passively adopt the default arrangements that exist in
their pension plan. For example, Choi et al. (2002) review US evidence on the tendency for members to accept plan defaults for key features such as the contribution rate and the
investment fund. Even though employees are free to opt out of default arrangements,
relatively few actually do. In the plans Choi et al. studied, between 42% and 71% of participants accept the default contribution rate, even though this was typically too low to
generate a reasonable replacement rate for retirement income.
Huberman et al. (2007) show that participation and saving rates rise with employee
compensation and that women save more than men. They also find that plan participation is
positively influenced by the presence of an employer contribution match and by the
availability of employer stock as an investment option.
2.2 Investment Decisions
A similar analysis applies to members’ investment choices: standard theory offers rational
driven by the existence of behavioural biases. Standard theory suggests that members choose
an investment strategy to maximise their expected lifetime utility. This, in essence, involves
maximising expected risk-adjusted portfolio returns, where a risk adjustment factor – the
ratio of the volatility (i.e., standard deviation) of the portfolio returns to the investor’s degree
of risk tolerance – is subtracted from expected returns.2 While risk tolerance is essentially
unobservable, psychometric questionnaires have been designed to attempt to measure it.
Hallahan et al. (2004) use one such measure and find that risk tolerance is higher amongst
males than females and generally increases with income and decreases with age. These results
would suggest that portfolio allocations, e.g. to equities rather than bonds, should similarly be
linked to these demographic and income variables.
Lifecycle investment theory (see, e.g. Bodie, 2003) holds that asset allocation should change
through the individual’s lifetime, with high weightings in risky assets during the earlier years
and lower risk assets used as retirement approaches. Various justifications have been given
for this based on the (possibly erroneous) notion that equities are less risky over long periods
of time than over short periods, and hence that the equity weighting should decline in the
period leading up to retirement, since there is less time to recover from a significant fall in
equity markets. However, a more satisfactory justification is that younger investors have a
substantial amount of their wealth tied up in human capital and generally a low weight in
financial capital. If this human capital is relatively low risk and bond-like in character, it can
allow greater equity risk to be taken in the individual’s financial portfolio.
Choi et al.’s (2002) finding of default bias applies to investment choice as well as to choice of
contribution rate. In the US plans that Choi et al. studied, between 48% and 81% of plan assets are invested in the default fund, which is typically a money market fund. Cronqvist and
Thaler (2004) also document widespread acceptance of the default fund in the Swedish
state-wide Premium Pension System. Use of the default fund was relatively low at the initial launch
of the plan when members were encouraged to make an active choice, but increases markedly
for subsequent waves of new entrants. Cronqvist and Thaler find that the average initial
entrant who made an active choice of investment portfolio earns lower returns than the
average investor in the default fund over the period from October 2000 to October 2003.
2
A number of other studies document potentially non-rational approaches to portfolio strategy
amongst DC pension plan members. For example, Benartzi and Thaler (2001) find DC
members use a 1/n naïve diversification heuristic, whereby they split their pension
contributions equally amongst the funds on offer. Huberman and Jiang (2006) counter argue
that many members equally weight across the subset of funds they have chosen, but do not
necessarily equally weight over all available choices, especially where ‘n’ is large.
Agnew et al. (2003) find that equity allocations in DC plans are higher for males and rise with
income and fall with age. Plan members make few changes through time in their asset
holdings. Furthermore, Agnew (2006) finds that higher paid employees make superior (i.e.,
more optimal) choices, being more likely to join the pension plan, holding less in company
stock, and being less likely to invest using the 1/n approach.
3. Data
The dataset we use is generated from the records of the DC pension plan of a UK FTSE-100
listed company. The data relate to the period of 12 months up to May 2006 and include
information on 3629 plan members. This represents all of the DC plan members with more
than one year’s service and who are not in addition accruing benefits under the company’s
defined benefit pension plan.
The dataset contains details on the contribution and investment decisions made by the pension
plan members, including their chosen contribution rate, investment fund choice, and any fund
switches they have made. The company runs a flexible benefits (“flex”) plan whereby
employees can choose the benefits most appropriate to them. The flex plan allows members to
choose pension contributions of between 4% and 12% of salary that will be made out of the
member’s flex allowance. The amount of allowance not spent on pension contributions can be
used to purchase non-pension benefits or be taken as additional cash salary. Plan members
allocating 12% from their flex allowance to pension contributions can contribute up to an
additional 6% of pre-tax salary to the plan and this attracts one-for-one matching from the
company.
In terms of investment, members have a choice of 11 funds (four active equity funds; four
passive equity funds; two bond funds; one cash fund). The plan operates a default fund for
for members contributing 10% of salary or less to the plan is 100% index-linked bonds.
Where a member is contributing more than 10% of salary to the plan, the default allocation is
100% index-linked bonds for the first 10% of salary and 100% equities for the remainder.3
We have data on both the allocation of contributions to different asset classes chosen by
members and the asset allocation of the portfolio, with the latter being the combined result of
previous asset purchases and the investment returns on these.
In addition, the dataset includes demographic variables (age and sex) and employment
variables (tenure and salary). These variables allow us to analyse cross-sectional differences
in contribution and investment decisions across plan members. Table 1 provides the
definitions of the variables used in this study.
[Table 1 about here]
It is also important to note the variables that are not in the data set. Unfortunately, we do not
know about aspects of the individuals’ finances outside the pension plan. So, for example, we
do not know about overall wealth levels, home ownership, and the composition of
non-pension investment portfolios. It is reasonable to assume that these variables will have a
bearing on the pension plan decisions made by at least some individuals. Equally, in terms of
demographic variables, we do not know the level of education of the individuals or their
marital and family status. We can use salary as a rough proxy for education. It is reasonable to
assume that marital and family status will have some effect on saving decisions, and
investment choices, the latter driven by attitudes to risk. Real world data often fails to be as
complete as researchers would like and we need to live with this constraint. Where relevant,
we discuss the impact these missing variables might have on our results.
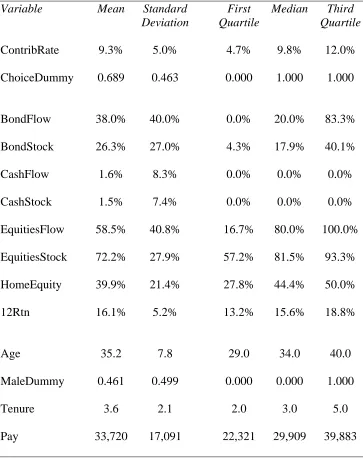
Table 2 provides descriptive statistics for the data. The average member is contributing 9.3%
of salary, which includes the contributions made on behalf of the member by the employer.
Sixty-nine percent of members have made an active choice of how to invest their
contributions, which is relatively high by comparison to evidence available on other plans
(e.g. Choi et al., 2002). However, members are relatively inactive, with the average number of
3
fund switches made in the 12-month period being 0.37. In fact, only 4.7% of members made
any switches during the period. The average member has chosen a contribution asset
allocation of approximately 60% equities and 40% bonds, although there is a wide range and
some members have an allocation of 100% bonds, while others have an allocation of 100%
equities. The average 12 month portfolio return is 16.1% reflecting a period when equity
markets did well. The average member is 35 years old, is paid £33,000 per annum and has
been in the DC plan for 3.6 years. Forty six percent of plan members are males.
[Table 2 about here]
4. Method
4.1 Hypotheses concerning contribution rates
Older employees are likely to have paid off (mortgage) debt and face reducing costs of
bringing up their families, implying increased income available for saving for retirement.
Retirement saving may simply be more meaningful for older employees who are closer to
retirement and less focused on housing and family expenses. Equally, higher-paid members
should have greater amounts available for saving, both absolute and relative to income. We
thus hypothesise, in line with lifecycle theory, that the saving rates of plan members will be a
positive function of both age and income. The main weakness in our ability to test this is that
we know only what the member is contributing to their pension plan and cannot track
non-pension saving. However, given the tax advantages of non-pension saving and the presence of
employer matching it makes sense for employees who have already built up some liquid
precautionary savings to take full advantage of pension saving before saving more on a
long-term basis through other channels.
The expected relationship between the member’s sex and pension contribution rate is
somewhat ambiguous. Females typically have longer life expectancy than males and often
also have interrupted careers. These factors would suggest the need for females to save more
than males when they are in work. However, to the extent that males occupy ‘breadwinner’
roles in households, males may feel a greater need to provide for their family in retirement.
Choi et al. (2002) document a default bias in the choices of DC pension plan members as
who take an interest in their retirement savings will choose an appropriate contribution rate –
rather than default or minimal levels – and choose an appropriate investment strategy, rather than accept the default fund. It follows from this that there should be a positive relationship
between the contribution rate and making an active fund choice.
Finally, the amount each member saves should be related to their desired level of pension in
retirement. Plan members differ in the asset allocation chosen for their contributions. Given
that equities have a higher expected return than bonds, it follows that, other things being
equal, equity investors need to save less, on average, over the long run than bond investors.
We thus expect a negative relationship between the contribution rate and the allocation of
contributions to equities. Given that the default fund is index-linked bonds for most members,
there will be a positive relationship between making an active investment choice
(ChoiceDummy) and the allocation to equities (EquitiesFlow). Members who opt out of the
default fund and make an active fund choice typically end up with higher equity allocations.
Hence, when we test EquitiesFlow we do so in an alternative equation in which we drop
ChoiceDummy.
Putting these conjectures together leads to us to test the following regressions:
(1a) ContribRate = Constant + bAAge + bMDMaleDummy + bLPLogPay + bCDChoiceDummy
(1b) ContribRate = Constant + bAAge + bMDMaleDummy + bLPLogPay + bEFEquitiesFlow
The variable definitions are as given in Table 1. We estimate the regression using a Tobit
approach.4 In addition to the basic specification of the model, we test a non-linear version of
Age (AgeSquared) and interaction terms between the variables.
4.2 Hypotheses concerning investment choice
Choi et al.’s (2002) default bias implies that many members will passively accept the plan’s
4
default investment fund rather than make an active investment choice of their own. Some
members will make an active choice and it seems plausible that this should be positively
related to tenure (as people learn about what their colleagues are doing over time) and income
(as a proxy for education) and negatively related to age (as older employees are typically
more cautious than younger employees). Active fund choice may also be related to sex, e.g.
due to higher levels of overconfidence documented amongst males (Barber and Odean, 1999).
To test this, we run the following Logit regression:
(2) ChoiceDummy = Constant + bAAge + bMDMaleDummy + bTTenure + bLPLogPay
We also test for non-linear relationships by using squared versions of Age and Tenure and
allow for interactions between relevant variables.
For members who make an active choice of investment, the asset allocation chosen should
reflect the member’s attitude to risk. Hallahan et al. (2004) find subjective risk tolerance to be
higher amongst males, positively related to income and negatively related to age. This implies
that members’ equity allocations should be similarly related. Furthermore, the lifecycle
investment approach of Bodie (2003) implies lower allocations to equities at older ages.5
To test this, we run the following regression using Tobit estimation:
(3) EquitiesFlow = Constant + bA Age + bMDMaleDummy + bLPLogPay
As before, we also allow for the prospect of a nonlinear relation with age by including
AgeSquared.
We estimate the model in (3) in two forms. In Model A, we estimate for all members in our
sample, but include ChoiceDummy as a control variable, because for most members the
5
The equity allocation decision could also be driven by the past performance of equities relative to other asset
classes, for example with scheme members increasing equity weights in response to high past returns.
Unfortunately, we do not have a sufficiently long time series of fund returns and investment decisions to be able
default fund is 100% bonds. Model B is estimated for only those members who have made an
active choice of investment fund and hence there is no need for the ChoiceDummy control
variable. There are a total of 2499 plan members who have made an active investment choice.
We use the allocation of contributions (i.e. “Flow”) rather than allocations of account
balances because, as Huberman and Jiang (2006, p769) note, account balances reflect
cumulative returns as well as past choices and there is evidence that few members rebalance
portfolios to achieve target allocations.
Portfolio diversification represents another dimension on which members must make a
choice. Members can diversify internationally as well as across asset classes. The funds on
offer in the plan are diversified equity portfolios mostly with a regional focus, together with
domestic bonds and cash funds. A large literature exists showing that many investors maintain
a high proportion – often 80% or more – of their investments in securities listed in their own
country, e.g. French and Poterba (1991) and Kang and Stultz (1997). There have been
attempts to offer rational explanations for this feature, for example, due to information costs.
Pension plan investors may concentrate their investments in local markets to avoid taking
currency risk relative to their future spending plans. However, there are also behavioural
explanations, such as familiarity bias (Huberman, 2001). We examine the degree of home
equity allocation in plan members’ equity allocations. We seek to understand whether certain
groups of employees are more or less prone to home equity allocation than others.
HomeEquity is defined as the percentage of the member’s equity exposure accounted for by
domestic equity. We do not examine the proportion of domestic assets in total assets, because
this relationship is confounded by the fact that any investor wanting a low-risk portfolio only
has domestic bonds and cash to choose as low-risk assets. Hence, a reduction in the portfolio
risk level necessarily involves a higher domestic allocation.
We test the following regression using Tobit estimation:
(4) HomeEquity = Constant + bAAge + bMDMaleDummy + bLPLogPay
We estimate this relationship only for those scheme members who have made an active
choice of funds. We also allow for nonlinearity by including AgeSquared and allow for
An additional consideration in terms of investment choice is that while members of the plan
can choose their own asset allocation, they must do so from a set of 11 funds offered in the
plan. An important question is how members diversify across the key asset classes (especially
equities and bonds) using the funds offered and the influence the fund menu has on their
decisions. Our data allow us to test for plan members using the naïve 1/n or the conditional
1/n approaches to diversification.
Testing for 1/n is simply a matter of examining what proportion of members invest in all 11
funds and how many of those do so in equal proportions. To test for the conditional 1/n
approach, we follow the approach of Huberman and Jiang (2006). They sort plan members by
the number of funds they have chosen and then assess what proportion of members in each
category is following a conditional 1/n strategy. To do so, they calculate the Herfindahl
concentration index for each member’s portfolio allocation, which is defined as the sum of the
squared fractions of contributions to each fund. For example, the Herfindahl index for an
investor who chooses two funds and puts 50% in each is 0.5 (i.e., 0.52 + 0.52). The Herfindahl
index can range from 1/n through to 1. Huberman and Jiang argue that an investor is “close”
to following a 1/n strategy if the total deviation of their fund allocation from a pure 1/n
strategy is no more than 20%: in the two-fund case, this equates to a 55:45 allocation. This
allows them to calculate an upper bound for the Herfindahl index than can be interpreted as
being consistent with the plan member following a conditional 1/n strategy. We adopt this
approach in our analysis.
Our final test on investment choice is to examine the number of funds chosen by plan
members. We have already sought to understand the determinants of equity allocation and
home equity allocation and there are likely to be interrelations between those decisions and
the decision on the number of funds to hold. We run a regression that seeks to explain fund
choice in terms of the demographic variables used previously: age, sex, and pay. We include
Tenure as an explanatory variable on the basis that the number of funds used may increase the
longer the member has spent in the plan. Again we allow for nonlinear relationships and
interactions between relevant variables. Given that the number of funds is a count variable,
we use Poisson regression to estimate the equation:
5. Results
5.1 Results concerning contribution rates
Tables 3A and 3B show the regression models that we use to explain members’ contribution
rates. In the first column of each table, we show a basic nonlinear specification of the model.
In the second column, we include some nonlinear and interaction terms. Finally, we show a
final form where insignificant variables have been dropped.
It is clear from column 1 of Tables 3A and 3B that pension contributions are positively related
to age and income, which is broadly consistent with lifecycle saving theory. In the non-linear
version of the model in column 2, there appears to be a positive linear relationship between
Age and ContribRate, but the relationship with AgeSquared is not statistically significant. The
second columns of both tables also show that there is a significant interaction effect between
Age and LogPay, indicating that the combined effect of high pay and high age leads to higher
contribution rates. However, the LogPay coefficient in the second column is lower than the
corresponding coefficient in the first column, while the Age coefficient has not changed
much. This suggests that higher age has a larger effect on raising contribution rates that higher
pay. A younger person with the same pay as an older person will make lower pension
contributions on average.
[Tables 3A and 3B about here]
The final form of the model in Table 3B has a higher log likelihood than that in Table 3A, so
we will examine this model in more detail. Every ten-year increase in Age is associated with
contribution rates one percentage point of salary higher. The LogPay coefficient implies that
contribution rates are approximately 0.7 of a percentage point higher for an employee on a
salary of £50,000 relative to one on £30,000. In addition, males have a 0.9 percentage point
higher contribution rate than females, controlling for age and income. This latter result is
contrary to the expectation that females will need to save more to deal with the effects of
longer lives and careers interrupted by child care.
Our final contribution-rate hypothesis was that members who take a conservative, bond-based
portfolio. The coefficient on the EquitiesFlow variable shows that the opposite appears to be
the case, with bond investors saving less than equity investors.6 Other things being equal, a
member 100% invested in equities saves an additional three percentage points of salary
relative to a member 100% invested in bonds. This might imply that both contribution rate
and equity allocation are related to some measure of financial sophistication.
5.2 Results concerning investment choice
Our first analysis of investment choice seeks to understand the characteristics of members
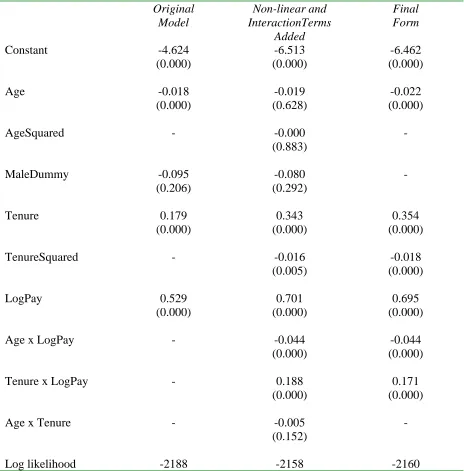
who make an active choice of investment strategy rather than accept the default fund. Table 4
shows the results of a logit regression where the dependent variable is ChoiceDummy, which
takes the value one if the member has made an active fund choice and zero otherwise.
[Table 4 about here]
The results in the final form column7 show that older scheme members are less likely to make
an active fund choice: the Age coefficient is significantly negative. Given that for most
members (contributing less than 10% of salary), the default is 100% bonds, it may be that
older members are more likely to regard this default asset allocation as suitable for their needs
than younger members who may desire higher return investments. There does not appear to
be any relationship between the probability of making an active investment choice and the sex
of the member.
The probability of making an active choice has a positive linear relationship with Tenure and
a negative relationship with TenureSquared. Given the relative sizes of the two coefficients,
this implies that members tend to accept the default when they first join the plan, eventually
get around to making an active choice once they have been in the plan for some time, but with
this effect attenuating for very long-tenured plan members: this implies that if the member has
not made the decision to switch after a certain time, he or she becomes increasingly less likely
to do so subsequently.
6
We drop the ChoiceDummy variable from Model B as it is highly correlated with EquitiesFlow. 7
The coefficient on LogPay suggests higher-paid members are more likely to make an active
investment choice, which may mean pay is acting as a proxy for education and financial
sophistication. There are statistically significant but opposite interaction effects between Age
and LogPay and Tenure and LogPay on the active choice which reinforces the direct effects of
Age and Tenure. On the one hand, the combination of high age and high pay has a negative
effect on choice which is in addition to the direct age effect. On the other hand, the
combination of high tenure and high pay has a positive effect on choice which is in addition
to the direct tenure effect. There is little change to the LogPay coefficient between the second
and third columns, indicating that these interaction effects are dominated by the Age and
Tenure, respectively.
The most significant investment choice plan members have to make is the proportion of their
contributions to invest in equity funds. Tables 5A and 5B show the analysis of this decision.
Table 5A shows the results for the full sample using ChoiceDummyas a control to account
for the default fund being 100% bonds for most members. Table 5B shows models estimated
for only those members who have made an active choice of investment fund.
[Tables 5A and 5B about here]
The coefficients for both sets of models are qualitatively similar, although the log likelihoods
for the models in Table 5B are higher. The linear model suggests that older members invest
less in equities than younger members, consistent with lifecycle asset allocation. However,
the other model specifications suggest the relationship is non-linear. The combination of the
coefficients on Age and AgeSquared imply that equity allocations rise with member age until
late-20s, and fall thereafter. Other things being equal, the equity allocation is higher for males
than females (by approximately nine percentage points) and higher for those on higher
incomes. The interaction effect between Age and LogPay is not statistically significant in
either specification. These results are broadly consistent with Hallahan et al.’s (2004) analysis
of subjective risk tolerance scores and with Agnew et al.’s (2003) analysis of one large US
DC plan.
In addition to choosing an allocation to equity, members may choose the international
diversification of their portfolio. Across the whole sample, members allocate an average of
domestic equity funds. Taking only those members who have made an active choice of
investment funds, the corresponding domestic weights are 48% of total assets and 38% of
equity assets. Members may allocate a high proportion to the domestic markets because their
liabilities (i.e. spending needs in retirement) are denominated in sterling. Alternatively, there
may be some degree of home bias, for example, due to familiarity. In any case, the degree of
emphasis on the domestic markets in this sample appears to be less extreme than found in
many previous studies.
Table 6 shows the results of a regression equation attempting to explain which members
choose high weightings in domestic equities. The dependent variable is the proportion of the
overall equity allocation accounted for by domestic equity (HomeEquity). There is a positive
relationship between the domestic equity share and Age and males hold approximately four
percentage points less domestic equity than females.
[Table 6 about here]
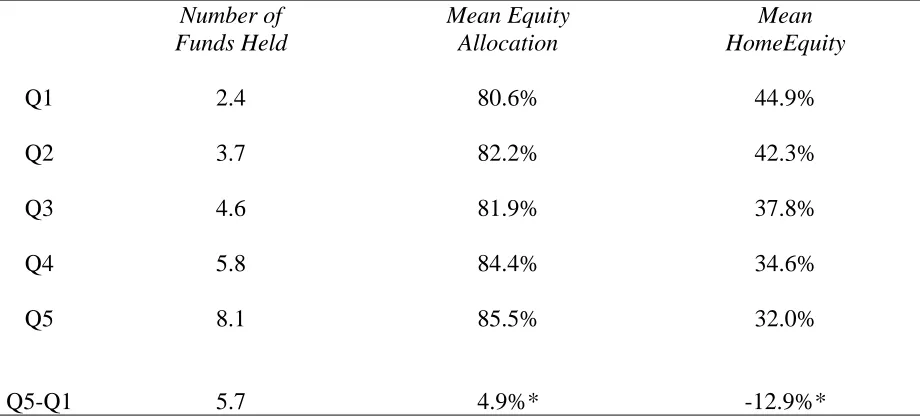
One question that arises from the foregoing analysis of equity allocation and domestic
allocation is the extent to which both are determined by the level of financial sophistication of
the investor. The data shown in Table 7 suggest this is the case. The table shows data ranked
into quintiles by number of funds held in each member’s portfolio. High numbers of funds are
more likely to be complex portfolios held by relatively sophisticated investors. The table
provides some support for this by showing that the more complex portfolios have higher
equity weightings (by approximately five percentage points, taking quintile 5 – quintile 1) and
lower domestic weights (by approximately 13 percentage points on the same basis.)
[Table 7 about here]
To continue the analysis of diversification, Table 8 shows the distribution of number of fund
choices. The table shows a maximum of 10 funds. Members have 11 funds to choose from,
but in the data set provided to us, the index-linked bond fund and corporate bond fund
holdings have been aggregated. The mean number of funds chosen is 4.2, while the median is
4. Panel A shows that over 60% of members choose 3, 4 or 5 funds. These figures are broadly
members (or 12 in number) are invested across all 10 funds, suggesting that Benartzi and
Thaler’s 1/n rule is not a valid description of the members’ behaviour.
[Table 8 about here]
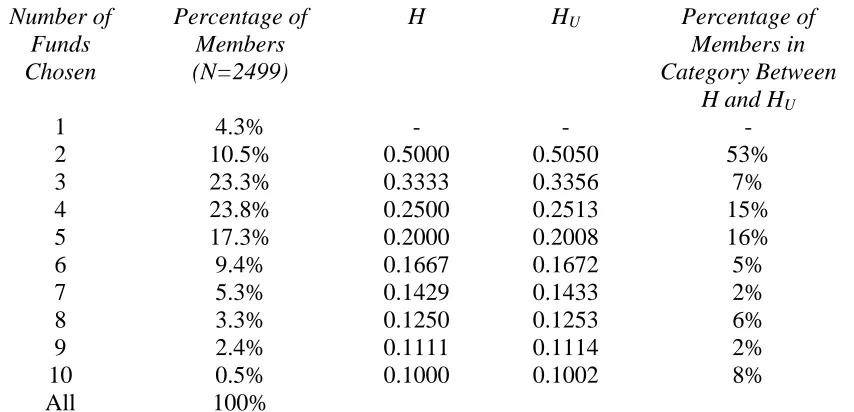
Panel A shows the percentage of members with allocations to a particular number of funds
and the percentage in each category whose allocations are consistent with them following a
conditional 1/n strategy. The final column of the table shows the percentage of members in
that category of fund choice who have a Herfindahl index value within the range from H to
HU. The table shows that more than half of members who choose two funds opt for a 50:50
allocation, or something close to it. A conditional 1/n strategy is less common amongst
members who have chosen more than two funds, although there is an interesting spike in the
proportion of members who follow the conditional 1/n approach amongst those who have
chosen 4 or 5 funds. The conditional 1/n approach appears to be most popular where the “n”
is a number that is easy to divide by. In total, just over 14% of plan members follow a strategy
that is close to the conditional 1/n approach using Huberman and Jiang’s definition.
It is important to note, as Huberman and Jiang do in their analysis, that these results say
nothing of the rationality of the individual fund choices. A 50:50 allocation between two of
the funds on offer in this plan might well be an optimal choice for a member with a particular
risk tolerance.
Panel B of Table 8 expands the analysis of the allocation choice made by members who invest
in two funds. A total of 50.8% of these members adopt an exact 50:50 allocation of their
contributions. For the remaining members, allocations cluster on other ‘round’ numbers. A
75:25 allocation is chosen by 16% of members and only 5.7% of members in the two funds
category choose allocations other than in units of ten percentage points. Again, there is
nothing to say these allocations are not rational, but they are also consistent with members
using simple heuristics when deciding on the contribution allocation.
We turn now to an attempt to explain the number of funds chosen by members to create their
portfolio. Taking the number of funds held as a proxy for portfolio complexity, the results in
the third column of Table 9 show a statistically significant, but economically small negative
simpler portfolios with fewer funds. There is a positive relationship between portfolio
complexity and pay. There is no significant relationship between portfolio complexity and the
sex of the member. There is a small and statistically significant positive relationship between
number of funds used and TenureSquared. None of the interaction variables is statistically
significant, consistent with the findings in Table 4 on active fund choice.
[Table 9 about here]
6. Conclusions
In this paper, we have used a private administrative dataset to examine the contribution and
investment decisions made by members of a large UK-based DC plan which is sponsored by a
FTSE-100 company. We find a number of aspects of decision making by some members that
appear to reflect rational optimising approaches and financial sophistication. For example,
there is evidence of lifecycle saving patterns in contribution rates and asset allocation varying
with age in a manner consistent with lifecycle investing. However, we also find evidence
consistent with behavioural bias and potentially irrational approaches. For example, relatively
high use of the default fund, home bias, and some evidence of conditional 1/n diversification
approaches. Nevertheless, the extent of rational behaviour is somewhat surprising and might
be a consequence of the effectiveness of the company’s pensions communications strategy.
While we are unable to test this directly, we can conjecture that a reasonably good pensions
communications strategy would be more effective at communicating the importance of saving
for retirement than with getting across the message of efficient risk diversification. This is
what we find here. As a consequence, the members of this pension scheme are much closer to
being rational lifecycle optimisers than many other recent studies have found.
The analysis in this paper provides a starting point for company management considering the
focus of pensions-related communications for the workforce, in terms of topic area and in
terms of the demographic profile of employees most in need of guidance.
References
Agnew J. (2006) ‘Do behavioural biases vary across individuals: Evidence from individual
Agnew J., P. Balduzzi, and A. Sunden (2003) ‘Portfolio choice and trading in a large 401(k)
plan’ American Economic Review, 93:1, 193-215.
Ando A. and Modigliani F. (1957) ‘The life cycle hypothesis of saving: Aggregate
implications and tests’ American Economic Review, 53, 55-84
Barber B. and T. Odean (1999) ‘The courage of misguided convictions: The trading
behaviour of individual investors’ Financial Analyst Journal, November/December 1999, 41-55.
Benartzi S. and R. Thaler (2001) ‘Naïve diversification strategies in retirement saving plans’
American Economic Review, 91, 79-98.
Bodie Z. (2003) ‘Thoughts on the future: Lifecycle investing in theory and practice’ Financial Analysts Journal, January / February 2003, 24-29.
Byrne A. (2004) ‘Investment decision making in defined contribution pension plans’
Pensions, 10:1, 37-49.
Campbell, J., and Viceira, L. (2002) Strategic Asset Allocation: Portfolio Choice for Long-term Investors, Oxford University Press, Oxford.
Choi J., D. Laibson, B. Madrian, and A. Metrick (2002) ‘Defined contribution pensions: Plan
rules, participant decisions, and the path of least resistance’ in James Poterba, ed., Tax Policy and the Economy 16, 2002, 67-114.
Cronqvist H. and R. Thaler (2004) ‘Design choices in privatized social-security systems:
Learning from the Swedish experience’ American Economic Review 94:2, 424-428.
French K. and J. Poterba (1991) ‘Investor diversification and international equity markets’
American Economic Review, 81, 222-226.
Gomes, F., and A. Michaelides (2005) ‘Optimal life-cycle asset allocation: Understanding the
empirical evidence’, Journal of Finance, 60, 869-904.
Hallahan T., R. Faff and M. McKenzie (2004) ‘An empirical investigation of personal
financial risk tolerance’ Financial Services Review, 13, 57-78.
Huberman G. (2001) ‘Familiarity breeds investment’ Review of Financial Studies, 14:3, 659-680.
Huberman G. and W. Jiang (2006) ‘Offering vs. choice by 401(k) plan participants: Equity
exposure and number of funds,’ Journal of Finance, 61:2, 763-801.
Huberman G., S. Iyengar, and W. Jiang (2007) ‘Defined contribution pension plans:
Determinants of participation and contribution rates’ Journal of Financial Services Research, 31:1, 1-32.
Kang J. and R. Stulz (1997) ‘Why is there a home bias? An analysis of foreign portfolio
ownership in Japan’ Journal of Financial Economics, 46, 3-28.
Merton, R.C. (1971) ‘Optimum consumption and portfolio rules in a continuous time model’
Journal of Economic Theory, 3, 373-413.
Merton, R.C. (1973) ‘An intertemporal capital asset pricing model’ Econometrica, 41, 867-87.
Mitchell O. and S. Utkus (2004) ‘Lessons from behavioural finance for retirement plan
design’ in O’ Mitchell and S. Utkus, eds, Pension Design and Structure: New Lessons from Behavioural Finance. Oxford, UK: Oxford University Press, 2004.
Modigliani F. and R. Brumberg (1954) ‘Utility analysis and the consumption function: An
Table 1 – Variable definitions
Variable Definition
ContribRate Combined employer and employee pension contribution as a proportion of the member’s salary.
ChoiceDummy Dummy variable that takes the value of one if the member has made an active fund choice and zero if the member is invested only in the default fund.
BondFlow Member’s chosen allocation of contributions to bond funds as a proportion of the total.
BondStock Asset allocation of the member’s portfolio to bond funds as a proportion of the total.
CashFlow Member’s chosen allocation of contributions to cash funds as a proportion of the total.
CashStock Asset allocation of the member’s portfolio to cash funds as a proportion of the total.
EquitiesFlow Member’s chosen allocation of contributions to equity funds as a proportion of the total.
EquitiesStock Asset allocation of the member’s portfolio to equity funds as a proportion of the total.
HomeEquity The proportion of the allocation of contribution to equities that is accounted for by domestic (i.e. UK) equities.
12Rtn Total return on the member’s pension account in 12 months to May 2006.
Age Member’s age in years.
MaleDummy Dummy variable that takes the value one if the member is male and zero if the member is female.
Tenure Member’s tenure in employment with the company in years.
Table 2 – Descriptive statistics
Variable Mean Standard
Deviation
First Quartile
Median Third Quartile
ContribRate 9.3% 5.0% 4.7% 9.8% 12.0%
ChoiceDummy 0.689 0.463 0.000 1.000 1.000
BondFlow 38.0% 40.0% 0.0% 20.0% 83.3%
BondStock 26.3% 27.0% 4.3% 17.9% 40.1%
CashFlow 1.6% 8.3% 0.0% 0.0% 0.0%
CashStock 1.5% 7.4% 0.0% 0.0% 0.0%
EquitiesFlow 58.5% 40.8% 16.7% 80.0% 100.0%
EquitiesStock 72.2% 27.9% 57.2% 81.5% 93.3%
HomeEquity 39.9% 21.4% 27.8% 44.4% 50.0%
12Rtn 16.1% 5.2% 13.2% 15.6% 18.8%
Age 35.2 7.8 29.0 34.0 40.0
MaleDummy 0.461 0.499 0.000 0.000 1.000
Tenure 3.6 2.1 2.0 3.0 5.0
Pay 33,720 17,091 22,321 29,909 39,883
Table 3A – Tobit regression of contribution rate on demographic, choice and income variables Original Model Non-linear and InteractionTerms Added Final Form Constant -0.122 (0.000) -0.101 (0.000) -0.099 (0.000) Age 0.001 (0.000) 0.001 (0.098) 0.001 (0.000)
AgeSquared - -0.000
(0.8171) - MaleDummy 0.011 (0.000) 0.011 (0.000) 0.011 (0.000) LogPay 0.015 (0.000) 0.012 (0.000) 0.013 (0.000) ChoiceDummy 0.022 (0.000) 0.022 (0.000) 0.022 (0.000)
Age x LogPay - 0.001
(0.001)
0.001 (0.001)
Log likelihood 5968 5982 5982
N=3629. Dependent variable is ContribRate, which is the combined employer and employee pension contribution rate as a proportion of the member’s salary and expressed as a decimal. Independent variables as defined in Table 1. See equation (1a) in the text. P-values in brackets based on Huber/White adjusted standard errors. Interaction variables are centred by
Table 3B – Tobit regression of contribution rate on demographic, choice and income variables Original Model Non-linear and InteractionTerms Added Final Form Constant -0.111 (0.000) -0.079 (0.001) -0.088 (0.000) Age 0.001 (0.000) 0.000 (0.586) 0.001 (0.000)
AgeSquared - 0.000
(0.316) - MaleDummy 0.010 (0.000) 0.009 (0.000) 0.009 (0.000) LogPay 0.014 (0.000) 0.011 (0.000) 0.011 (0.000) EquitiesFlow 0.031 (0.000) 0.032 (0.000) 0.032 (0.000)
Age x LogPay - 0.001
(0.001)
0.001 (0.001)
Log likelihood 6014 6030 6029
N=3629. Dependent variable is ContribRate, which is the combined employer and employee pension contribution rate as a proportion of the member’s salary and expressed as a decimal. Independent variables as defined in Table 1. See equation (1b) in the text. P-values in
Table 4 – Logit regression of active fund choice dummy variable on demographic and employment variables Original Model Non-linear and InteractionTerms Added Final Form Constant -4.624 (0.000) -6.513 (0.000) -6.462 (0.000) Age -0.018 (0.000) -0.019 (0.628) -0.022 (0.000)
AgeSquared - -0.000
(0.883) - MaleDummy -0.095 (0.206) -0.080 (0.292) - Tenure 0.179 (0.000) 0.343 (0.000) 0.354 (0.000)
TenureSquared - -0.016 (0.005) -0.018 (0.000) LogPay 0.529 (0.000) 0.701 (0.000) 0.695 (0.000)
Age x LogPay - -0.044
(0.000)
-0.044 (0.000)
Tenure x LogPay - 0.188
(0.000)
0.171 (0.000)
Age x Tenure - -0.005
(0.152)
-
Log likelihood -2188 -2158 -2160
Table 5A – Tobit regression of equity allocation of contributions on demographic and employment variables – full sample
Original Model Non-linear and InteractionTerms Added Final Form Constant -0.743 (0.000) -1.178 (0.000) -1.220 (0.000) ChoiceDummy 1.028 (0.000) 1.022 (0.000) 1.020 (0.000) Age -0.0047 (0.000) 0.042 (0.000) 0.039 (0.000)
AgeSquared - -0.001
(0.000) -0.001 (0.000) MaleDummy 0.092 (0.000) 0.089 (0.000) 0.090 (0.000) LogPay 0.073 (0.000) 0.031 (0.039) 0.042 (0.008)
Age x LogPay - 0.003
(0.157)
-
Log likelihood -1855 -1827 -1828
Table 5B – Tobit regression of equity allocation of contributions on demographic and employment variables – active choosers only
Original Model
Non-linear and InteractionTerms
Added
Final Form
Constant 0.309 (0.095)
-0.411 (0.047)
-0.416 (0.049)
Age -0.011 (0.000)
0.055 (0.000)
0.055 (0.000)
AgeSquared - -0.001
(0.000)
-0.001 (0.000)
MaleDummy 0.090 (0.000)
0.086 (0.000)
0.086 (0.000)
LogPay 0.093 (0.000)
0.044 (0.015)
0.045 (0.014)
Age x LogPay - 0.000
(0.909)
-
Log likelihood -1345 -1307 -1307
N=2499. Dependent variable is EquitiesFlow which is the member’s choice of the proportion of contributions to be allocated to equity funds, expressed as a decimal. The independent variables are as defined in Table 1. Model is estimated using only those members who have made an active choice of investment fund. See equation (3) in the text. P-values in brackets based on Huber/White adjusted standard errors. Interaction variables are centred by
Table 6 – Tobit regression of domestic proportion of equity allocation on demographic and income variables
Original Model
Non-linear and InteractionTerms
Added
Final Form
Constant 0.232 (0.085)
0.312 (0.048)
0.324 (0.000)
Age 0.002 (0.044)
-0.005 (0.424)
0.002 (0.021)
AgeSquared - 0.000
(0.299)
-
MaleDummy -0.041 (0.000)
-0.041 (0.000)
-0.040 (0.000)
LogPay 0.009 (0.485)
0.014 (0.338)
-
Age x LogPay - -0.000
(0.908)
-
Log likelihood -494 -493 -494
Table 7 – Equity allocation and domestic equity share by portfolio complexity
Number of Funds Held
Mean Equity Allocation
Mean HomeEquity
Q1 2.4 80.6% 44.9%
Q2 3.7 82.2% 42.3%
Q3 4.6 81.9% 37.8%
Q4 5.8 84.4% 34.6%
Q5 8.1 85.5% 32.0%
Q5-Q1 5.7 4.9%* -12.9%*
Table 8 – Fund allocation decisions
Panel A: Number of funds chosen and Herfindahl indexes
Number of Funds Chosen
Percentage of Members (N=2499)
H HU Percentage of
Members in Category Between
H and HU
1 4.3% - - -
2 10.5% 0.5000 0.5050 53%
3 23.3% 0.3333 0.3356 7%
4 23.8% 0.2500 0.2513 15%
5 17.3% 0.2000 0.2008 16%
6 9.4% 0.1667 0.1672 5%
7 5.3% 0.1429 0.1433 2%
8 3.3% 0.1250 0.1253 6%
9 2.4% 0.1111 0.1114 2%
10 0.5% 0.1000 0.1002 8%
All 100%
Panel B: Allocation choices of members with two funds
Fund Allocation
Percentage of Members
(N=262)
50:50 50.8% 60:40 8.4% 70:30 7.6% 75:25 16.0% 80:20 7.3% 90:10 4.2% Other Splits 5.7%
All 100%
In Panel A Number of Funds Chosen is the number of funds to which the member has a non-zero allocation of contributions. The Percentage of Members is based only on those members who have made an active choice of investment funds. H is the value of the Herfindahl index that is consistent with an allocation of contributions of 1/n, where n is the number of funds chosen. HU is the upper bound of the Herfindahl index that is
Table 9 – Poisson regression of number of funds on demographic and employment variables Original Model Nonlinear and Interaction Terms Added Final Form Constant 0.689 (0.004) 0.592 (0.025) 0.647 (0.059) Age -0.007 (0.000) 0.014 (0.195) -0.007 (0.000)
AgeSquared - -0.000 (0.057) - MaleDummy 0.026 (0.132) 0.028 (0.106) - LogPay 0.106 (0.000) 0.083 (0.002) 0.113 (0.000) Tenure 0.007 (0.094) -0.019 (0.056) -
TenureSquared - 0.002
(0.012)
0.001 (0.006)
Age x LogPay - 0.002
(0.494)
-
Tenure x LogPay - 0.012
(0.194)
-
Age x Tenure - -0.001
(0.229)
-
Log likelihood -5280 -5275 -5280