CASE STUDIES OF OUTDOOR TESTING AND ANALYSIS OF BUILDING COMPONENTS
P A Strachan1 and L Vandaele2
1
ESRU, University of Strathclyde, Glasgow, Scotland
2
Belgian Building Research Institute, Sint-Stevens-Woluwe, Belgium
Contact: Paul Strachan, Energy Systems Research Unit, University of Strathclyde, 75 Montrose Street, Glasgow, Scotland, UK
Abstract
The construction and development of the PASSYS/PASLINK outdoor test cells were funded by the European Commission with the objective of providing high quality test environments for quantifying the performance of passive solar building components. Over the years since the original test cells were commissioned, the initial concept for outdoor testing has been extended to include other test cell types. Significant improvements have been made to the experimental procedures and analysis techniques, and a broad range of components has been tested.
This paper describes representative experiments that have been conducted using these highly controlled outdoor test environments, indicates some of the related analysis, and shows the type of information that can be obtained from such tests. It demonstrates the way in which component performance can be ascertained in the realistic external environment. The case studies chosen range from building component tests within EC research projects to commercial tests, and from conventional building components to novel integrated facade systems. They also include a large range of passive and active components.
Each case study summarises the test component, the purpose of the test, details of the test configuration (period of test, instrumentation etc.), results and analysis, and associated modelling and monitoring where appropriate. The paper concludes with an appraisal of the advantages and limitations of the test cells for the various component types.
Keywords: Test cells, dynamic testing, thermal and solar properties
1. Introduction
The objective of the study reported here was to collate, document and disseminate existing case studies to illustrate the work of the European network of research teams involved in outdoor testing of building components, in order to demonstrate the methodology and the potential benefits to designers and manufacturers of existing and novel building components.
The methodology adopted by PASLINK involves performance testing of the building components, the application of identification techniques to extract key standard performance metrics, and scaling and replication by simulation as a mechanism for extrapolating to the full scale. Several of the case studies show how the outdoor tests have linked into the overall component evaluation.
A template was constructed to guide the consistent documentation of the case studies. Each case study summarizes the test component, the purpose of the test, details of the test configuration (period of test, instrumentation etc), results and analysis, and associated modelling and monitoring where appropriate. In all cases, standard PASLINK procedures were followed and extended where necessary. References are given to more comprehensive reports where available.
A total of ten documented case studies demonstrate the application of the PASLINK network's methodology to a range of building components. The main elements of these case studies are given in this paper, with emphasis given to different aspects (e.g. instrumentation, test procedure, uses of the data, associated modelling). Further details can be obtained from the references given with the individual case studies.
2. Selection of Case Studies
Table 1 shows the selected case studies summarised in this paper, grouped according to component type. There are a number of studies focussed on passive systems (solar and ventilation facade components, shading elements, roof components, and attached passive solar components) and active systems (photovoltaic and thermal solar collectors). One test demonstrates an application with equipment in the test room. The following sections summarise the main features of these tests.
<Table 1: Case Studies>
3. Advanced Glazing Components
A range of glazing and window systems were tested in PASLINK cells in the framework of the IMAGE project [2], [3]:
̇ Multi-glazed systems with advanced features (improved triple glazing, selective glazing, selective and diffusing glazing);
̇ Variable transmittance systems (incorporated blind system, electrochromic glazing);
̇ Framing systems (curtain wall framing system, air supply window).
An example of a test underway is given in Figure 1.
<Figure 1: Advanced glazing component mounted on PASLINK test cell>
The purpose of the tests was to establish a standard test procedure especially dedicated to advanced glazing systems, to determine as accurately as possible the "outdoor" thermal, solar and daylight characteristics of advanced glazing systems. The high quality datasets collected were also used for calibrating component models in the simulation programs used in the study before the programs were used to investigate full-scale building applications of the glazing systems. For this, the calibration and scaling procedures described in [4] were followed.
The following parameters were identified as relevant for the evaluation of the glazing system performances and were therefore determined:
̇ thermal properties (central U-value of the glazing, U-value of the window frame, overall U-value of the window)
̇ solar properties (direct solar transmission factor, total solar energy transmission factor)
̇ visual properties (light transmission factor).
For most of the components, the tests were carried out in 3 steps as shown in Figure 2:
̇ A first thermal testing phase during which the test component is protected from solar radiation by an opaque screen, with forced convection of the outdoor air at a speed of 4 m/s from top to bottom over the test component (called a movable cold box). This testing phase allows the determination of the thermal characteristics of the component (central U-value, UA-value, etc.).
̇ A second testing phase without the movable cold box, aimed at assessing the solar and daylight performances of the component (total and direct solar transmission factors).
̇ A third, shorter, testing phase which aims specifically at providing a model calibration dataset for the daylight modelling of the component.
<Figure 2: Structure of the outdoor test procedure>
An example of the results is shown in Figure 3 which compares the results for 3 different multi-glazing systems measured on outdoor test cells (at the Belgian Building Research Institute at Limelette, Belgium and the Building Research Establishment in East Kilbride, Scotland), and in laboratories with a heat flux meter (Fraunhofer Institute, FhG-ISE, in Germany) and a hot box (Pilkington in Lathom, England).
<Figure 3: Measured central U-values for multi-glazed systems (MGS)>
The comparison of the obtained values shows that good agreement is found between direct outdoor measurements and laboratory test results since the confidence intervals overlap for the three multi-glazed systems. Measurement discrepancies are acceptable considering the measurement accuracies and are partly due to the differences in test conditions (heat exchange coefficients, temperature dependence, etc).
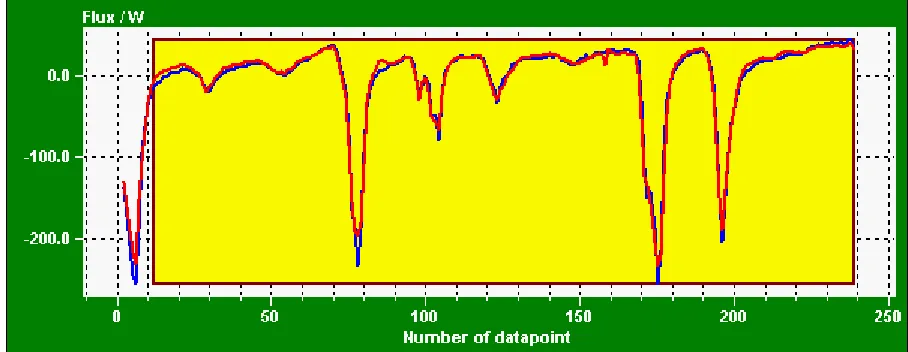
A major part of the IMAGE project was devoted to the development of better computer modelling techniques for representing the performance of advanced glazed elements applied in buildings. Within the project, ESP-r [5] was used to assess the thermal performance and Radiance [6] was used for internal lighting assessment. Data from the test cells were used to check model predictions for several of the advanced glazing components, prior to undertaking detailed analysis of these components on full-scale buildings [3]. One example of the comparisons is given in Figure 4, which show the measurements and modelling predictions together with the differences between them (the residuals).
4. Window Component
Within the International Energy Agency (IEA) Solar Heating and Cooling Programme's project "Task 13, Advanced Solar Low Energy Buildings" an urban villa was to be built in Amstelveen, The Netherlands [7]. The design, building process and monitoring/evaluation were supervised by Damen Consultants B.V., who was the main partner in this IEA project. Facade elements were tested in the PASLINK test cell at TNO, as prototypes for the "Urban Villa". The façade is shown in Figure 5, having the following main characteristics:
̇ main windows triple glazed, krypton filled
̇ top vent windows with honeycomb transparent insulation (TIM)
̇ natural ventilation (top and bottom parts of facade).
<Figure 5: The prototype facade element in front of the test room>
Measurements were performed with the facade exposed to the outdoor environment in order to identify the specific transmission heat loss (U-value) and solar transmittance (g-value). A movable cold box was also used in front of the façade to obtain directly the "dark" U-value. Additional measurements were carried out with the ventilation openings in the bottom and top of the facade open to provide natural ventilation of the room, in particular for passive cooling in summer. These tests were used to quantify the solar gains entering the test room and the combined heat loss by transmission plus ventilation, in order to derive the heat removal potential of the ventilation openings to prevent summer overheating. The results were compared with the predicted passive cooling potential.
Two test elements were fabricated, each representing a specific part of the facade. The size of the test elements was designed to fit in the test room aperture. The test results were later scaled to the full scale facade.
After correction for scale, the thermal transmittance (U-value) of the total façade was found to be 0.9 W/m2K, and the solar energy transmittance (g-value) was 0.21. Regarding the natural ventilation with open ventilators, the air exchange rate (based on average room temperature) was derived: in the case of low heat gains it was 0 to 2 air changes per hour and in the case of high heat gains it was 5 to12 air changes per hour, depending on wind speed. This was in agreement with the requirements. Other results obtained from the experiments were the detection of faults in the mechanical operation of the opening and closing of the vents, an appreciation of the visual appearance of the TIM and the need for extra attention paid to thermal bridges at the junctions. These observations led to improvement in the design before application to the building and thus prevented costly modifications afterwards.
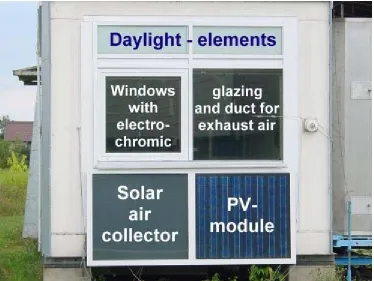
5. Synergy Façade
Two special windows are located in the middle of the façade, composed of heat protection glazing with electrochromic properties at the exterior side and a third pane at the interior side. The electrochromic glazing allows the adjustment of the transparency according to the required light levels. The double glazing and the third pane form a flow channel through which the room air is exhausted. Two daylight elements above the windows redirect the light into the depth of the room. Below the windows a glazed solar air collector and a PV module are mounted. The facade system is of modular construction and can be varied to meet the particular requirements.In winter mode, the cold external air at first flows through an air gap behind the PV module to preheat the air and cool the module. Afterwards the air flows through the air collector and is heated up further. If the air is still colder than the exhaust air from the room (e.g. if the solar radiation is too low) fresh and exhaust air are conducted through a heat exchanger. In the summer mode the fresh air flows into the room without preheating, and the exhaust air is used to cool the rear side of the PV module.
<Figure 6: Synergy Façade>
Because the facade can be run in several operational modes, long-term measurements over a period of several months were performed. Additional internal sensors were added to the standard instrumentation set to measure thermal comfort, light distribution and air distribution.
The data analysis allowed key performance data to be obtained, such as the UA-value of the façade, the performance of the electrochromic glazing at different levels of transparency, the ventilation heat loss, the performance of the heat exchanger, and the efficiency of the thermal air collector. By using a moveable cold box in front of the façade, a U-value of 1.4 W/m2K was obtained, indicative of the thermal performance at night when the ventilation system is switched off. The solar transmittance of the electrochromic glazing was found to vary between 0.12 and 0.44, from the lowest to highest transparent state respectively. The thermal air collector, including gains from the PV module, was estimated to have an efficiency of 50%.
The office building of the Solar Centre in Frankfurt/Oder was subsequently equipped with the modular facade system.
6. Air Supply Window
The principle of operation of an air supply window is for ventilation air to be drawn from the outside through the gap between the outer and inner glazings into a room, as shown in Figure 7. Solar gains pre-heat the ventilation air during the day, and at night some heat lost through the inner glazing may be recovered in the ventilation air. Two prototype air supply windows were tested at BRE Scotland, the first as part of the IMAGE Project [2] and the second in a UK EPSRC funded project in collaboration with the University of Westminster [11],[12].
<Figure 7: Schematic operation of air supply window>
offer some improvement over a similar triple glazed window with a conventional trickle ventilator, provided reasonably high ventilation rates are maintained (e.g. 1/3 to 1/2 ac/h for a room with volume 40 m3), and a significant improvement over double glazing. The air supply window also offers improved ventilation inlet temperatures, which may aid thermal comfort. Following the tests on this prototype, funding was obtained for a more extensive investigation of air supply windows and a second, configurable, prototype was constructed.
The basic design of the second prototype air supply window comprised a 1200 mm x 1200 mm timber frame with an inner sealed, air filled, double glazed unit (4mm glass - 12mm gap - 4mm glass) and an outer pane of a single sheet of 4mm float glass. The gap between the outer pane and the sealed unit could be adjusted to create 10, 20 and 30mm gaps. Ventilation air was drawn through the gap, entering through an inlet at the exterior of the lower part of the timber frame supporting the single glazing. The air was extracted into the test room at an outlet formed in the upper part of the frame above the double glazed unit.
The purpose of the test was to provide high quality data for model validation purposes (a CFD model), to determine the performance characteristics of the window for different gap widths and ventilation rates and to assess the use of passive stack ventilation as a means of driving ventilation through the air supply window. Detailed instrumentation of the window (thermocouples in a grid pattern on the surfaces of both the internal and external panes and in the inlet and outlet vents; a humidity sensor and a low velocity anemometer in the outlet vent) was installed in addition to the standard set of test cell instrumentation. In order to determine the performance of the window as a heat reclaim device (i.e. to determine its ability to "re-cycle" heat lost through the inner sealed double glazing of the window), the major part of the testing was carried out with a ventilated shading screen placed in front of the window to exclude solar radiation. This simplifies the determination of the main thermal characteristic of the window related to the thermal transmittance of the window. Additional tests were then performed without shading to determine the solar thermal efficiency. In order to determine the steady state thermal performance indicators, mechanical ventilation was used to draw air through the window and the air flow rate measured using a calibrated orifice plate. Flow rates up to 50 m3/h (1.3 ac/h) were investigated, with the test room maintained at a constant temperature. Passive stack ventilation (PSV) mode was investigated by installing a 100 mm diameter PSV system on the rear of the test cell. A 3m high vertical chimney was connected to a horizontal section of pipe, which traversed the service room at the rear of the test cell, and entered the test room just below ceiling height, as shown in Figure 8.
<Figure 8: Schematic diagram of test set up for passive stack ventilation>
Two gap widths, 10mm and 30mm, were examined. An anemometer was positioned externally in front of the window and air change rate measured using tracer gas (N2O).
Operating the window with passive stack ventilation showed that:
̇ coupling the air supply window with passive stack ventilation provides an adequate means of driving ventilation;
̇ satisfactory minimum levels of ventilation could be achieved with low wind speeds;
̇ the ventilation air provided by the window is significantly warmer than the external air during day time operation;
̇ there were significant reductions in the ventilation heat loss.
Several other experiments on ventilated windows have been carried out which include detailed modelling, for example with the Solvent window [13].
7. Conservatory
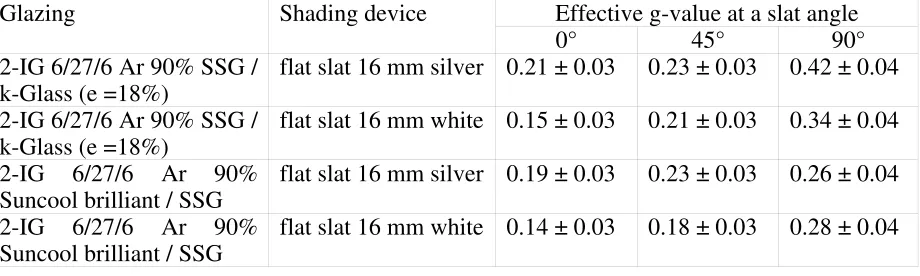
This case study demonstrates the use of the test cell infrastructure to assess an “add-on” component, [14], [15], [16]. Figure 9 shows the single-glazed conservatory that was tested: it has a floor area of 3190mm (width) x 1815mm (depth), a roof slope of 23˚, an east facing opening window and west facing opening door.
<Figure 9: Conservatory installed on south wall of test cell>
The purposes of the tests were to quantify the benefits of an additional sunspace in various modes of operation (buffer, conservatory-test room air interchange, solar ventilation pre-heat, varying floor thermal mass) and to provide data for model calibration prior to the use of modelling for the assessment of conservatory performance when linked to full-scale building.
The rationale of solar ventilation pre-heat (SVPH) operation is to utilise solar gains in a conservatory to raise the temperature of the required ventilation air, drawn through the conservatory from the outside into a building, above the external ambient air temperature, thus producing a reduction in the ventilation heat load. In the experiments, the ventilation requirement of the test cell was provided by mechanically drawing air through the conservatory into the test room of the cell via a duct located a few brick courses above the window in the timber frame wall mounted in the south aperture of the test cell. The test cell was maintained at a nominally constant 20°C, whilst providing continuous ventilation at a known steady rate. The ventilation rates selected were: 50 m3/h, 80 m3/h, and 260 m3/h, representing 0.2 ac/h, 0.3 ac/h, and 1.0 ac/h respectively for a reference house of 260 m3 volume. In addition to the standard instrumentation set, sensors included temperature sensors through the wall structure, a heat flux sensor embedded in the wall, air and globe temperatures in the conservatory, glass surface temperature sensors and a thermopile in the conservatory concrete floor slab. Data collection was at 1 minute intervals to capture the dynamic solar effects.
In buffer mode, when air was not drawn into the test cell, the conservatory was found to have a significant buffering effect on the timber-frame wall. The dynamic data was analysed with the package MRQT [17] to identify the UA and gA-values of the timber-frame wall and window. The UA-value was found to decrease from 8.5 W/K to 6.9 W/K (referred to the external temperature) with only a small effect on the gA-value. In SVPH mode, significant reductions in ventilation load were also obtained, with savings increasing as ventilation rate increases, as expected.
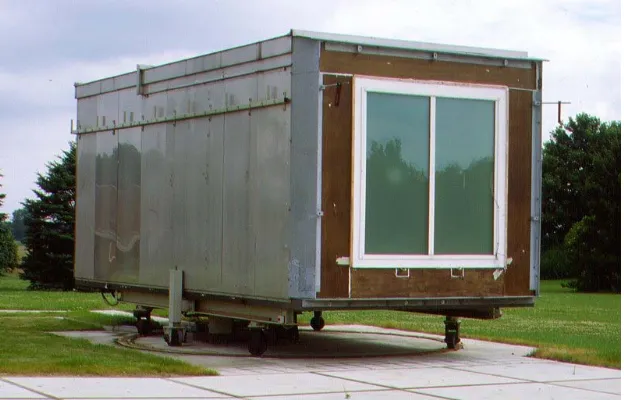
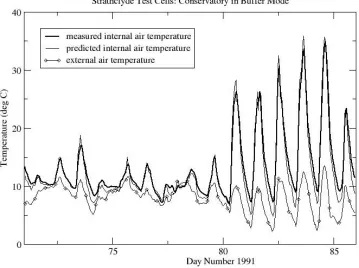
and conservatory were modelled with the ESP-r simulation program and comparisons made between the measurements and predictions, together with detailed uncertainty analyses (using a Monte Carlo analysis in the case of the simulation predictions). Figures 10 and 11 show the level of agreement obtained from a blind validation experiment, i.e. the model was not modified in any way according to results of the experiment. Figure 10 is for a 2 week period, Figure 11 is an expanded section.
<Figure 10: Comparison of measured and predicted conservatory air temperatures>
<Figure 11: Expanded portion of Figure 10 with uncertainty bands included. >
The main conclusions were as follows.
̇ Overall uncertainty bands are narrow, reflecting the good control of the experiment in terms of the simulation program input parameters.
̇ It is clear that there is a good level of agreement between measured and predicted data, perhaps surprisingly so considering that the performance of a single-glazed conservatory is likely to be very sensitive to the algorithms used for internal and external convection, for external longwave flux exchange and for solar processing. These are all areas where there is some uncertainty regarding which algorithms are the most appropriate.
̇ For most of the period, particularly in the first week when diffuse radiation conditions pertained, and during the daytime of the second week during high radiation levels, the measured and predicted uncertainty bands overlap. This gives confidence in the conservatory model and simulation program.
̇ The main area of disagreement is at night in the second week, when daytime solar radiation levels are high, and when the sky is probably clear at night. The cause of this discrepancy is considered to be connected with estimation of sky temperatures and the resulting longwave exchanges with the sky.
With the confidence gained from this comparison, it was then possible to model the conservatory when placed on a full-size house and investigate its performance under realistic operating conditions in different climates. The results are reported in [14]. Such studies are useful – the reduction in heating loads with SVPH operation, for example, obtained directly from the test cell data, give the maximum potential savings. Using simulation, a more realistic assessment can be made taking into account the match between the heating requirements of the house at different times of the day and year and the availability of the pre-heated air.
8. Shading Elements
This case study demonstrates a range of shading element and glazing combinations that can be tested [19], [20]. Figure 12 shows four such combinations of low emissivity argon-filled double glazing (2-IG) mounted in an insulated test frame in an outdoor test cell:
̇ Type 1: 2-IG with integrated flat Venetian blind, aperture 1.82 m2
̇ Type 2: 2-IG with exterior profile slats, aperture 1.45 m2
̇ Type 3: 2-IG with exterior fabric, aperture 1.65 m2
̇ Type 4: 2-IG with interior screen, aperture 1.784 m2
<Figure 12: Schematic of shading-glazing combinations measured in the outdoor test cell>
Switzerland. In particular, the aim was to quantify the “real” solar transmittance (g-value) of various solar shading positions, different slat angles and colours. The measurements were also useful for a comparison with numerical modelling.
For the evaluation of the solar transmittance, the thermal network identification tool LORD 2.0 [21] was used with a five node model for the test cell plus a shading/glazing combination (Figure 13). It should be noted that the identified g-value is an effective value related to the global vertical radiation, which includes the range of incidence angles of the direct and the distribution of the "diffuse" solar components during the exposure period. An identification example is shown in Figure 14.
<Figure 13: Thermal network model used for the identification of the thermal resistance and the total solar energy transmittance of the test façade. The cell parameters were previously
determined by calibration measurements.>
<Figure 14: Measured and calculated cooling power in the test cell at constant temperature with a 2-IG unit with integrated white Venetian blinds.>
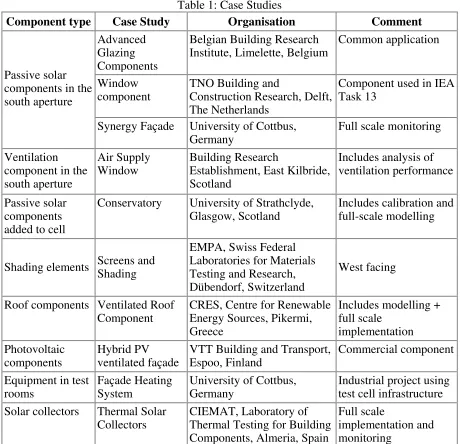
Some example results are shown in Table 2 for slat angles of 0° (fully closed), 45° and 90°. As expected, the g-value strongly depends on the slat angle. The results show that the effective g-value can be determined to a reasonable level of accuracy from these outdoor tests.
<Table 2: Results for Venetian blinds integrated in a 2-IG. The single security glass (SSG) was uncoated. >
9. Ventilated Roof
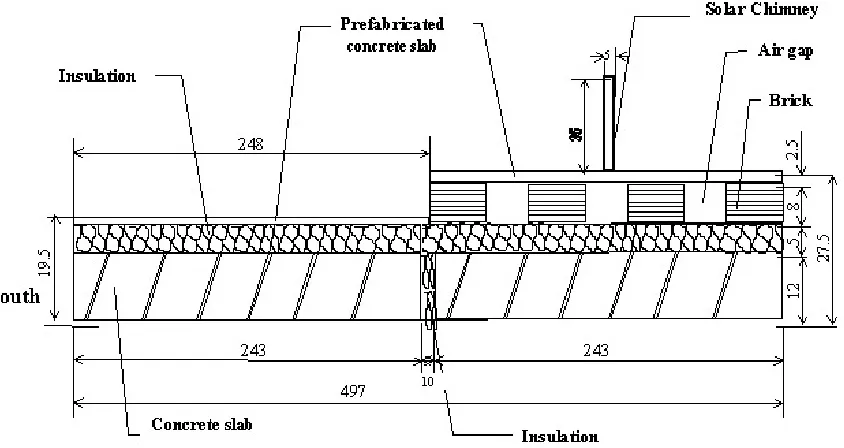
This case study demonstrates the testing of a ventilated roof component on an outdoor test cell, [22], [23]. Figure 15 is a schematic of the tested component. The total dimensions of the roof component were 2.715 m wide by 4.970 m long. It was divided into two equal areas: half of it was constructed as a conventional roof (according to conventional guidelines for a roof construction in Greece) and the other half was constructed as a ventilated roof component according to the design specifications of the ventilated prefabricated building components' manufacturer Prokelyfos S.A. The two components were separated with an insulation layer, in order to avoid heat flow between them, and tested under outdoor conditions.
<Figure 15: Cross-section of the roof components (not to scale). Dimensions in cm.>
The purpose of the test was to obtain information on the operational characteristics of the ventilated roof component, to investigate the effect of different parameters (ventilation air gap width and the use of a radiant barrier) on its performance and to determine its U-value.
The following conclusions were drawn from an analysis of temperature profiles
hour basis, the ventilated roof is much better than the typical roof during summer, and practically equivalent to it during winter.
̇ The radiant barrier enhances the performance of the ventilated roof significantly under summer day and winter night-time conditions, while the opposite is observed for summer night-time. The overall 24 hour performance of the radiant barrier is clearly favourable during summer and almost with similar performance during winter.
A thermal network identification tool (MRQT [17]) was applied. The overall thermal transmission coefficient (U-value) of the ventilated roof component (without radiant barrier) was found to be 0.44 W/m2K (compared to the conventional 0.5 W/m2K) and its thermal capacity was found to be 42 kJ/m2K. Modelling of the roof component was also undertaken as part of this project.
10 Hybrid PV Ventilated Façade
This case study demonstrates the use of the test cells for evaluating building integrated photovoltaic (PV) components [24]. The purpose of the test was the evaluation of the thermal performance of the ventilated PV facade. The thermal and electric performance characteristics of the first module prototype were determined experimentally by using a test wall assembly: in this first prototype installation, the wall behind the PV cladding (using Neste Advanced Power Systems components [25]) was a light-weight, insulated layer with low thermal capacity (Figure 16).
<Figure 16: Ventilated PV-panel wall at the PASLINK test cell at VTT test site in Espoo, Finland>
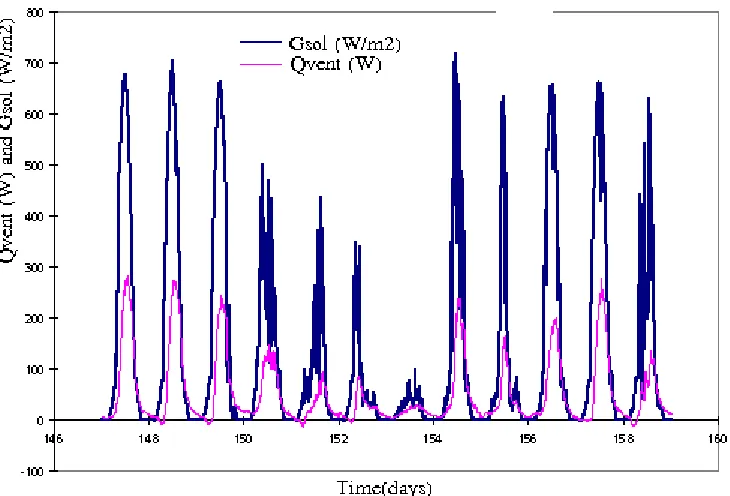
In this test assembly the ventilation flow in the air channel between the PV-cladding and wall was driven by a mechanical ventilation system. With this system the air flow rate could be controlled, maintained at an approximately constant level and measured. The PV façade consisted of 16 PV-panels that covered a test wall with an area about 2.4 m wide and 1.9 m high. Below and above this PV area there were air collection chambers that connected the wall with the mechanical ventilation system. The ventilation air space was connected at the top and bottom to the air collection chambers. These chambers had perforated plates along the air flow route in order to make the air flow uniform along the wall width and to stabilise the pressure field against strong changes caused by the wind. The bottom chamber was open to the outside air and the top chamber was connected to the ventilation system with three channels. Air flow rates during the tests were varied between 0-40 l/s. The temperature of the test cell was maintained at a constant set-point of 21°C using heating in on-off control mode. The electric performance of the system was determined by measuring the voltage and current before and after the inverter that connected the system to the mains electricity supply.
Figure 17 shows the solar radiation at the vertical surface (Gsol, W/m2) outside the test cell
and the quantity of the ventilation heat extracted through the gap (Qvent, W) in the period 27
May to 7 June, 1998. Air flow rate was 11.6 l/s in this period, and the average external temperature was 10.8°C. Thermal and solar transmittances were obtained by thermal network identification as described in previous case studies.
Other detailed tests on PV-integrated components are described in [26].
11. Façade Heating System
This case study describes how the test cell infrastructure can be used for testing equipment inside the test cell. In this case, the test component was part of an unconventional façade heating system, intended for an administration building in Berlin and produced by Frieß Metallbau AG. The façade consists of double glazing. The heater is a long special aluminium profile, as shown in Figure 18.
The purpose of the test was the determination of the heating power as a function of the temperature of the heating water. Another aim was to measure the U-value of the whole façade. Furthermore, temperatures at several positions along the profile were monitored.
<Figure 18: Schematic of heater installed in test cell in front of double glazing.>
During the whole test sequence a cold box was placed outside the façade to provide a constant external temperature of -14°C. The internal temperature was controlled to be 18°C. The flow rate of the heater was set to 80 l/h. The heating power of the heater was calculated to be 448 W and for the hoses, 8.85 W per metre length. Because it was assumed that the heater would influence the U-value (due to a changed film coefficient) the thermal identification analysis was performed separately for periods with and without use of the heater. The results were a U-value of 1.89 W/m2K with the heater on, and 1.62 W/m2K with the heater off. As expected, the use of the heater increases the U-value of the facade slightly. The described test was repeated several times with different flow rates and different inlet temperatures. The determined U-value and the measured correlation between inlet temperature, flow rate and heating power were used by the client to design the heating system for the building.
Although this test did not make use of the varying external climate of the test cell, it does demonstrate how such existing test facilities can be used for controlled experiments commonly undertaken inside laboratories.
12. Solar Collectors
Solar collectors have also been tested on the outdoor test cells. The component shown in Figure 19 is a commercial component: the flat solar collector 4000 E, manufactured by the Spanish company MADE. The surface area of this component is 2m2. This collector was used as a reference component within the framework of the ARCHINT project [27]. The overall objective of this project was to develop optimised solar collectors for building integration. One important issue of this optimisation is to consider improvements of the solar collectors with respect to their thermal behaviour when they are considered as part of the building enclosure. For this reason, it is important to know the thermal properties of this kind of enclosure. To obtain a good thermal characterisation (U-value and g-value) of this type of enclosure it is necessary to carry out tests of real size components with realistic working conditions that are achieved in real weather conditions.
<Figure 19: Solar collector mounted on outdoor test cell in Almeria, Spain.>
The following cases were studied:
̇ Case 1: Shaded component. A test was carried out in order to establish the U-value of
the collector as a vertical building enclosure, using a shading device placed in front of the south façade of the test cell and the pressurised (1.5 to 3 bar) water inside the primary loop.
̇ Case 2: Shaded component with heated water. A drawback with Case 1 is that the
assumed simplification means that the collector does not act as an active component. The second step involved the establishment of artificial conditions that simulate a normal active but simple operation in order to test the effect of power input. Tests were undertaken with the collector filled with pressurised (1.5 to 3 bar) circulating water, and with different water temperatures, requiring a power input into the water. However, the use of a constant (2000 W) power supply, instead of solar radiation, simplifies the analysis with regard to the presence of solar radiation.
̇ Case 3: Typical working conditions. This is considered the most representative of the
tested cases, with realistic working conditions established for the solar collector as an active component. In this case, water circulation in the primary loop was achieved by means of a pump controlled as a function of the collector inlet (Ti) and outlet (To)
temperatures and the tank temperature (TTank), in such a way that it allowed water flow
when [(Ti+To)/2 - TTank] > 6°C, with the water flow rate in this case 2.7 l/min. A 300
litre tank, which discharges and refrigerates the hot water produced by the collector in continuous mode by the thermo-siphon effect, was installed in the secondary loop. Pressure in the primary loop was kept between 1.5 and 3 bar.
Additional tests were carried out on the system under stagnant conditions and when the collector was empty, such as may occur during maintenance operations or system failure. Thermal identification techniques were employed using Lord 2.0 [21] to determine the U- and g-values for the different configurations of the collector. The results are given in Table 3.
<Table 3: The U- and g-values for the different configurations of the reference collector.>
The following conclusions were extracted from these results.
̇ The U-values and g-values obtained from the analysis are small and in the range of insulation materials.
̇ No clear dependence was found of the U-value on the working conditions.
̇ The g-value is always small and depends on the working conditions. It is a maximum when the active system does not evacuate heat, as in the case of an empty collector or stagnant conditions. This behaviour of the g-value suggests that it may be useful to include a range for g-value in the thermal performance indicators, such as maximum, typical and minimum values, as a function of the working conditions, for future tests of solar collectors when they are considered as an envelope component.
estimation of the heating and cooling loads needed to maintain a constant temperature of 22°C in this zone, and typical climatologic conditions for central Spain. Although the buildings were not real, they were considered suitable for highlighting the effects of solar collector integration and also for extracting general conclusions on collector performance. It was found that the annual heating energy consumption was reduced while cooling energy consumption in summer was increased when collectors were integrated in the building envelope.
13. Conclusions
A key conclusion is that well-constructed test cells with a comprehensive set of sensors and data acquisition system can be used for a multiplicity of test components. Given that the establishment of such test facilities is expensive and time consuming, such versatility is important. This paper has briefly described a range of test components that have been tested in test facilities within the PASLINK network of outdoor test centres in Europe. Although it has not been possible to give detailed experimental configurations and results in such a summary paper, the wide variety of tests and the uses of the data (e.g. thermal and lighting performance characterisation, and simulation program validation) have been demonstrated.
The availability of test cells established to a common set of standards in different climate zones allows components to be tested suitable for local climate conditions, as well as cross comparisons to ensure that the same performance characteristics can be determined (to a certain level of accuracy) irrespective of climate.
Testing in laboratory conditions gives lower uncertainties than in outdoor test cells, but outdoor tests have several advantages: an assessment of visual appearance, the detection of problems areas (e.g. thermal bridges), and an ability to test over full operational range in dynamic, realistic climatic conditions. Although this information could also be obtained from tests on real buildings, in practice it is more difficult to obtain the high levels of instrumentation and control necessary for accurate determination of performance.
When quantifying the thermal performance or providing data for comparisons with simulation predictions, it is important to undertake error analysis – most of the studies reported here included such analysis with estimates of the uncertainty in the derived performance indicators.
The case studies demonstrate the benefit of an overall approach to the evaluation of building components. This approach may include the following elements: laboratory experiments to determine, for example, material properties; outdoor test cell experiments with high levels of control and instrumentation to obtain high quality datasets; the use of dynamic thermal identification techniques to determine key performance indicators; model calibration to confirm that the simulation model of the tested component can accurately predict its performance; and the simulation of full size buildings with and without the building component of interest in a range of climates, to determine its performance taking into account interactions with the building operation; and, possible, real building monitoring after installation.
period than for laboratory tests, although more information on dynamic performance is obtained.
Acknowledgments
The authors gratefully acknowledge partners in the PASLINK project, in particular Dick van Dijk, Olaf Gutschker, Maria Jose Jimenez, Paul Baker, Ismo Heimonen, Gilles Flamant, Hans Simmler and Andreas Androutsopoulos who contributed information on the case studies reported in this paper.
References
[1] www.paslink.org, viewed in August 2006.
[2] Cohen R and Bates J (eds), IMAGE: Implementation of advanced glazing in Europe - performance optimisation of advanced glazing systems in practical applications, Halcrow Gilbert Associates, Final report, EC DGXII JOULE Project JOE3-CT95-0007, April 1998. [3] Clarke J A, Janak M and Ruyssevelt P, Assessing the overall performance of advanced glazing systems, Solar Energy, Vol 63, No 4, pp231-41, 1998.
[4] Strachan P A, Simulation Support for Performance Assessment of Building Components, Building and Environment, this issue.
[5] ESRU, ESP-r program, http://www.esru.strath.ac.uk, 2006.
[6] Ward G and Shakespeare R, Rendering with RADIANCE: The Art and Science of Lighting Visualization, Morgan Kaufmann Publishers, 1998.
[7] IEA Solar Heating and Cooling Task 13 Final Report: Component and System Testing, ed Saxhof B, ISBN 87-984610-3-6, 1995.
[8] Berger U, Innovative Solarfassaden für Büro- und Gewerbebauten, Anwenderseminar der Fördergesellschaft Erneuerbare Energie e.V. "Innovationen bei solarthermischen Anlagen", Glaubitz, June 2001.
[9] Häusler T and Berger U, Lichttechnische Untersuchungen und Bestimmung von Komfortparametern an einer Synergiefassade, Achtes Symposium "Innovative Lichttechnik in Gebäuden", Kloster Banz, Jan 2002.
[10] Häusler T and Berger U, Determination of thermal comfort and amount of daylight, 10th International Conference on Air Conditioning, Air Protection and District Heating, Szklarska Poreba, June 2002.
[11] Baker P H and McEvoy M, An investigation into the use of an air supply window as a heat reclaim device. Building Services Engineering Research and Technology, Vol. 20, No. 3, pp 105-112, 1999.
[12] Baker P H and McEvoy M, Test cell analysis of the use of a supply air window as a passive solar component. Solar Energy, Vol. 69, No. 2, pp 113-130, 2000.
[13] Leal V and Maldonado E, The role of the PASLINK test cell in the modelling and integrated simulation of an innovative window, Building and Environment, this issue.
[14] Jensen S Ø (ed), Validation of Building Energy Simulation Programs, Parts I and II, Research Report PASSYS Subgroup Model Validation and Development, CEC, Brussels, EUR 15115 EN, 1993.
[15] Baker P, Guy A and Strachan P, Performance assessment of a conservatory in ventilation pre-heat mode, Proc. North Sun '92, Trondheim, Norway, pp132-137, June 1992.
[16] Strachan P and Baker P, Comparison of Measured and Predicted Performance of a Conservatory, Proc. North Sun '92, Trondheim, Norway, pp345-350, June 1992.
[17] van der Linden G and van Dijk D, MRQT User Guide, Workshop on Application of System Identification in Energy Savings in Buildings, CEC Joint Research Centre, EUR 15566 EN, 1993.
[18] http://www.insightful.com/
[20] Haug I, Beck A and Fricke J, Optische und energetische Charakterisierung von Fenster-/Jalousie-Systemen, Bauphysik 22, Heft 1, 2000.
[21] Gutschker O, Parameter Identification with the Software Package LORD, Building and Environment, this issue.
[22] AIRinSTRUCT: Integration of Advanced Ventilated Building Components and Structures for Reduction of Energy Consumption in Buildings, Final Report - Part I: Detailed Partners Final Technical Reports, EC JOULE-CRAFT project, September 2000.
[23] AIRinSTRUCT: Integration of Advanced Ventilated Building Components and Structures for Reduction of Energy Consumption in Buildings, Final Report - Part IIa and IIb: Detailed Technical Reports, EC JOULE-CRAFT project, September 2000.
[24] Heimonen I, Analysis of thermal measurements on Neste NAPS component, VTT Building Technology for PV-HYBRID-PAS, Contract JOR3-CT96-0092, Working report, 15 pages, 1998.
[25] http://www.napssystems.com
[26] Bloem J J, Study of a Hybrid PV Integrated Building Application in a Well Controlled Test Environment, Building and Environment, this issue.
[27] Heras M R, Ferrer J A, Granados H, Zarzalejo L, San Isidro M J, Jimenez M J, Guzman J, Travier X, Escribano J C, Martin E, Brachthauser G and Lavandeira J C, ARCHINT Contract JOR3-CT98-7048, Publishable Final Report, 2001.
Table 1: Case Studies
Component type Case Study Organisation Comment
Advanced Glazing Components
Belgian Building Research Institute, Limelette, Belgium
Common application
Window component
TNO Building and
Construction Research, Delft, The Netherlands
Component used in IEA Task 13
Passive solar components in the south aperture
Synergy Façade University of Cottbus, Germany
Full scale monitoring
Ventilation component in the south aperture
Air Supply Window
Building Research
Establishment, East Kilbride, Scotland
Includes analysis of ventilation performance
Passive solar components added to cell
Conservatory University of Strathclyde, Glasgow, Scotland
Includes calibration and full-scale modelling
Shading elements Screens and Shading
EMPA, Swiss Federal Laboratories for Materials Testing and Research, Dübendorf, Switzerland
West facing
Roof components Ventilated Roof Component
CRES, Centre for Renewable Energy Sources, Pikermi, Greece
Includes modelling + full scale implementation Photovoltaic components Hybrid PV ventilated façade
VTT Building and Transport, Espoo, Finland
Commercial component
Equipment in test rooms
Façade Heating System
University of Cottbus, Germany
Industrial project using test cell infrastructure Solar collectors Thermal Solar
Collectors
CIEMAT, Laboratory of Thermal Testing for Building Components, Almeria, Spain
Full scale
Table 2: Results for Venetian blinds integrated in a 2-IG. The single security glass (SSG) was uncoated.
Effective g-value at a slat angle
Glazing Shading device
0° 45° 90° 2-IG 6/27/6 Ar 90% SSG /
k-Glass (e =18%)
flat slat 16 mm silver 0.21 ± 0.03 0.23 ± 0.03 0.42 ± 0.04
2-IG 6/27/6 Ar 90% SSG / k-Glass (e =18%)
flat slat 16 mm white 0.15 ± 0.03 0.21 ± 0.03 0.34 ± 0.04
2-IG 6/27/6 Ar 90% Suncool brilliant / SSG
flat slat 16 mm silver 0.19 ± 0.03 0.23 ± 0.03 0.26 ± 0.04
2-IG 6/27/6 Ar 90% Suncool brilliant / SSG
flat slat 16 mm white 0.14 ± 0.03 0.18 ± 0.03 0.28 ± 0.04
Table 3: The U- and g-values for the different configurations of the reference collector.
Case U (W/m2K) g(-)
Shaded component 0.602 ± 0.2% -
Shaded component with heated water 0.482 ± 1.0% - Typical working conditions 0.633 ± 0.3% 0.040 ± 0.5%
Stagnancy 0.675 ± 0.3% 0.119 ± 0.3%
[image:17.595.95.512.299.392.2]Figure 1: Advanced glazing component mounted on PASLINK test cell
[image:18.595.143.455.84.284.2]̇
Figure 3: Measured central U-values for multi-glazed systems (MGS)
[image:19.595.88.524.403.696.2]̇
Figure 5: The prototype facade element in front of the test room
[image:20.595.113.487.428.709.2]Figure 7: Schematic operation of air supply window
Figure 11: Expanded portion of Figure 10 with uncertainty bands included.
[image:24.595.83.521.455.612.2]
Figure 13: Thermal network model used for the identification of the thermal resistance and the total solar energy transmittance of the test façade. The cell parameters were previously
determined by calibration measurements.
[image:25.595.68.522.311.487.2]Figure 15: Cross-section of the roof components (not to scale). Dimensions in cm.
[image:26.595.187.414.372.538.2]Figure 17: Vertical solar radiation and heat extraction rate.