Energy Procedia 53 ( 2014 ) 86 – 94
ScienceDirect
1876-6102 © 2014 Elsevier Ltd. This is an open access article under the CC BY-NC-ND license (http://creativecommons.org/licenses/by-nc-nd/3.0/).
Selection and peer-review under responsibility of SINTEF Energi AS doi: 10.1016/j.egypro.2014.07.217
EERA DeepWind’2014, 11th Deep Sea Offshore Wind R&D Conference
Dynamic Series Compensation for the Reinforcement of Network
Connections with High Wind Penetration
Juan C. Nambo Martinez
a, Kamila Nieradzinska
a, Olimpo Anaya-Lara
aa,b,c Department of Electronic and Electrical Engineering, Institute of Energy and Enviroment, University of Strathclyde, Royal College Building, 204, George Street, G1 1XW Glasgow,UK, Phone +44(0)141 552 44 00
Abstract
This study explores the use of TCSC technologies to improve the interaction between AC lines and VSC-HVDC links that form a parallel circuit. The purpose of this connection is the reinforcement of transmission paths that will facilitate the integration of new wind generation, such as the Dogger Bank, to the UK mainland electrical network.
© 2014 The Authors. Published by Elsevier Ltd.
Selection and peer-review under responsibility of SINTEF Energi AS.
Keywords: HVDC, TCSC, Series Compensation, Power Oscillations, Network Reinforcement
1. Introduction
The targets set by the EU leaders in March 2007, known as the “20-20-20” targets, have the following objectives: first, to reduce 20% of EU greenhouse gas emissions compared to the levels from 1990, second, to raise the share of EU energy consumption produced by renewable resources to 20%, and third, to improve the EU's energy efficiency by 20% [1].
To this end, the UK Government issued plans to build around 40GW of renewable power generation by 2050, most of which derives from new offshore wind farms to be constructed around the British mainland. The largest of the wind farms developments that forms part of this project, the so-called Dogger Bank, may provide an impressive amount of up to 9 GW of power generation [2]. In order to connect such amounts of power to the mainland UK network, the reinforcement of existent AC transmission lines as much as the development of new transmission paths is a vital requirement.
In current times VSC-HVDC is the preferred technology to build new transmission paths in order to deliver high amounts of power generation over long distances, because of the many benefits that this technology can provide to © 2014 Elsevier Ltd. This is an open access article under the CC BY-NC-ND license
(http://creativecommons.org/licenses/by-nc-nd/3.0/).
the power system. However, VSC-HVDC technologies normally are not used in parallel circuits with AC lines because this configuration is susceptible to cause power oscillations in the system.
A way around this problematic issue are Thyristor Controlled Series Capacitors (TCSC), which are series compensation devices capable of providing variable reactive series compensation, a feature that can be used to increase the capacity of AC transmission lines, to improve system stability, and to contribute to the reduction of power oscillations, among many other uses.
Therefore, this study explores the use of TCSC technologies to improve the interaction between AC lines and VSC-HVDC links that form a parallel circuit. Both VSC-HVDC and TCSC technologies are used for the upgrade of sectors in the power system. VSC-HVDC technologies are used in all those cases in which the construction of new transmission paths for the transport of new power generation over long distances is necessary; while TCSC technologies are used in those cases where an increase in the capabilities of existent AC transmission lines is desired. It should be highlighted that TCSC devices can provide damping of power oscillations and for this reason considerably improve the interaction between AC and DC circuits placed into a parallel connection.
2. Interaction AC-DC parallel circuits
A parallel AC-DC circuit can provide several benefits to an electrical network, such as:
x Upgrade of the power capabilities of the transmission path
x Regulation of the AC voltage profile at both ends of the system to which the HVDC link is connected (PCCs)
x Injection of reactive power at both PCCs
However, all the features mentioned above are constrained by the power oscillations of subsynchronous frequency in the AC circuit that can be produced by the interaction of the control of the HVDC converters with parallel AC lines or by a rescheduling of power caused by a sudden or high change in the power interchanged between the HVDC link and the AC line.
In this context, Thyristor Controlled Series Capacitors (TCSC) are devices that can provide numerous benefits to the AC transmission lines, such as [3]:
x Upgrade of the power transmission capabilities of the path
x Improvement of the system stability
x Reduction of system losses
x Improvement of voltage profile at both ends of the line
x Optimization of power flow between parallel lines
x Dynamic power flow control
x Damping of power oscillations
x Mitigation of subsynchronous resonance
Although, all the features mentioned before are desirable in a transmission system, the use of TCSC devices does not mean that all of them will be reflected in the circuit. It is for this reason that the study presented in this document focuses in the upgrade of power transmission capabilities for which both devices can be employed. However, it is important to note that the damping of power oscillations provided by a TCSC is the dominant feature that allows for an improved interaction between parallel AC-DC circuits. By consequence, this feature lies at the heart of this study.
Five circuits are employed to carry out the study presented in this work; these circuits are:
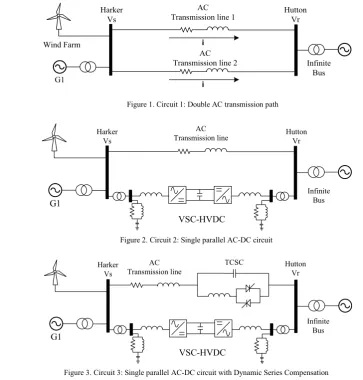
x Circuit 1. Double AC transmission circuit (Figure 1)
x Circuit 2. Single AC transmission circuit with a parallel HVDC link (Figure 2)
x Circuit 3. Single AC transmission circuit with dynamic series compensation (TCSC) and a parallel HVDC link
(Figure 3)
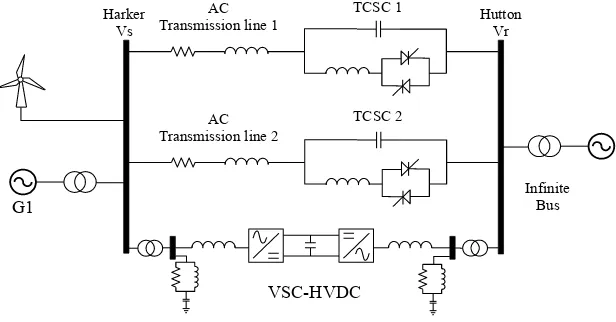
x Circuit 5. Double AC transmission circuit with dynamic series compensation (TCSC) and a parallel HVDC link (Figure 5)
[image:3.544.70.434.91.472.2]
Figure 1. Circuit 1: Double AC transmission path
[image:3.544.108.425.482.635.2]Figure 2. Circuit 2: Single parallel AC-DC circuit
Figure 3. Circuit 3: Single parallel AC-DC circuit with Dynamic Series Compensation
Figure 4. Circuit 4: Double parallel AC-DC circuit
G1
AC Transmission line 1
Wind Farm
Infinite Bus Harker
Vs
Hutton Vr
i
AC Transmission line 2
i
G1
VSC-HVDC AC
Transmission line
TCSC
Infinite Bus Hutton
Vr Harker
Vs G1
VSC-HVDC AC Transmission line
Infinite Bus Harker
Vs
Hutton Vr
G1 Wind Farm
VSC-HVDC AC Transmission line 2
AC Transmission line 1
Infinite Bus Harker
Vs
Figure 5. Circuit 5: Double parallel AC-DC circuit with Dynamic Series Compensation
Each of these five circuits was simulated in Simulink/Matlab and the results of these simulations are presented hereafter so that a comparison of the improvements obtained from each respective configuration can be facilitated.
Circuit 1 is based on the parameters of the double transmission circuit between Harker and Hutton, which forms part of the Scotland-England Interconnector. Circuit 1 is used as a reference for the remaining circuits, because it allows observing the benefits obtained from the incorporation of HVDC and TCSC devices.
For the construction of Circuits 2 and 3, one of the transmission lines of Circuit 1 is replaced by a HVDC link. The difference between these circuits results from the inclusion of dynamic series compensation in the remaining AC line in Circuit 3.
Circuit 4 and 5 consist of the double transmission path from Circuit 1 with the inclusion of a HVDC link in parallel connection to the AC lines, where Circuit 5 also includes dynamic series compensation in both AC transmission lines.
3. Description of the components used in each circuit
All the circuits presented are simple 2-node models. Each model has a synchronous generator connected at the sending end and an infinite bus acting as a load connected at the receiving end.
The synchronous generator used is of the steam turbine type and works at 20kV and 50Hz. It also has a 20kV/400kV, ∆/Yg transformer.
The AC transmission circuit used in this study is based on the transmission path between Harker and Hutton, which is part of the Scotland-England interconnector, which, in turn, forms part of the GB electrical system. This Harker-Hutton transmission line is a double 400kV AC circuit, with a length of 89km, where each conductor has a total impedance of ൌ ʹǤʹ ʹͶǤͻͺ (not considering the line's susceptance) and transports 1.6GW (800MW each conductor) [4].
The HVDC is based on Voltage Source Converter technologies (VSC). It has a DC bipolar transmission line of 400kV and it is able to transport up to 1.2GW of active power. The HVDC used for this study has the capability of controlling the bidirectional injection of active and reactive power and it also has the alternative of regulating the level of voltage at the Point of Common Coupling (PCC) of both converters.
The TCSCs use the Enhanced Constant Power Control (ECPC), which is regarded as one of the best controls for damping power oscillations [5]. The TCSC can provide a variable reactive series compensation to the transmission lines between the ranges of 15% to 45%. This range of operation has been chosen following the plans stated by National Grid that stipulate that the transmission path Harker-Hutton is already working close to its thermal limits. Therefore, there exists the plan to install 33% of reactive series compensation. This amount of series compensation
G1
VSC-HVDC AC
Transmission line 2
TCSC 2 AC
Transmission line 1
TCSC 1
Infinite Bus Harker
Vs
allows for an increase of 50% of the transmittable power capacity of the transmission lines, while allowing them to remain under their thermal limits[1].
Following this recommendation, the TCSCs used in this study include a control that, under steady state operation, provides a constant reactive compensation of 33% and during transitory conditions can provide a variable compensation between the range 15% to 45%.
4. Circuit 1. Double AC transmission Circuit: The Harker-Hutton GB transmission path
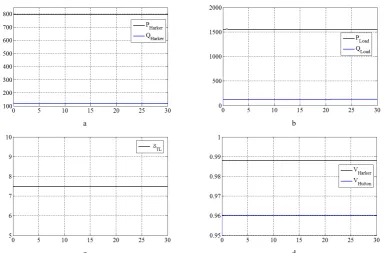
The simulation of Circuit 1, figure 1, provides the parameters at which the transmission path between Harker-Hutton operates. These parameters represent a point of comparison for the simulation of the rest of the circuits of this study. The signals obtained from the simulation of Circuit 1 are shown in figure 6.
The power injected to each transmission line at Harker is S=800+j120 MVA; this can be observed in figure 6a. The power delivered by both lines at Hutton is 1550+j155 MVA, figure 6b; this amount of power is equal to the power injected at the sending end (Harker) minus the power absorbed by the transmission lines. The power angle generated between the Harker-Hutton transmission path (Ɂൌ ǤͶͻͲ) can be obtained from figure 6c; this angle is calculated instantaneously in Simulink/Matlab through the power angle equation:
¸¸
¹
·
¨¨
©
§
r s
TL
V
V
PX
1
sin
G
(1)Finally, figure 6d shows the voltage profiles at the sending and receiving ends.
a b
[image:5.544.79.466.321.574.2]c d
5. Single Parallel AC-DC Circuits
Since the objective of this study is to provide an upgrade in the power capabilities of the transmission circuit Harker-Hutton, the power injected at the sending end has been set to ൌ ʹǤͶ for Circuits 2 and 3 (figure 2 and 3 respectively); this represents an increase of 50% with respect to the power transmitted in Circuit 1. Thus, under normal conditions it is desired that the HVDC link transmits ͳǤʹ and that the AC line transmits the other 1.2GW.
At the beginning of the simulations of Circuits 2 and 3, both HVDC and TCSC are out of operation. During the simulation time both circuits are subjected to two parameter changes. These changes have the purpose to show the performance of the system under different HVDC and TCSC operation conditions. These changes are:
x Both HVDC and TCSC start operating at ൌ ʹ
x The HVDC link is taken out of operation at ൌ ͳͷ
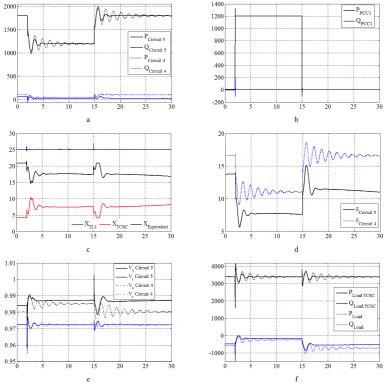
The simulations of both Circuit 2 and 3 are shown in a comparative manner in figure 7, where the signals obtained from the simulation of Circuit 2 are displayed by the dotted lines while, the signals from Circuit 3 are displayed as full lines. The explanation of the events that occurred during the simulation is divided in three periods of time. These periods of time are Ͳ ൏ ൏ ʹ, ʹ ൏ ൏ ͳͷ, ͳͷ ൏ ൏ ͵Ͳ.
5.1.Period of time
During this period of time, neither the HVDC link nor the TCSC are operating, as a consequence all the power flows through the AC transmission lines, as shown in figures 7a and 7b. However, since TCSC devices have an internal Fixed Capacitor, they provide a minimum compensation capacitance that, in this case, is equivalent to 15% of the impedance of the transmission lines. Figure 7c shows the impedances of the transmission line (ܺܶܮ), the TCSC impedance ሺܺܶܥܵܥሻ, and the equivalent impedance ሺܺ݁ݍሻ, where the last is obtained with the following
equation
TCSC TL
eq
X
T
X
(2)The reduction in ܺ݁ݍ caused by action of the TCSC produces some enhancements in the signals obtained from
Circuit 3 with respect to Circuit 2, such as: the reactive power demanded at the sending end and the power angle between the terminals of the AC line are reduced (figures 7a and 7d respectively), while the voltage profile at the sending end is increased (for this simulation the voltage at the receiving end remains the same as the one from the uncompensated AC line from Circuit 2 because the infinite bus maintains it at a constant level), as shown in figure 7e.
5.2.Period of time
At time t=2s, both HVDC and TCSC start to operate. The HVDC immediately demands the 1.2GW of active power that it is set to transport from the sending to the receiving end (figure 7b). This effect produces a rescheduling in the power that leads to power oscillations with a frequency close to 0.6Hz at the AC side of the Circuit.
As can be observed from the signals obtained from Circuit 2 (Figure 7a, dotted lines), the power oscillations last for about 11 seconds, while the signals obtained from Circuit 3 (Figure 7a, full lines) show that the TCSC’s damping action is noticeable from the first Power Swing onwards and, it brings the system to a steady state after only 4 seconds.
The figures above demonstrate the contribution of a TCSC device to the mitigation of power oscillations. However, the damping effect is not the unique contribution of the TCSC to the system. Indeed, several additional effects can be observed once the system reaches the steady state at t=6s. The TCSC increases its capacitive
reactance from 4.5Ω to 8.3Ω, which means 33% of reactive series compensation (figure 7c), causing a reduction
s
t
s
2
0
d
s
t
s
15
a b
c d
[image:7.544.83.462.68.444.2]e f
Figure 7. Comparative simulation signals of Circuits 2 and 3; a) P and Q sending ends, b) P and Q at the PCC1s, c) ܺܶܮǡ ܺܶܥܵܥǡ ܺ݁ݍݑ݅ݒ݈ܽ݁݊ݐ, d)
Transmission line power angles, e) Voltage at sending and receiving ends, f) P and Q at the loads.
in the reactive power demanded at the sending and receiving ends (figures 7a and 7f respectively), a slight rise in the voltage profile of the sending end (figure 7e), and a reduction in the power angle of the transmission line from
δTL=11.50 to δTL=80 (figure 7d).
These parameters allow the system to work under similar conditions as the ones from Circuit 1, where each transmission line only transports 800MW, indicating that the TCSC allows for an increase in the power capabilities of 50%.
5.3.Period of time
At time t=15s, the HVDC is taken out of operation but the TCSC remains operating. The separation of the HVDC link causes all the power to flow through the AC line once again (figure 7b), and this leads to the generation of new power oscillations in the system. It can be observed in figure 7a that in Circuit 2 the power oscillations last for about 12 seconds, while for Circuit 3 these are damped within 4 seconds through the action of the TCSC.
Since the TCSC is set to continue providing 33% of compensation, it causes certain improvements in the system
s
t
s
30
with respect to the initial period of time during which the TCSC does not operate (Ͳ ൏ ʹݏ), such as, a reduction in the reactive power required at the sending end (figure 7a), a slight increase in the voltage profile at the sending end (figure 7e), and the most noticeable one; a reduction of δTL from 180 to 160.
6. Double Parallel AC-DC Circuits
For the simulation of Circuits 4 and 5 (figure 4 and 5 respectively), the active power injected at the sending end has been incremented to 3.6GW, which represents an increase of 2GW or 125% from the original Harker-Hutton AC Circuit 1. Thus, under normal conditions the HVDC link is set to transport 1.2GW and the remaining 2.4GW are divided between both AC lines.
a b
c d
[image:8.544.82.470.193.578.2]e f
Figure 8. Comparative simulation signals from Circuits 4 and 5 ; a) P and Q sending ends, b) P and Q at the PCC1s, c) ܺܶܮǡ ܺܶܥܵܥǡ ܺ݁ݍݑ݅ݒ݈ܽ݁݊ݐ,
d) Transmission line power angles, e) Voltage at sending and receiving ends, f) P and Q at the loads.
The overall power transmitted increases from 1.6GW in Circuit 1 to 3.6GW in Circuit 4 and 5, from which 3.4GW are delivered to the load (figure 8f).
x For the case in which both HVDC and TCSC are in operation, the voltage profile and power angle of the AC
lines of Circuit 5 (figures 8d and 8e, respectively) reach values similar to those from Circuit 1 (figures 8c and 8d, respectively).
x For the case in which the HVDC is out of operation but the TCSCs remain operating, the AC transmission lines share the amount of power that, otherwise, should be transported by the HVDC. This means that each AC line transports 1.8GW (figure 8a) instead of 2.4GW in Circuits 2 and 3 and the power angle remains at δTL= 120
(figure 8d), whereas the one from Circuits 2 and 3 increases to δTL= 160 (figure5d).
Conclusions
The analysis presented in this document shows the potential of using HVDCs connected in parallel to AC lines compensated with TCSCs, which allows for an upgrade of transmission paths. Furthermore, it shows the TCSC's capabilities of damping power oscillations, which represents a highly desirable feature against transient events.
The TCSC devices of this study allow for series compensation on the order of 33%, which represents an increase of 50% of transmittable power, while maintaining the power angle of the transmission line, the voltage profile, and the reactive power demand close to the values of the same line without series compensation.
It is important to notice that the maximum ratio of series compensation recommended is 75%, which allows for an increase of 400% of the transmittable power (not considering the thermal limits of the conductors).
References
[1] European Commission, Climate Action, http://ec.europa.eu/clima/policies/package/index_en.htm.
[2] ENSG. ENSG Our Electricity Transmission Network: A Vision for 2020. Full Report. ENSGR 2009-026, July 2009.
[3] Meikandasivam, S. Kumar, Rajesh. Behavioral Study of TCSC Device- A Matlab/Simulink Implementation. Wold of Science. Engineering and Technology 45 (2008)
[4] National Grid. National Electricity Transmission System Sven Year Statement, May 2010.
[5] R. Mohan Mathur, Rajiv K. Varma.Thyristor-Based FACTS Controllers for Electrical Transmission Systems. IEEE Press Series on Power Engineering. Whiley-Interscience. Piscataway, NJ. 2002
[6] R. Kundur. Power system stability and control. MacGraw-Hill Inc. New York, 1994.
[7] Zhou X, Lian J. Overview of Control Schemes for TCST to Enhance the Stability of Power Systems. IEE Proceedings-Generation. Transmission and Distribution, 1999. 146(2): 125-130.
[8] Ding Yu-jiang, Tang Hai-yan, QU Gou-quan, Zhang Tao. A survey on Design of TCSC Controller. Power System Technology, 1000-3673.0.2006-SI-041.
[9] XU Zheng. Dynamic analysis of AC/DC power systems. Beijing: China Machine Press, 2004.
[10] Amirnaser Yazdani, Reza Iravani. Voltage-Source Converters in Power Systems: Modelling, Control and Applications. IEEE Press. John Wiley and Songs, Inc., Publication. New Jersey, 2010