ContentslistsavailableatScienceDirect
International
Journal
of
Information
Management
j o u r n a l ho me p ag e:w w w . e l s e v i e r . c o m / lo c a t e / i j i n f o m g t
Using
visual
representations
for
the
searching
and
browsing
of
large,
complex,
multimedia
data
sets
H.J.
Grierson
∗,
J.R.
Corney,
G.D.
Hatcher
UniversityofStrathclyde,DesignManufacture&EngineeringManagement,75MontroseStreet,GlasgowG11XJ,UnitedKingdom
a
r
t
i
c
l
e
i
n
f
o
Articlehistory:
Keywords:
Searching Browsing
Informationvisualization Informationmanagement Zoomable
a
b
s
t
r
a
c
t
Recentyearshaveseenahugeincreaseinthedigitaldatageneratedbycompanies,projectsand indi-viduals.Thishasledtosignificantchallengesinvisualizingandusinglarge,diversecollectionsofdigital information.Indeedthespeedandaccuracywithwhichtheselargedatasetscanbeeffectivelymined forinformationthatisrelevantandvaluablecanhaveasignificanteffectoncompanyperformance.This researchinvestigatesthefeasibilityofusingvisualrepresentationsforthesearchingandbrowsingof large,complex,multimediadatasets.ThispaperintroducestheSIZL(SearchingforInformationinaZoom Landscape)system,whichwasdevelopedtoenabletheauthorstoeffectivelytestwhethera2.5D graphi-calrepresentationofamultimediadatalandscapeproducesquantifiableimprovementsinauser’sability toassessitscontents.Theusabilityofthisvisualizationsystemwasanalyzedusingexperimentsanda combinationofquantitativeandqualitativedatacollectionmethods.Thepaperpresentstheseresults anddiscussespotentialindustrialapplicationsaswellasfutureworkthatwillimprovetheSIZLdata visualizationmethod.
©2015TheAuthors.PublishedbyElsevierLtd.ThisisanopenaccessarticleundertheCCBYlicense (http://creativecommons.org/licenses/by/4.0/).
1. Introduction
Thequantityofdatageneratedandstoredgloballyis increas-ingat a phenomenal rate.In 2013it was saidthat 90% of the world’sdataweregeneratedinthepasttwoyears(Dragland,2013). Thedigitizationofbusiness,globalindustrypartnershipsandthe increasingpresenceoftheInternetinourliveshaveallcontributed todatasetssolargethattheyhavebecomehighlychallengingto manageeffectively. Companiesthat operatefroma digital plat-form,forexampleinternetretailersandsocialnetworks,facegreat challengesincapturing,storing,analyzingandprotectingthehuge volumesofdatatheirbusinessesgenerate.Even‘traditional’ indus-triessuchasengineeringandconstructionarefacingchallenges. Large,global,collaborativeprojectsalsogeneratehugevolumesof data,fromdesigndocumentationtosupplychainmanagementto communicationrecords.Thespeedandaccuracyatwhichthese largedatasets can be effectively mined for information that is relevantandvaluablecanhaveasignificanteffectoncompany per-formance(Keimetal.,2008).Thereforethereisaneedforsystems whichenabletheeffectivemanagementofthis‘bigdata’.
∗Correspondingauthor.Tel.:+4401415485939.
E-mailaddress:[email protected](H.J.Grierson).
This paper presents the preliminary findings from an eval-uationof a data visualization systemdesigned toenable faster andmoreaccuratesearchingandunderstandingoflargedatasets. Thefirstsectionintroducestheconceptofdatavisualization sys-tems and presents the aim and hypothesis of the study. The secondintroducestheSIZLvisualizationsystemanddefinesthe researchmethodologyusedtoevaluateitseffectiveness.Thethird section presents the findings from the quantitative and quali-tative data gathered during evaluation, and the fourth section discusses the significance of these results as well as the limi-tationsof theresearch atthis stage. Thepaper concludes with detailsoffurtherworkrequiredtorefine theresearchand pro-vide furtherinsights into thebenefits of thedata visualization system.
1.1. Datavisualization
The rate at which data can be collectedand stored is out-growingtherateatwhichitcanbeanalyzed(Keim,Mansmann, Schneidewind,&Ziegler,2006).Asthesizeofdatasetsgrows expo-nentially,there isincreasingrisk thatmuchofthevaluableand relevantinformationstoredisbeinglostduetoineffectivesystems fordataexplorationandvisualization(Keim,2001).
Traditional, 2-dimensional methods of data visualization includecharts,graphsandplots.Thesevisualwaysofdisplaying
http://dx.doi.org/10.1016/j.ijinfomgt.2014.12.003
datahavebeendesigned tocommunicate informationin away thathumanscanmoreeasilyunderstandandanalyze.Chenand Yu(2000)conductedameta-analysisofinformationvisualization researchfocusedonusers,tasksandtools.Theresearchrevealed that given a consistent level of cognitive abilities, individuals showed a preference for simple visual–spatial interfaces. In otherwords, processingvisualinformation ismore intuitiveto humansthanprocessingothertypesofinformationsuchastext or numbers.Over the years, methods ofdata visualization and interactivegraphicshavebecomeincreasinglysophisticated.This progresshasalsoresultedinanincreaseintheuseof3Dvisual displays to present greater complexity in datasets and enable a more interactive, intuitive data searching experience. Some well-knownexamplesofdatavisualizationincludeGoogleEarth, GoogleImagesandChronoZoom(Alvarez&Saekow,2014;Google, 2014a,2014b),whichallowuserstosearchforinformationina visual,interactiveandmulti-dimensionalenvironment.
1.2. Stateoftheart
Therehasbeenmuch debateintheliteratureover the mer-itsof 3Dvisualization systems—dotheygenuinelyimprovethe effectivenessofinformationretrievalandanalysis? Earlier stud-iesinparticularpromoted3Dvisualizationasmoreintuitive(Ark, Dryer,Selker,&Zhai,1998;Robertsonetal.,1998).However,later studieshavequestionedthisassertion.Cockburn(2004)evaluated datastorageandretrievaltasksin2Dand3Dvisualizations.The studyconcludedthat whilst3Dsystems emulatea more ‘natu-ral’environment,theirbenefitsaretask-specific.Kosara,Hauser, andGresh(2003)alsostatethat3Dvisualizationscanhave detri-mentaleffectsonuserssuchasincreasedworkload,occlusionand disorientation.Schneiderman(2003)highlightsthat3D visualiza-tionscansimplifytasksandimproveinteractionsonlyifproperly implemented.Clearly3Disnotwithoutmerits,butitsapplication mustbecarefullyconsideredtoensureitistrulyprovidingbenefits tothedesiredtask(s).
Userscanprocessvisualizationsfasterthantext,and inexpe-rienced users can navigate3D interfaces more intuitively than 2D interfaces. However, several issues affect 3D visualization, suchascontext,interpretation,cognitiveanddimensional over-load(Pfitzner,Hobbs,&Powers,2003).Thefinebalancebetween beneficialandgratuitoususeof3Din datavisualizationhasled severalresearcherstorecommendtheuseofhybridor2.5D inter-faces(Baumgartner,Ebert, Deller,&Agne,2007;Wiza,Walczak, &Cellery,2004).Suchenvironmentscanprovideuserswiththe cognitive/spatial advantages of 3D whilst retaining the refined interactionsof2D(Baumgartneretal.,2007),thereforereducing thechanceofusersbecoming‘lost’inthesystem.
Other studies have explored in more detail the preferred functionalitiesforeffectivedatavisualizationsystems.Bergman,
Beyth-Marom,Nachmias,Gradovitch,andWhittaker(2008)found
thatusersshowapreferencefornavigationoversearchingwhen locating files that have a set structure, for example folders or e-mails, and argue that navigation reducescognitive work-load,becauseindividualsare psychologicallyprogrammedfrom childhoodtostoreandretrieveobjectsfromlocations.Whereas searchingreliesonanindividual’sabilitytoassociateattributesto anobject,forexamplethefilenameofadocument.Exploring navi-gationfurther,Hornbæk,BedersonandPlaisant(2001)studiedthe useofoverviewsinuserinterfaces.Participantsshoweda prefer-enceforanavigationoverviewwhichallowedthemtokeeptrack oftheiractions,howevertheresearchersfoundthatthisoverview sloweddownperformance,possiblyduetoincreasedworkload. Theyproposetheimplementationofa‘zoomable’interfaceto over-cometheseissues.
1.3. Researchaims
Over theyears there have beencontinuing advancesin low cost, high performance 2D and 3D display and manipulation technologies, as wellasever-increasingcomputation power. At thesame time,thehuge increase indata generated by compa-nies,projectsandevenindividualshasledtogreatchallengesin visualizingand searchingfor information.Thisprojectemerged fromtheideathatexploitingthehuman“cog”withinthese sys-temsprovidesanopportunitytoredressthebalancebetweenhigh volume information/datastorage andeffective navigation.Thus findinginformationmoreeasily.
Therefore,theoverallaimofthisresearchwastoinvestigate thefeasibilityofusingvisualrepresentationsforthesearchingand browsingoflarge,complex,multimediadatasets.Drawingupon priorresearchinthisfield,thefollowinghypothesiswastested:
Humanbeingsfindtherecallandrecognitionof2Dand3Dshapes andenvironmentssointuitiveandeffortlessthatanysystemfor theeffectivemanagementanduseofdatashouldmakeuseofthis fact.
Inadditiontothishypothesis,anumberofmorespecific ques-tionswereraisedduringtheearlystagesoftheresearch,including:
•Cananewsystemallowan“ataglance”pictorialsummaryofits content?
•Cantheinformationinterfaceallowuserstospotrelationships indatamoreeasilyby“illustrating”thecontentsoffilesthrough iconrepresentationsthatreflectthecontextofinformation?
•Cananadvancedvisualinterface(a‘zoomingtimeline’)impact onauser’sabilitytoquicklyandaccuratelyfindindividualitems andidentifyrelationshipswithinsubsetsofthedata?
Asystemwasdevelopedthatwouldenabletheresearchersto answerthesequestionsandeffectivelytestwhether2.5D environ-mentscanbenefiteffectivedatamanagement.
2. Systemoverviewandresearchmethodology
2.1. IntroductiontoSIZL
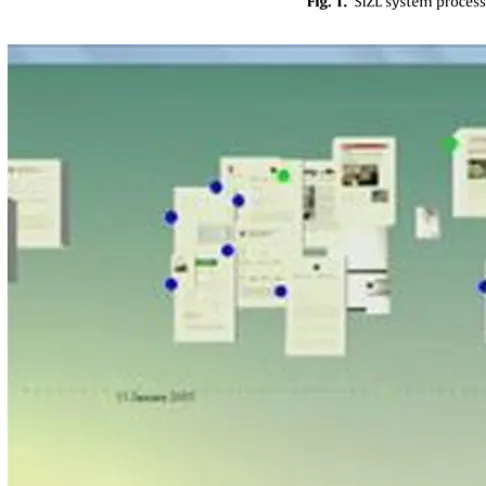
TheSIZL(SearchingforInformation inaZoomLandscape) sys-temwascreatedtoevaluateuserinteractionandexperiencewith datain2.5Denvironments,andenabletheresearcherstoevaluate theeffectivenessofthismethod.Thissoftwareprototypecombines azoominguserinterface(ZUI)andatimeline—azooming inter-facetoavisualinformationlandscape—andwasdesignedwiththe capabilitytoextractdatafromnumerousdocumenttypessuchas worddocuments,spreadsheets,PDFsandimagefiles.Thesoftware hasamulti-searchfunctionality,allowinguserstosearchwithin thedatasetformultiplekeywordsorphrasesthatarehighlighted simultaneously usingdifferent colours.Captured datacan then bemovedtothe‘lightbox’areatobecomparedand contrasted, enablingtheusertoidentifydocumentrelationships.TheSIZL sys-temprocessissummarizedinFig.1.Thesystemisdatabase-driven andfacilitatesthecreationofdynamicuserinterfacesinresponseto userinputs.ItwasdevelopedintheNetenvironmentusingC#, con-nectingtoaMySQLdatabase,usingSphinxsearchingtechnologyto indexandsearchthesystemcontent.
Fig.1. SIZLsystemprocesswithhumaninteractionsand‘humancog’inputs.
[image:3.646.116.471.57.193.2]Fig.2. EnteringsearchtermsintoSIZLhighlightsrelevantdocumentsalongthe zoomingtimeline.
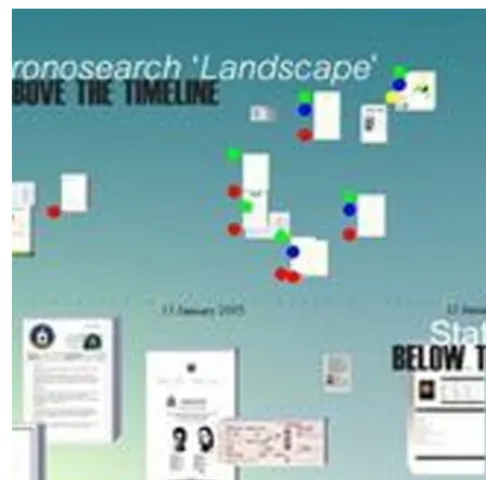
objectswhicharethenpresentedtotheuserinthe‘timeline’ sec-tionof theZoomingUserInterface(ZUI)—seeFig.2.Objectsare presentedas3Dblockswithdifferingdepths,providingtheuser withan‘ataglance’pictorialsummaryofthecontentofthe doc-umenteachmodelrepresents(seeFig.3).Theusercanfocusin detailontheobjectstheydeemrelevantbydroppingthemintothe ‘lightbox’sectionoftheZUI(seeFig.4).Theuserwillremove inter-faceoptionsthatarenotconsideredtoberelevantandreplacethem withobjectsthatrelatetothedirectiontheuseristakingwithinthe application,allowingthemtofocusonalimitednumberofchosen documents.Thesystem’sfunctionalityissummarizedinaYou-tube video (http://www.youtube.com/watch?v=PeEbfwKQu30)/ Video 1whichaccompaniesthispaper..
TheSIZLsystemwasdesignedtoevaluatefourkeyelements:
Timeline:providesinstinctivechronologicalflexibility.
Timeisaformofmetadataapplicabletoalmostallinformation. Thetimelineclassconsistsofmultiplearraysoftime-scales—days, hoursandminutes.Theuserhastheabilitytosettheupperand lowerlimitsofthetimelinewhichwillinturnlimittheavailability ofthedocumentstothosethatfallwithinthesetlimits.Theusercan
Fig.3. TheSIZLinterfaceprovidesavisualsummaryofeachdocumentinthedataset.
alsoexpandorcontractthetimelineallowingthemtomanipulate thevolumeofdisplayeddocuments.
Zoom:emulatestime,facilitatesusercontrolleddataconvergence.
Zoomingprovidesaninfinitelandscape.Thezooming function-alityhasbeencreatedbyfixingacameratothe2Dx-planeinthe 3Denvironment.ThisallowsuserstozoominandoutoftheZ-axis whichchangesthedistanceofthecameraplaneinrelationtothe displayedobjects.Thisallowstheusertocontrol(inconjunction withthetimeline)theamountofdocumentscurrentlyondisplay bythesystem.Furthermore,itallowstheusertofocusonclusters ofdocumentsthatmaybeofparticularinterest.
Visualizations:inter-documentrelationships.
[image:3.646.37.280.224.467.2] [image:3.646.307.549.227.466.2]Fig.4. Thelightboxfeatureenablesuserstocollectandanalyzerelevantdocuments.
haverelatingtothesearch.Forexample,knowingthenameofa personorplacebutnotknowingthetitleofadocument.
Interaction:conceptstomatchinput/outputdevices.
TheZUIisbasedaroundaninteractivetimelinewhichcanbe customizedbytheuser.TheZUIallowstheusertozoominandout ofdocuments;manipulatedocumentpositionsandscales;retrieve keyinformationrelatingtoadocument;and,openoriginal docu-ments.
Section2.3discusseshowtheSIZLsystemwasusedtotestthe researchhypothesis.ItshouldbenotedthattheSIZLsystemisa prototypeunderdevelopment.Itwasdesignedtosupportthestudy ofhowadvancedvisualinterfacesimpactuponauser’sabilityto findindividualitemsandidentifypatternswithinsubsetsofdata, andthereforeitistheinteractionsenabledbySIZLthatwerebeing evaluated,nottheusabilityofthesoftwareitself.
2.2. Methodology
Anexperimentalmethodologywasadopted sothatthe SIZL systemcouldbeusedtoevaluatetheuseofhumancognitionin effectivedatamanagement.Themethodologyprogressedinfour phases:
•Requirements
•Design
•Experiments(theevaluationprocessisdiscussedfurtherin Sec-tion2.3)
•Documentation,demonstrationanddissemination
Very few previous studies of visualization methods have includedadequateuserevaluation(Ellis&Dix,2006),meaningit isdifficulttomakeconclusionsregardingtheireffectivenessand applicability.Theuseofanexperimentalmethodologytoconduct userevaluationisasignificantcontributionofthisresearch.
Perhapsoneofthereasonsbehindthislackofuserevaluation istheconsiderablenumberofchallengesthetaskposes,someof whicharediscussedintheliterature.Oneofthemain complica-tionsinthiskindofstudyistheuseofcustomdevelopedsoftware.
Thesoftwareitselfisnottestedaspartoftheresearch,however, inevitably bugsand unfamiliarity withthesystemcan havean impactuponparticipantperformanceandexperience(Andrews, 2006).Similarly,theunfamiliarityofanewsystemcancreatea biasforanyexistingsystemsthatareincludedintheexperiment (Andrews,2006).TheseissueswereobservedintheSIZL evalua-tion,howevertheireffectswerealleviatedthroughtheuseoftwo pilotexperimentsandthepresenceoftheSIZLsoftwaredeveloper toassistparticipantswithanysoftware-relatedproblemsduring thetasks.
Anothercriticismofvisualizationevaluationsistheuseof stu-dents(Andrews,2006;Ellis&Dix,2006), astheywillnothave thenecessaryexperienceandexpertisetocarryouttheevaluation tasksaskedofthem,thusaffectingtheirperformanceand qual-ityoffeedback.Eighteendesignengineeringstudentswereused inthisstudy(2forthepilotand16 fortheexperiments). How-ever,ratherthantackleunfamiliartasks,thestudentsinthisstudy wereaskedtouseSIZLtoanswerquestionsabouta Hollywood spymovie.Thedecisiontouseapopularculturereferencemeant thatstudentsweremoreengagedwiththetaskandabletodigest instructionsmoreeasily,regardlessofwhethertheyhadseenthe movieornot.Furthermore,therewereadvantagestousinga stu-dentdemographic:thisagegroupistypicallyveryfamiliarwith visualizationsystems,inparticulargamestechnology,andassuch theycoulduseandlearnthenewsoftwarerelativelyquickly.
Accordingtotheliterature(Andrews,2006;Ellis&Dix,2006; Sebrechts,Cugini,Laskowski,Vasilakis,&Miller,1999),agood eval-uationofavisualizationsystemwillprovidetraininginthenew system,useappropriatetasksfortestingthatprovidemeaningful resultsforthekindoftasksthenewsystemisdesignedfor,anduse appropriatemeasurements.Section2.3willdiscusstheevaluation processthatwascarriedoutforthisresearch.
2.3. Evaluationprocess
Inordertoevaluatetheeffectivenessofexploitingthehuman cog in thesystem for effectivedata management, experiments wereconductedwiththeSIZLsystem.Microsoft’s‘FileManager’ system—thepredominantdatamanagementsystemusedin indus-trytoday—wasusedsoacomparisoncouldbemadebetweenthe speedandaccuracyofhumaninteractionagainstabaseline.The fic-tionalstoryfromthe2007movie‘TheBourneUltimatum’wasused asacasestudyfortheevaluation.
Firstly,SIZLandFile Manager werepopulatedwithidentical setsofdocuments(104documentsintotal)relatingtoTheBourne Ultimatumstory,includingnewspaper articles,receiptsand air-linepassengermanifests.Six questionsweresetrelating tothe movie—two‘easy’,two‘medium’andtwo‘difficult’.Participants wereaskedthreequestionsforSIZLandthreequestionsforFile Manager.Whichquestionwasaskedofwhichsystemwas alter-natedbetweentests.Thedifficulttasks(questions3and6)were specificallydesignedtotestuser’sabilitytoretrievefile relation-ships.Questionsincluded:
•Easy:e.g. Whatweaponis usedbytheassassin whowasnot workingfortheCIA?
•Medium:e.g.WhichofhisaliasesdidBourneusetotravelfrom MoscowtoParis?
•Difficult:e.g.WhogavetheordertoassassinateSimonRoss?—Give yourevidence.
[image:4.646.47.290.56.296.2]0 20 40 60 80 100 120 140 160
20 15
10 5
0
Time (Sec)
Parcipant No.
FM Time
FM Accuracy SIZL Time
Fig.5.Participants’timeandaccuracywhentestedonbothFileManagerandSIZL.
computeroronline,with7participantsstatingthattheyspentover sevenhoursaday.Thissurveyindicatedthattheparticipantswere ingeneralhighlyfamiliarwithvisualizationsystems.
Firstly,participantsweregiven abasic FileManager tutorial anda SIZLtutorialtofamiliarizethemselveswiththesoftware. Next,participantseachspent20minansweringthreequestionson FileManager(actingasanunorganizedfilingsystem)and20min answeringthreequestionsonSIZL.Theyansweredaneasy,medium and difficult question for each system. The number of correct documentsfound(accuracy)andthetimeittookthemtoanswer questions wasrecorded (summative testing). Participants were alsoencouragedto‘thinkaloud’andtheirthoughtswererecorded throughout(formativetesting).Afacilitatorwasalwaysavailable toassistwithuseofthesoftware.
Participantswerethenaskedforimmediatefeedbackthrougha semi-structuredquestionnaire.Theywereaskedabouttheeaseof findinginformationanddeterminingrelationshipsbetween docu-ments.Somewerelaterinvitedbackforafocusgroupwherethey werepresentedwiththeoverallresults.Theywerethenaskedto reflectontheseresults,anddiscusstheirviewsthebenefitsand drawbacksofbothFileManagerandSIZL.
2.4. Analysis
Foreachexperimentconducted,bothquantitativeand qualita-tivedataweregathered:themeasurementoftaskaccuracyand time;the collection of user experiences from facilitator obser-vations and the ‘think aloud’ exercise; and the results of the questionnaireparticipantswereaskedtocompleteattheendof theirtest. Thisallowedthe researchtoexplore both the effec-tivenessof thevisualizationmethodsutilized inSIZLandusers’ preferencesforthesystem.
3. Results
Thissectionpresentsthefindingsfromthe16experiments,and thefocusgroupthatwasconductedatalaterdate.Recordingsof thetime andaccuracytocomplete asetoftasks(answer three questionsusingSIZLandthreequestionsusingFileManager);the qualitativedatafromobservationsandtheparticipantsurveywere analyzedtoidentifykeyfindings.Thefocusgroupwasusedto vali-datethesefindings.
3.1. Quantitativefindings
Duringtesting, facilitatorsrecordedboth thetimesin which participantsansweredthethreequestionsforSIZLandthethree questionsforFileManager,andtheaccuracyoftheiranswers(i.e. thenumberofrelevantdocumentstheparticipantretrieved).The resultsaredisplayedinFig.5.
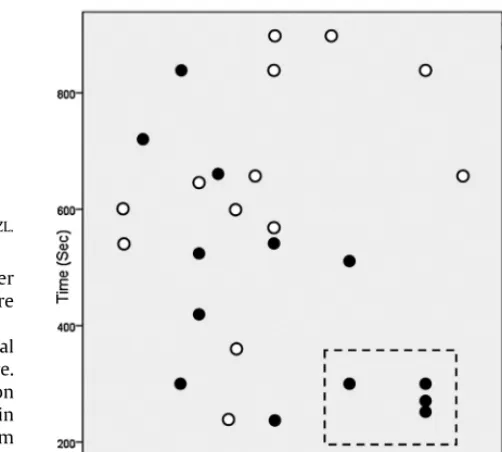
Byplottingtimeandaccuracytogether(Fig.6),itcanbeseen thatmanyparticipantswereabletoachievethesameaccuracyin SIZLasFileManager,insignificantlylesstime.Thisrelationship wasparticularlyclearforthedifficultquestions(3and6),which
Fig.6.SomeparticipantswereabletoachievehighaccuracyinlesstimeusingSIZL (highlighted).
werespecificallydevelopedtoevaluateparticipants’abilityto iden-tifyrelationshipsbetweendocuments.Nocorrelationwasfound betweenparticipants’performanceinFileManagerandSIZL.
3.2. Observationfindings
Duringtesting,facilitatorsrecordedboththeirobservationsof participantbehaviour,and anycommentsmadeby participants duringeachsession(usingthe‘thinkaloud’method).Thesenotes werethenanalyzedusingNVivosoftwaretoidentifythemost ben-eficialandpopularfeaturesoftheSIZLsystem,aswellasthemost commonissuesandcriticisms.Noteswerecodedwhenaparticular featureoftheSIZLsystemwasrecordedasbeingusedtoidentify thecorrectanswertoaquestion,orwascommentedupon posi-tivelybyaparticipant.Noteswerealsocodedwhenparticipants expresseddifficultyordislikeforaparticularaspectofthesystem. Firstly,consideringthemostuseful featuresof theSIZL sys-tem,byfarthemostcommonlyusedfeaturewasthemulti-search functionality.Participantsnormallybegantheirsearchfordataby enteringa number ofsearch termsintothesystem,and would oftenusetrialand errortoretrievethecorrect documents.The secondfeaturemostcommonlyreferredtointhenoteswasthe ‘lightbox’, whichparticipantsused toexaminepromising docu-mentsingreaterdetail.Basedonthetestingnotes,itwouldappear thatthezoomandtimelinefunctionswereusedlessfrequentlyin determiningthecorrectanswerstothequestions.
Focusingonparticipantcomments,againthemulti-search func-tionalityreceivedmuchpraise.Forexample:
‘The multisearchwasgreat,itwasveryusefulforseeing docu-ments.’
TheoverallvisualizationmethodoftheSIZLsystemalsoscored highly,with participantsexpressinga preference for the visual overviewofthedatasetthat SIZLprovides, andcommentingon howmucheasieritwastovisualizerelationshipsbetween docu-ments.Thezoomandtimelinefeaturesalsoreceivedsomepositive commentary.
[image:5.646.301.552.57.283.2] [image:5.646.40.274.57.143.2]documentsinmyhead,andthenforget.Visuallyseeingthe rela-tionshipsmadeitmucheasiertonarrowdownthedocstofindwhat Iwaslookingfor.’
Overall,comments onthe SIZLsystemwerehighly positive. Aspredicted,thevastmajorityofnegativecommentsconcerned the SIZL software design and on-screen layout of informa-tion;aspects notbeing testedin thisstudy. Inparticular, some participantsexpresseddifficultyinidentifyinghighlighted docu-mentsand difficultymovingdocumentsaroundthescreenwith thekeyboard.Theseproblemscouldbealleviatedwith improve-mentstothesoftwareprototype,andarenotdirectlylinkedtothe developedvisualizationsystem.AlthoughthedesignoftheSIZL softwarewasnotbeingtestedinthisstudy,itinevitablyhadan impactuponparticipants’experiencesandabilitytoretrievethe correctanswerstothequestions.Thesecondmostcommon nega-tivecommentrelatingtoSIZLwasunfamiliaritywiththesystem. Thisisacommonproblemwiththetestingofanynewvisualization system,andwasinpartalleviatedbyprovidingeachparticipant withaSIZL(andFileManager)tutorialpriortotesting;andaccess tothesystemsdeveloperduringexperiments.Anotherproblem sit-uationthatoccurredonseveraloccasionswasparticipantsgetting ‘lost’inthesystem—goingontangentsandstrugglingtogetback ontherighttrack.
Aswellasprovidinganinsightintothemostbeneficialaspects oftheSIZLsystem,theobservationdataalsodemonstratedthe ‘humancog’atworkwhenparticipantswereusingSIZL.The facili-tatorsregularlyrecordeduseofreasoningand‘realworldthinking’ whenparticipantswerenavigatingthesystemfor answers,and participants were often observed taking notes while problem-solving.Oneparticipantwasalsoobservedsearchingforwordsthat werenotincludedinthequestion,illustratinghowthehumanmind playsasignificantroleinthesearchforrelevantinformationwhen usingtheSIZLsystem.
In summary, the key findings from participant observation were:
•Themulti-searchfunctionwasthemostusefulandmostpopular featureoftheSIZLsystem.
•Participantsrespondedpositivelytothevisualizationprovided bySIZL.
•TheSIZLsystemutilizesthe‘humancog’inthesystem: partic-ipantsusedthesystemtonavigatetheirownproblem-solving processes.
3.3. Surveyfindings
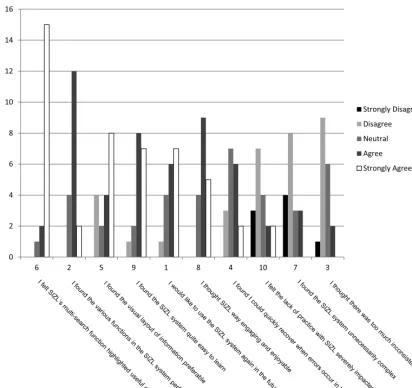
Participantswerealsoaskedtocompleteasurveyattheend ofthetest.ThisLikertscalesurveyaskedparticipantsabouttheir experienceofusingSIZLandtheirviewsonitseffectivenessasa visualizationsystem.Surveyresultsarepresented,indescending orderof positiveresponse, inFig.7.Corresponding tothe find-ingsfromparticipantobservation,thequestionrelatingtotheSIZL system’smulti-searchfunctionality(Q6)receivedthemost posi-tiveresponse.Participantsalsolargelyrespondedpositivelytothe usabilityoftheSIZLfunctions(timeline,zoom,lightbox,etc.)and visuallayoutofthesystem.Althoughunfamiliaritywasacommon complaintduringparticipanttesting,thesurveyresultsshowthat themajorityofparticipantsfeltthattheSIZLsystemwaseasyto learn,suggestingthisproblemwouldquicklydissipatewith expe-rience.
Mostofthe‘negative’responsestothesurveywereinresponse tonegativelykeyedquestions.However,asignificantnumberof participantsrespondednegativelytothestatement‘IfoundIcould quicklyrecoverwhenerrorsoccurinthissystem’(Q4).Thiscouldbe linkedtoproblemswiththesoftwaredesign,asdiscussedinSection
3.2,butcouldalsobelinkedtotheissueofseveralparticipants getting‘lost’intheirsearchforrelevantdocuments.
Insummary,thekeyfindingsfromtheparticipantsurveywere:
•Participants responded highly positively to the multi-search functioninparticular.
•Themajorityofparticipantsexpressedapreferenceforthevisual layoutoftheSIZLsystem.
•Someparticipantsstruggledtorecoverwhenerrorsoccurredin thesystem.
3.4. Focusgroupfindings
Oncealldatahadbeengatheredandanalyzed,participantswere invitedtoattendafocusgrouptodiscusstheresultsandreflect ontheirexperienceoftheSIZLsystem.During thefocusgroup, theparticipantswerepresented withthekey findingsfromthe researchandaskedtodiscussavarietyofquestions andtopics, including:
•Didyouhaveapreferenceforeithersystem?
•Foreachsystemgivethebenefitsanddrawbacks.
•Intermsoflookingforinformationinlargedatasets,please com-mentonSIZL’smulti-search/timeline/zoomfeatures.
•PleasecommentonSIZL’sabilitytosupportthevisualizationof inter-documentrelationships.
Thisprocesscontributedtothevalidationoftheresearchresults, byreaffirmingthekeyfindingsfromresearchandprovidingfurther insightintothereasonsbehindtheseresults. Thekeyoutcomes fromthefocusgroupwere:
•In correlation with the qualitative data findings, the multi-searchfunctionwasthemostpopularfeatureoftheSIZLsystem. The timeline and zoom features, on the other hand, were not usedas readilywith someparticipantsunaware of these features.
•Alsomirroringthekeyfindingsfromthetests,errorsintheSIZL softwarewerehighlightedasakeyissue.Althoughtheusability ofthesoftwaredesignwasnottestedaspartoftheresearch, itinevitablyhadanimpactupontheresults.Forexample,itis possiblethatthelackofinterestinthetimelineandzoomfeatures couldbeattributedtothedesignoftheSIZLsoftware.
4. Discussion
4.1. Significanceofresearchfindings
Thisstudysetouttotestthehypothesisthathumanbeingsfind therecallandrecognitionof2Dand3Dshapesandenvironments sointuitiveandeffortlessthatanysystemfortheeffective man-agementanduseofdatashouldmakeuseofthisfact.Thiswas donethroughtheevaluationofavisualizationsystem,SIZL,which enablesuserstodiscoverrelationshipsandpatternswithinlarge datasets.
0 2 4 6 8 10 12 14 16
3 7 10 4 8 1 9 5 2 6
Strongly Disagree Disagree Neutral Agree Strongly Agree
Fig.7.Participantsurveyresults.
to improve users’ data mining experience. The findings also highlightedsomekeyareasforimprovement—betterusabilityof thezoomingtimeline functionalityand animprovednavigation experienceforuserswhomakewrongdecisionsandget‘lost’in thesystem.Improvements totheusabilityof theSIZLsoftware would also enable more accurate testing of the visualization method.
One of the key contributions of this study was the methodology—theuseofuserevaluationexperimentstoexplore theeffectivenessofanewdatavisualizationsystem.Ithasbeen establishedthatthereisalackofevidenceofuserevaluationinthe visualizationliterature,soitisanticipatedthatthismethodmay berefinedandreplicatedtobuilduponthepreliminaryfindingsof thisstudy,andmayalsoactasacasestudyforfutureevaluations ofvisualizationsystems.
4.2. Researchlimitations
Thispaperhaspresentedtheresultsfromthepreliminary eval-uationofanewdatavisualizationsystem.Duringthisphasethe testingprocesswasimprovedthroughtheuseoftwopilottests, howevertherewerestillanumberoflimitationstotheresearch. Somecanbeattributedtotheearlystageofdevelopmentofthis system,othersarecommonchallengesfacedwhenattemptingto evaluateanyvisualizationsystem.
4.2.1. Numberofparticipants
Earlyevaluationofthesysteminvolvedonly16 participants. Whilst this is considered an acceptable number for the qual-itative elements of the methodology (observations and focus group), a sample size of 50–100 participants is more appro-priate for identifyingstatisticallysignificant findings (Andrews, 2006). Therefore, although the statistical analysis of the 16 experiments provided interesting and significant insights into themerits of theSIZL system,furtherevaluation witha larger number of participants is required to provide more conclusive results.
4.2.2. SIZLsoftwaredesign
[image:7.646.85.498.56.444.2]feedbackwillenabletheSIZLsoftwaretobeimprovedforfuture evaluation.
4.3. Implicationsforindustry
Asglobal partnerships and collaborative workspaces, not to mentionthe‘bigdata’phenomenonofincreasinglydigitized busi-nesses,leadtoincreasinglylargeandcomplexdatasets,traditional text-basedsearchsystemsareinadequateforeffectiveinformation management.ThefunctionalityprovidedbytheSIZLsystemhasthe potentialtoimprovethedataminingexperienceinawiderange ofindustrieswithaneedtomanagelargenumbersofdocuments, understandthetimingofthesedocumentsandtherelationships betweenthem.
Thereareagreatvarietyofindustrysectorsthatcould bene-fitfromanimprovedmethodofminingrelevantdata.Threekey sectorsidentified forthis researchwereDefence,ITand Manu-facturing.TheUK’sdefenceexportmarketexceeded
£
7bnforthe firsttimein2009andtodayaccountsfornearly20%oftheglobal market.Similarlymanufacturingisanimportant partoftheUK economy.Itaccountsfor12.8%ofUKgrossdomesticproduct(GDP) and55%oftotalexports.Thesoftwareindustryalthoughsmaller bycomparison is pivotal totheproducts ofmany other enter-prises.TheproposedSIZLsystemcouldsupportbusinessneedsof allthreesectors.Thisisparticularlyrelevantinthedefence indus-trieswheresecurityisparamount,andinformationhastobestored andretrieved—innearrealtime—safelyfromincreasinglydiverse anddistributedsources.Oneofthekeybarrierstoimplementinganewsysteminany workplaceis‘familiaritybias’:evenifthenewsystemeventually providesanimprovedexperience,theeffortandtimerequiredto becomefamiliarizedwiththenewsystemmeansthatpeopletend toexpressapreferencefortheold,familiarsystem(Andrews,2006). ThiswasalsoanissueduringtheevaluationofSIZL,and,although thesoftwaredesignwasnotbeingtestedaspartofthestudy,it inevitablyhadaneffectuponparticipants’experience.Theproblem offamiliaritybiascouldbealleviatedbycombiningthe implemen-tationofthenewvisualizationwithahighstandardofuser-friendly interfacedesign.
5. Conclusions
Thispaperhaspresentedthefindingsfromtheearlyphaseofa studyofexploitingthehuman‘cog’withinadatavisualization sys-tem;testingthehypothesisthathumanbeingsfindtherecalland recognitionof2Dand3Dshapesandenvironmentssointuitiveand effortlessthatanysystemfortheeffectivemanagementanduseof datashouldmakeuseofthisfact.Thepaperalsopresentedthe experimentalmethodologythatwasusedtoevaluatethe function-alitiesoftheSIZLsystem:datavisualizationandsearchingsoftware thatwasdeveloped specificallyfor thisstudy.Although further evaluationisrequiredtoprovideconclusiveresults,thisfirstphase hasindicatedthattheSIZLsystemdoeshelpuserssearchforand identifyrelationshipsbetweendocumentsinlargedatasets,when comparedtoatraditionaltext-basedsystem.Thekeyfindingsfrom thispreliminarystudycanbesummarizedasfollows:
•ParticipantswereabletoachievethesameaccuracyusingSIZL, inlesstime,whencomparedtoresultsforFileManager.
•Themulti-searchfunctionalitywasthemostcommonlyusedand mostpopularfeatureoftheSIZLsystemduringtesting.
•Participantsstatedapreferencefortheoverallvisualizationof theSIZLsystem.
•Thezoomandtimelinefunctionalitieswerenotusedasoftenas expected.
•Someparticipantsexperiencedproblemsofgetting‘lost’inthe SIZLsystem.
Thenextstageinthis researchisarefinementof the evalu-ationprocessand furthertestingwithimprovedsoftwareanda largerpoolofparticipantstoprovidein-depthandreliableinsight intothebenefitsofusingadatavisualizationsystembasedonthe SIZLmodel,as wellasa greaterunderstandingof thepotential applicationsforasystemthatutilizesthehumanmindtoprovide aricheruserexperience.
Acknowledgements
TheauthorswouldliketoacknowledgetheEPSRCandDstlwho fundedthisstudyaspartoftheDataInformationSystems(DaISy) Programme(EPSRCGrantEP/J020338/1)andalsothesystem deve-lopersBryanYoungandDrAndrewLynnandtheprojectevaluator, JenniferGriffith,alloftheUniversityofStrathclyde,Glasgow.
AppendixA. Supplementarydata
Supplementarymaterial related tothis articlecan befound, in the online version, at http://dx.doi.org/10.1016/j.ijinfomgt. 2014.12.003.
References
Alvarez,W.,&Saekow,R.(2014).ChronoZoom.[Online]Availablefrom:http://www. chronozoom.com/.[Accessed:27thMarch2014].
Andrews,K.(2006).Evaluatinginformationvisualisations.InProceedingsofthe2006 AVIworkshoponbeyondtimeanderrors:Novelevaluationmethodsforinformation visualization(BELIV‘06).NewYork:ACM.
Ark,W.S.,Dryer,D.C.,Selker,T.,&Zhai,S.(1998).Representationmatters:Theeffect of3Dobjectsandaspatialmetaphorinagraphicaluserinterface.InProceedings ofHCIonpeopleandcomputersXIII.Springer-Verlag.
Baumgartner,S.,Ebert,A.,Deller,M.,&Agne,S.(2007).2Dmeets3D:A human-centeredinterfaceforvisualdataexploration.InCHI‘07extendedabstractson humanfactorsincomputingsystems.SanJose:ACM.
Bergman,O.,Beyth-Marom,R.,Nachmias,R.,Gradovitch,N.,&Whittaker,S.(2008). Improvedsearchenginesandnavigationpreferenceinpersonalinformation management.ACMTransactionsonInformationSystems(TOIS),26,4.
Chen,C.,&Yu,Y.(2000).Empiricalstudiesofinformationvisualization:A meta-analysis.InternationalJournalofHuman-ComputerStudies,53,851–866. Cockburn, A.(2004).Revisiting 2Dvs3D implicationsonspatial memory.In
ProceedingsofthefifthconferenceonAustralasianuserinterface(Vol.28). Aus-tralianComputerSociety,Inc.
Dragland, A.(2013).Big Data -for betterorworse. [Online]Available from: http://www.sintef.no/home/corporate-news/Big-Data–for-better-or-worse/. [Accessed:27thMarch2014].
Ellis,G.,&Dix,A.(2006).Anexplorativeanalysisofuserevaluationstudiesin infor-mationvisualisation.InProceedingsofthe2006AVIworkshoponBEyondtimeand errors:Novelevaluationmethodsforinformationvisualization.ACM.
GoogleInc.(2014a).GoogleEarth.[Online]Availablefrom:http://www.google.co. uk/intl/enuk/earth/.[Accessed:27thMarch2014].
GoogleInc.(2014b).GoogleImages.[Online]Availablefrom:https://images.google. com/.[Accessed:27thMarch2014].
Hornbæk,K.,Bederson,B.,&Plaisant,C.(2001).Navigationpatternsandusabilityof zoomableuserinterfaceswithandwithoutanoverview.ACMTransactionson Computer-HumanInteraction(TOCHI),9.4,362–389.
Keim,D.(2001).Visualexplorationoflargedatasets.CommunicationsoftheACM, 44,38–44.
Keim,D.,Andrienko,G.,Fekete,J.,Gorg,C.,Kohlhammer,J.,&Melancon,G.(2008). Visualanalytics:Definition,process,andchallenges.Berlin,Heidelberg:Springer. Keim,D.,Mansmann,F.,Schneidewind,J.,&Ziegler,H.(2006).Challengesinvisual dataanalysis.InTenthinternationalconferenceoninformationvisualization.IEEE. Kosara,R.,Hauser,H.,&Gresh,D.L.(2003).Aninteractionviewoninformation
visualization.InState-of-the-ArtReport.ProceedingsofEUROGRAPHICS Pfitzner,D.,Hobbs,V.,&Powers,D.(2003).Aunifiedtaxonomicframeworkfor
infor-mationvisualization.InProceedingsoftheAsia-Pacificsymposiumoninformation visualisation(Vol.24).AustralianComputerSociety,Inc.
Robertson,G.,Czerwinski,M.,Larson,K.,Robbins,D.C.,Thiel,D.,&VanDantzich, M.(1998).Datamountain:Usingspatialmemoryfordocumentmanagement. InProceedingsofthe11thannualACMsymposiumonuserinterfacesoftwareand technology.ACM.
Shneiderman,B.(2003).Whynotmakeinterfacesbetterthan3Dreality?Computer GraphicsandApplications,23,12–15.
Wiza,W.,Walczak,K.,&Cellery,W.(2004).Periscope:Asystemforadaptive3D visualizationofsearchresults.InProceedingsoftheninthinternationalconference on3Dwebtechnology.ACM.
HilaryGriersonstudiedArchitectureandDesignattheUniversityofStrathclyde, Glasgow,andattheGraduateSchoolofDesign,HarvardUniversity.Shenowworks atDMEM,UniversityofStrathclydeandhaspublishedover40journaland con-ferencepapers,onglobaldesigneducation,informationmanagementandcreative designmethods.DrGriersonworkedontheDIDETprojectwiththeCenterfor DesignResearchatStanfordUniversity,researchingintoglobaldesigneducation. MorerecentlyshehasworkedontheEPSRCfundedDAISY(DAtaIntensive SYs-tems)project—investigatingthevisualizationandhandlingoflargesecuredatasets fordefenceindustries.
JonathanCorneyisaProfessorof‘DesignandManufacture’attheUniversity ofStrathclyde.PriortothisappointmenthewasintheMechanicalEngineering
DepartmentatHeriot-WattUniversityandEdinburghUniversity’sArtificial Intel-ligenceDepartment.HisresearchinterestscentredaroundmechanicalCAD/CAM include:featurerecognition,3Dcontentbasedretrieval,cloudmanufacturingand userinterfacedesign.Heisalsoactiveinvariousareasofadvancemanufacturing (coldformingprocesses)anddesign(highpressurepumpsandprostheticcovers). WithintheUniversityheisinvolvedinthemanagementofthedepartment’sEngD centre,theWeirAdvanceResearchCentreandScottishInstitutefor Remanufactur-ing.