City, University of London Institutional Repository
Citation
:
Divall, S., Goodey, R.J. and Taylor, R.N. (2014). The influence of a time delay between sequential tunnel constructions. Paper presented at the 8th InternationalConference on Physical Modelling in Geotechnics, 14-01-2014 - 17-01-2014, Perth, WA.
This is the accepted version of the paper.
This version of the publication may differ from the final published
version.
Permanent repository link:
http://openaccess.city.ac.uk/4358/Link to published version
:
Copyright and reuse:
City Research Online aims to make research
outputs of City, University of London available to a wider audience.
Copyright and Moral Rights remain with the author(s) and/or copyright
holders. URLs from City Research Online may be freely distributed and
linked to.
City Research Online: http://openaccess.city.ac.uk/ [email protected]
1 INTRODUCTION
In urban areas surface space is often congested and to meet growing demands engineers have often uti-lised sub-surface space for various services. Tunnel-ling is used extensively for mass rapid transit sys-tems. Tunnels are often constructed in pairs for this function which is known as twin-tunnelling.
Any underground construction causes stress changes within the soil mass which can lead to ground movements. The propagation of these ground movements has the potential to cause dam-age to existing buildings and buried services (Mair et al., 1996). The sources of the ground movements investigated in this study are those arising from con-struction using a Tunnel Boring Machine (TBM). The ground movements generated using this con-struction method are deformations towards the new-ly created cavity and are often characterized as vol-ume loss. A full discussion and categorisation of these displacements is presented by Mair & Taylor (1997). These sub-surface movements are apparent at the surface as settlement trough. This is often di-vided into longitudinal and transverse settlements. In the case of single tunnels the transverse settlement trough has be shown to be well represented by a Gaussian distribution (Peck, 1969).
Many tunnelling construction guidelines have been developed based on research from single tunnel arrangements (e.g. Peck, 1969; Mair, 1979; Taylor, 1984 and Attwell & Yeates, 1984). Twin-tunnelling
surface settlement predictions are often the superpo-sition of two single tunnel predictions. The assump-tion is that the construcassump-tion of a second tunnel is un-affected by the presence of the first.
A number of field observations of twin-tunnelling sites have shown a relative difference between the monitored settlements generated during the first and second tunnel constructions. Such examples include St. James’ Park (Nyren, 1998), Lafayette Park (Cording & Hansmire, 1975) and The Heathrow Ex-press (Cooper & Chapman, 1998). Numerical stud-ies have also shown the existence of this phenome-non and postulated that superposition may not necessarily be sufficient (Hunt, 2005 and Ad-denbrooke & Potts, 2001).
The current research programme is to explore the ground movements in overconsolidated clay when constructing parallel tunnels with a small separation distance. The current tests represent circumstances under which superposition may be considered ap-propriate. A number of plane strain centrifuge tests were carried out where two tunnels were constructed simultaneously. This would allow comparison with previous work where tunnels were constructed with a construction delay of 3 weeks at prototype scale (Divall, 2013). The current test series consisted of four experiments with equal centre-to-centre spacing and tunnel diameter. The results indicate the effect of any construction delay on the surface settlements.
The influence of a time delay between sequential tunnel constructions
S. Divall, R.J. Goodey and R.N. Taylor
Geotechnical Engineering Research Group, City University London, UK
2 CURRENT PRACTICE
2.1 Single tunnel prediction method
It is generally accepted that in order to predict tun-nelling-induced ground movements above a single tunnel the displacements can be determined from a Gaussian distribution. This was proposed by Peck (1969) and verified by many site measurements and centrifuge tests (e.g. Mair et al., 1993). Semi-empirical approaches have been adopted for calculat-ing surface settlements and are usually expressed as:
2 2 2 exp max i x S
Sv (1)
i D L V S 2 313 . 0
max (2) where Sv = the settlement at a given horizontal dis-tance from the tunnel centre-line; Smax = the maxi-mum settlement at the tunnel centre-line; x = the lat-eral distance from the tunnel centre-line; i = the lateral distance from the tunnel centre-line to the point of inflexion in the Gaussian distribution curve; and VL = volume loss expressed as a ratio of the area of ‘lost ground’ to area of bored tunnel.
When considering the surface settlement trough above a tunnel, the volume loss is a measure of its magnitude and i a measure of its distribution. This implies that i controls the settlement trough width. O’Reilly & New (1982) proposed that:
0
Z K
i (3) where Z0 = the vertical distance from the unde-formed surface to the tunnel axis level; and K = a dimensionless trough width parameter. An average value of K = 0.5 was determined for tunnels in mod-erately stiff clay. This agreed in general with the findings of Peck (1969).
2.2 Twin-tunnelling induced settlement prediction methods
2.2.1 Superposition
Superposition is a method for predicting surface set-tlement above any twin-tunnel arrangement. A Gaussian distribution is assumed for the first tunnel and positioned over its centre-line. The same distri-bution is then positioned over the centre-line of the second tunnel ignoring any influence from the first. The summation of these two overlapping curves de-scribes the total settlement.
New & O’Reilly (1991) provided a formula for the prediction of the settlements above twin-tunnels by superposition:
2 2 2 exp 2 2 2 exp max i d A x i A x SSv (4)
where d = the lateral distance between the two tun-nel’s centre-lines; and xA = the lateral distance from the centre-line of the first bored tunnel.
The expression above assumes the tunnels are parallel and have the same tunnel diameter, volume loss and settlement trough width. This expression implicitly ignores any effect on the boring of the second tunnel that the existing (first) tunnel may have.
2.2.2 Accounting for asymmetry in settlements
During a series of 18 centrifuge experiments Divall (2013) varied the centre-to-centre spacing of twin-tunnel constructions. All these tests were conducted at 100 g. In this work the delay between the con-struction of each tunnel was 3 minutes at model scale and therefore analogous (in terms of consolida-tion) to a construction delay of 3 weeks at prototype scale. Detailed analysis contained within this work proposed a relative difference in the magnitude of ground movements between the first and second tunnel owing to the spacing and construction delay.
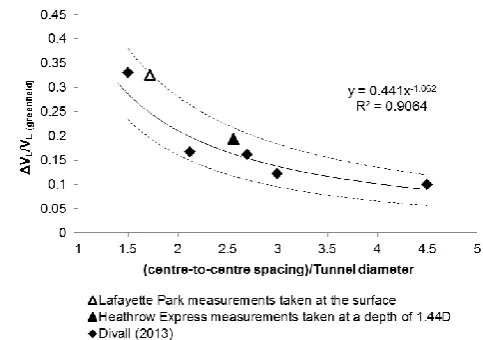
[image:3.595.307.549.554.724.2]Figure 1 describes the relative increase (as a per-centage) of the volume loss of the second tunnel when compared with the first tunnel (effectively the greenfield case). The horizontal axis shows the cen-tre-to-centre spacing of the tunnels normalised against the tunnel diameter. Substituting the mofied value of volume loss from Figure 1 and the di-mensions for the second bored tunnel into Equations (1) and (2) would give a better prediction of the set-tlements solely from this tunnel construction. The predicted total settlement would therefore be the summation of the unaltered first tunnel and the mod-ified second tunnel settlements.
3 CENTRIFUGE MODEL TESTS OF TWIN-TUNNEL CONSTRUCTION
3.1 Model Geometry
[image:4.595.313.554.141.315.2]A series of plane strain centrifuge tests (Table 1) were conducted in order to investigate the influence of a construction delay on the ground movements.
Table 1. Tests performed.
______________________________________________ Test Name Volume loss Construction delay ______________________________________________ SD11* 3 % 3 minutes SD14* 5 % 3 minutes DG01 3 % 0 minutes DG02 5 % 0 minutes ______________________________________________ * results taken from Divall (2013).
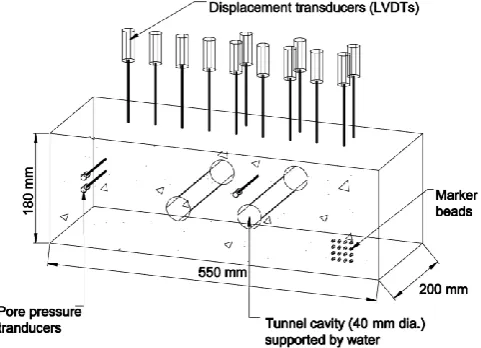
In this paper, four largely identical tests, varying only in volume loss and the time delay between the constructions are discussed. All of the models in Table 1 comprised preformed circular cavities in overconsolidated clay. The twin-tunnels were bored equally spaced from the model centre-line with a centre-to-centre spacing of 3D. All models had a cover to diameter ratio (C/D) equal to 2 and the tun-nel axis level was approximately 80 mm above the base of the model (Figure 2). The tests were per-formed in a plane strain strong box at 100 g.
Relatively complex apparatus was developed (de-scribed in Divall & Goodey, 2012) to simulate se-quential tunnel constructions. The function of this apparatus was to provide support to the cavities via a virtually incompressible fluid (water) during testing in a centrifuge model. Utilising water then allows for the simulation of the volume loss effect by re-moval of the fluid. The same apparatus was used in the test representing simultaneous tunnel construc-tion. A full discussion of the apparatus details are given in Divall & Goodey (2012).
The instrumentation used included Druck pore pressure transducers (PPTs), standard pressure transducers (PTs) and Linear Variable Differential Transformers (LVDTs). A rack of LVDTs was bolt-ed to the top of the strong-box for measuring vertical displacement at the surface. A row of nine LVDTs were placed along the transverse centre-line of the model at distances of 0, ±45, ±90, ±135 and ±180 mm from the midpoint of the box. Holes are present in the back wall of the strong box for the in-stallation of the PPTs within the model and the fluid feed for the tunnels. The PPTs were installed in the space between the tunnels and close to the bounda-ries. Two PPTs were positioned 75mm from the boundary at heights of 82 and 62mm from the base of the model. The standard pressure transducers were fitted to monitor the tunnel support pressure at
the tunnel axis level. The movements within the soil mass were also recorded via a digital image-processing system. Sub-surface patterns of move-ment were monitored by tracking marker beads pressed into the front surface of the clay however, only the surface settlement data will be discussed in this paper.
Figure 2. Typical plane stain centrifuge twin-tunnel model (Divall et al., 2012)
3.2 The centrifuge
The use of a geotechnical centrifuge as a tool for ex-amining geotechnical problems is well documented (Taylor, 1995). The geotechnical centrifuge used to carry out the series of tests was an Acutronic 661 available at City University London. This machine has a radius of 1.8 m and the capacity to test models weighing up to 200 kg at 200 g. Grant (1998) de-scribes the facility in detail.
3.3 Model preparation
The model preparation process was standardised across all the tests and is discussed in detail by Di-vall & Goodey (2012). The significant features of the process are described below.
The model making begins by removing the sample from the consolidation press. The front-wall of the strong box was removed to gain access to the clay front surface. It is usual practice, at this point, to seal the exposed surfaces of the clay with silicone oil in order to prevent the sample drying out. A spe-cially fabricated jig was clamped to the front of the strong box and a sharpened aluminium box cutter used to trim excess clay from the surface. To bore the tunnels a frame was fitted to the front of the strong box and corresponding plugged holes in the back wall removed. The use of these jigs ensured accuracy and repeatability. The tunnel cavities were cut with a 40 mm diameter circular seamless tube.
After the cavities were bored the tunnelling appa-ratus was placed inside. Every precaution was taken to bleed any air from of the tunnelling systems be-fore placement. Screwed to the back of the tunnel apparatus were fittings allowing for fluid in-feed. The fluid control apparatus was bolted securely to the strong box. The piping was connected and de-aired. The support window was lubricated with a high viscosity, clear silicone oil to reduce interface friction a bolted in place between the observation window and the strong box.
Finally, using a syringe, the tunnel membranes were injected with water to completely fill the cavi-ties. This ensured a stiff support was provided to the tunnel cavities during pore-water pressure equalisa-tion. The assembled model was weighed and placed on the centrifuge swing. 450 ml of silicone oil was poured onto the top surface to prevent evaporation of pore-water from the clay during testing. Once the power supplies, solenoid valves and transducers were connected the test commenced.
3.4 Test Procedures
After the acceleration had reached 100 g the tun-nels were isolated from the feed standpipe using a plug valve controlled by a rotary solenoid. The tun-nels were checked to ensure no leaks were evident in the membranes or piping. This was apparent from a constant tunnel support pressure reading. Assuming no leakage, the centrifuge could was left overnight until pore-water pressure equilibrium had been reached in the model.
Simultaneous tunnel constructions were per-formed by operation of the equipment to drain 3 or 5 % of the total volume of the cavities. The sequen-tial simulated constructions followed the procedure outlined in Divall & Goodey (2012). Essentially, a series of plug valves controlled by rotary solenoids could isolate individual parts of the fluid control sys-tem. When the simulation of Tunnel A was re-quired, the valve to Tunnel A was opened and fluid
was extracted. A similar procedure was repeated for Tunnel B. In every test the same amount of fluid was extracted from both tunnels. A 3 minute con-struction delay was adhered to in the sequentially tunnelling tests. The centrifuge was usually run for at least an hour post-test to allow any longer term movements to develop.
4 RESULTS
Each figure presented below allows for the compari-son of the results from the tests with simultaneous tunnel constructions with data from tests with se-quential tunnel constructions.
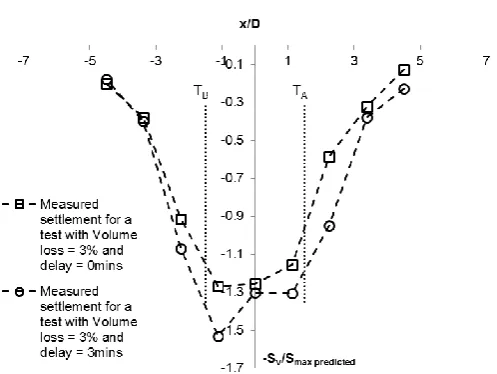
Figure 3 and Figure 4 shows the surface settle-ment data comparing volume losses of 3 % and 5 %, respectively. The data shown are taken immediately upon completion of both tunnel constructions. The horizontal axes are distance from the centre-line of the model normalised against a tunnel diameter. The vertical axes are vertical settlement normalised against a predicted maximum settlement for a single tunnel constructed in a greenfield site (Smax predicted).
The predicted maximum settlements used in Fig-ure 3 and FigFig-ure 4 are calculated from the single tunnel Gaussian settlement distributions using Equa-tion (2). The parameters required to calculate Smax predicted are i (or K) and VL. The volume of fluid ex-tracted from the tunnel is known and therefore VL is known. The value of K is based on the typical value measured by Divall (2013) for movements using this apparatus (K = 0.55). For clarity, the position of the centre-line of each tunnel is shown with the labels TA and TB.
Figure 3. Twin-tunnelling settlement at 3% volume loss at a centre-to-centre spacing of 3D.
[image:5.595.307.556.506.693.2]Figure 4. Twin-tunnelling settlement at 5% volume loss at a centre-to-centre spacing of 3D.
[image:6.595.40.289.41.218.2]In Figure 3 and Figure 4 there is a markedly dif-ferent shape observed between the settlement troughs obtained. The main difference observed is a level of asymmetry in the final settlement for tests where there is a delay between tunnel constructions. However, it should be noted that the data from tests with a construction delay also resulted in relatively larger settlements compared with those from tests with no construction delay.
Figure 5. Twin-tunnelling settlement where no construction de-lay was observed and at a centre-to-centre spacing of 3D.
Figure 5 compares the total settlement for the 3 % and 5 % volume loss tests where the time between the constructions was zero. The same axes as in Figures 3 and 4 were used. Grant (1998) showed the shape of tunnelling-induced settlements are equal for Volume losses ranging from 2 % - 20 %. Therefore, the settlements resulting from these different Vol-ume losses (normalised against their respective max-imum settlement) should be equal in Figure 5. This figure also shows the Superposition prediction curve. This curve is the average of the 3 % and 5 % Volume loss cases calculated using Equation (4).
The Superposition curve is shown to be in good agreement with both data sets.
There is some slight variation between the left and right sides of the settlement which are due to small differences in the initial positions of the LVDT footing. If these footings rest on areas of high curva-ture the readings can be marginally affected. Overall however, the settlements are still largely symmet-rical.
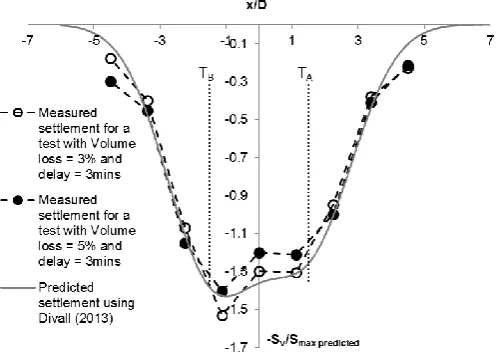
Figure 6. Twin-tunnelling settlement where a construction de-lay was observed and at a centre-to-centre spacing of 3D.
Figure 6 shows the total settlement for the 3 % and 5 % volume loss tests where the construction de-lay was equal to 3 minutes. In Figure 6 the Superpo-sition predicted curve was modified in order to achieve a better fit to these data sets.
Initially, a greenfield settlement curve was gener-ated for the prediction of settlements associgener-ated with the first tunnel construction. The trend in Figure 3 implies that for a centre-to-centre spacing of 3D the Volume loss associated with the second tunnel con-struction would be approximately 13 % larger than the greenfield equivalent. Therefore, an identical settlement curve to the first tunnel was used to rep-resent the settlement from the second tunnel but modified in Equation (2) by substituting in this new value of Volume loss. The summation of the unal-tered first tunnel and the modified second tunnel set-tlements produces the asymmetric total settlement prediction shown in Figure 6. Averages were taken of the 3 % and 5 % cases, similar that shown in Fig-ure 5. This modified curve, using FigFig-ure 3 is in good agreement with the both sets of experimental data.
5 CONCLUSIONS AND FURTHER WORK
[image:6.595.313.563.165.342.2] [image:6.595.29.280.399.575.2]shown to be adequate where both tunnels are con-structed simultaneously. However, superposition has been shown to have some shortcomings if there is a construction delay between the tunnels.
Further research is required in order to fully un-derstand the extent this construction delay has on the settlements. Future tests will investigate the effect on the tunnelling-induced settlements caused by a greater variation in the time between the simulated tunnel constructions.
6 REFERENCES
Addenbrooke, T.I. & Potts, D.M. 2001. Twin tunnel interaction – surface and sub-surface effects, In-ternational Journal of Geomatics, Vol. 1, pp. 249-271.
Attewell, P.B. & Yeates, J. 1984. Ground move-ments and their effects of structures, Blackie and Son Ltd.
Divall, S. 2013. Ground movements associated with twin-tunnel construction in clay, Ph.D. Thesis, City University London.
Divall, S. & Goodey, R.J. 2012. Apparatus for cen-trifuge modelling of sequential twin-tunnel con-struction, International Journal of Physical Mod-elling in Geotechnics, Vol. 12, No. 3, pp. 102-111.
Divall, S., Goodey, R.J., & Taylor, R.N. 2012.
Ground movements generated by sequential Twin-tunnelling in over-consolidated clay, Pro-ceedings of the 2nd European Conference on Physical Modelling in Geotechnics, Delft, online publication by TU Delft Library.
Cooper, M.L. & Chapman, D.N. 1998. Movements of the Piccadilly Line tunnels caused by the new Heathrow Express tunnels, Proc. of the world tunnel congress ’98 on tunnels and metropolises, pp. 294-254.
Cording, E.J. & Hansmire, W.H. 1975. Displace-ment around soft tunnels, Proceedings 5th Pam-Am Conference on Soil Mechanics and Founda-tion Engineering, Vol. 4, pp. 571-633.
Grant, R.J. 1998. Movements around tunnel in two-layer ground, Ph.D. Thesis, City University Lon-don.
Hunt, D.V.L. 2005. Predicting the ground move-ments above twin tunnels constructed in London Clay, Ph.D. Thesis, University of Birmingham. Mair, R.J., Taylor, R.N. & Burland, J.B. 1996.
Pre-diction of ground movements and assessment of risk of building damage due to bored tunneling,
Proceedings of the international symposium on Geotechnical Aspects of Underground Construc-tion, London, pp. 713 – 724.
Mair, R.J. & Taylor, R.N. 1997. Bored tunnelling in the urban environment, Proceedings of the Four-teenth International Conference on Soil
Mechan-ics and Foundation Engineering, Vol.4, pp. 2353-2385.
Mair, R.J. 1979. Centrifugal Modelling of Tunnel Construction in Soft Clay, Ph.D. Thesis, Cam-bridge University.
Mair, R.J., Taylor, R.N. & Bracegirdle, A. 1993. Subsurface settlement profiles above tunnels in clays, Geotechnique, Vol.43, No.2, pp. 315-320. Nyren, R. 1998. Field measurements above twin
tunnels in London clay, Ph.D. Thesis, Imperial College.
O’Reilly, M.P. & New, B.M. 1982. Settlements above tunnels in the United Kingdom - their magnitude and prediction, Tunnelling '82 - the 3rd International Symposium, Inst of Mining and Metallurgy, London, England, pp. 173-181. New, B.M. & O’Reilly, M.P. 1991. Tunnelling
in-duced ground movements; predicting their magni-tude and effects, (Invited review paper) Proceed-ings of the 4th International Conference on Ground Movements and Structures, Cardiff, pp. 671-697, Pentech Press.
Peck, R.B. 1969. Deep excavation and tunnelling in soft ground. Proceedings of the 7th International Conference on Soil Mechanics and Foundation
En-gineering, Mexico City, Vol.3, pp. 225-290. Taylor, R.N. 1984. Ground movements associated
with tunnels and trenches, Ph.D. thesis, Universi-ty of Cambridge.