Re-entry Analysis
By Viola RENATO,1)Thomas SCANLON,1)and Richard BROWN2)
1)Department of Mechanical and Aerospace Engineering, University of Strathclyde, Glasgow, UK 2)Sophrodyne Ltd Science and Engineering Research Studio, Glasgow, UK
(Received June 21st, 2017)
The development of a new methodology to estimate the ablative Thermal Protection System (TPS) behaviour and the external flux conditions during the re-entry phase of a space mission is described in this paper. Reduced-order codes are used to investigate both the flux aerodynamics and the ablative material pyrolysis phenomenon. The re-entry of the Stardust sample return capsule is analysed and the results are compared to high-fidelity coupled programs. The aim of the study is to prove that three-dimensional estimations of the external heat flux along the capsule, TPS external temperature and surface recession can be evaluated with reduced-order codes.
Key Words: Ablation, Thermal protection, Modeling, Stardust SRC
Nomenclature
A : pre-exponential constant,s−1 B0 : dimensionless mass blowing rate CH : Stanton number for heat transfer CM : Stanton number for mass transfer
cp : specific heat,J/kg-K E : activation temperature,K
F : viewfactor
h : enthalpy,J/kg
h : partial heat of charring,J/k ˙
mg : pyrolysis gas mass flux,Kg/m2s qrad : radiative heat flux,W/m2 qcond : conductive heat flux,W/m2
˙
S : surface recession rate,m/s
T : temperature,K
t : time,s
u : velocity,m/s
x : space coordinate,m
αw : surface absorption
: surface emissivity
λ : thermal conductivity,W/m-K ρ : density,kg/m2
σ : Stefan-Boltzman constant,W/m2-K4
τ : virgin mass fraction
ψ : decomposition reaction order Subscripts
c : charred
e : boundary layer edge
g : pyrolysis gas
i : i component
v : virgin
w : wall
1. Introduction
In Atmospheric (re-)entry, Thermal Protection Systems (TPS) are required to protect the internal part of the spacecraft from the extreme external temperatures. There are several
dif-ferent types of TPS but one of the most common and reliable are ablative materials. The phenomena occurring during abla-tion and pyrolysis are extremely complex and very difficult to simulate. Moreover, one peculiarity of the space field is that the majority of space missions differ greatly from one to an-other making it impossible to re-use the same preliminary stud-ies for more than one case. Various codes which are able to simulate the ablative material behaviour exist and are used in all the phases of the mission design. The majority of these codes can perform very accurate two or three dimensional analyses which can be computationally demanding; in addition, they are often coupled with CFD solvers which evaluate the external en-vironmental conditions during re-entry, thereby improving the precision of the studies but also increasing the computational resources required.
In the past, Kunz et al1) performed CFD calculations using SACCARA, a finite volume Navier Stokes code, and COY-OTE II, a program designed for the solution of general diff u-sion problems, based on the Galerkin form of the finite element method. Trumble et al2) presented results that were modeled through a CFD solver, Data Parallel Line Relaxation (DPLR), for the aero-thermal environment evaluation of Stardust re-entry; while the material prediction were carried out with the Fully Implicit Ablation and Thermal Analysis (FIAT)5) code. Olynick et al3) used the flow solver GIANTS for the air pre-diction and FIAT for the material behaviour estimation. Such codes are critical in the final stages of the design process to precisely study a TPS solution that is able to meet all of the missions requirements, however they may be too time consum-ing for the first stages of the design process when a significant number of computational studies are required to select the right materials to use or the optimal configurations. The code pre-sented in this paper was specifically designed for these prelim-inary studies of a space mission analysis. This code is one di-mensional and has the ability to simulate the thermal transient and the ablation processes occurring during an atmospheric re-entry.
2. Material thermal response code
The ablation code is a one dimensional code based on the im-plicit finite difference method. This program predicts the pyrol-ysis phenomenon progression and the changes of state and tem-perature in the thermal protection material. To do so it neglects almost completely the chemistry taking place in the pyrolysis gas and some other phenomena which have a minor influence in these material changes. The governing equations constitut-ing the code are presented in the followconstitut-ing section. Particular attention is devoted to highlight which terms are neglected.
2.1. Governing Equations
The in-depth energy equation takes the form:6)
ρcp
∂T
∂t =
∂
∂x λ
∂T
∂x
!
+(hg−h)∂ρ
∂t +S˙ρcp
∂T
∂x+m˙g
∂hg
∂x, (1)
the individual terms which form Eq.1 can be interpreted as: rate of storage of sensible energy, net rate of thermal conduction, pyrolysis energy rate, convection rate of sensible energy due to coordinate system movement, and net rate of energy convected with pyrolysis gas passing a point. The last two terms of this equation are neglected in the proposed approach. Local specific heat and thermal conductivity are defined as functions of tem-perature for both virgin an charred material. The local specific heat is formulated as shown in Eq. 2.
cp=τcpv+(1−τ)cpc. (2)
whereτrepresents the virgin mass fraction. The thermal con-ductivityλis evaluated using the same equation.
The ablative material is considered to be composed by three distinct components: two different fillers, of densityρAandρB, and a reinforcing material, of densityρc. Component degrada-tion can occur at different rates and is described by :
∂ρi
∂t =Ai
ρi−ρic
ρiv−ρic
!φi
e−Ei/T. (3)
where Ai, Ei, φi, ρiv, ρic are respectively the pre-exponential factor, activation energy, decomposition reaction order, virgin and charred density for the component i=A,B,C. The mass flow rate of the pyrolysis gas is evaluated as follow:
˙ mg= 1
A Z xw
x0
∂ρi
∂t
!
A∂x. (4)
The boundary condition for the ablative material internal sur-face is an adiabatic sursur-face while Eq. 5 formulates the external surface boundary condition.
ρeueCH(Hr−hew)+ρeueCM[Σ(z∗ie−z
∗ iw)h
Tw
i −B
0h
w]
+m˙chc+m˙ghg+αwqrad−FσwTw4−qcond =0.
(5)
Eq. 5 individual terms represent: convective flux, chemical en-ergy rate, rate of radiant enen-ergy input to the ablating in surface, rate of radiant energy emission from the ablating out surface and rate of energy conduction into the ablating material. In the proposed approach the chemical energy rate terms are neglected transforming Eq. 5 in:
[image:2.595.313.503.113.296.2]ρeueCh(Hr−hew)+αwqrad−FσwTw4−qcond=0. (6)
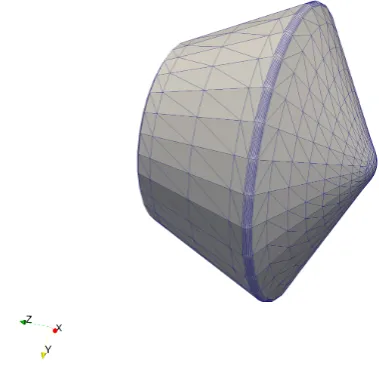
Fig. 1. Stardust SRC geometry used for the aerodynamic evaluations be-fore recession.
Finally, the charred material mass flux and the material reces-sion rate are evaluated using the material B’ table as functions of temperature and mass flow rate, if such table is available. The B’ table of a particular material contains the thermo-chemical parameters required to calculate the material surface recession for different pyrolysis conditions; the B’ table utilized in this work was generated using Mutation7) and the thermophysical database of CEA (Chemical Equilibrium with Applications).8)
3. Aero-Thermodynamic Model
As stated in the introduction, material response codes are used in combination with aero-thermodynamic programs to fully appreciate how the chemical, thermal and physical phe-nomena happening inside the TPS and in the external air sur-rounding the spacecraft interact and influence each other. The most commonly used tools to perform this task are CFD solvers. The aim of this work is to develop engineering type evaluations which do not require a level of precision that could be gener-ated by high fidelity codes such as CFD solvers. For this reason HyFlow,10)an internally developed reduced order code, was se-lected for the coupling. HyFlow is based on a combination of compression and expansion panel methods: it uses simplified equations and analogies to perform aero-thermal predictions of the flux surrounding a spacecraft during hypersonic flight. Both high altitude with free-molecular flow conditions and lower al-titudes characterized by a continuum flow can be estimated by this solver. All of the simulations are performed under the as-sumption of thermally and calorically perfect gas.
Time,s Altitude,km Velocity,m/s Temperature,K Density, kg/m
34 81.64 12590.4 216.93 9.63E-06
42 71.92 12413.4 221.42 4.16E-05
48 65.44 12004.0 229.00 1.06E-04
54 59.77 11136.7 238.47 2.34E-04
58 56.50 10245.7 245.37 3.62E-04
60 55.02 9718.7 248.48 4.39E-04
64 52.37 8560.2 252.71 6.18E-04
66 51.19 7956.9 253.55 7.21E-04
70 49.10 6769.5 255.05 9.48E-04
76 46.51 5178.9 256.90 1.35E-03
[image:3.595.59.533.63.401.2]80 45.05 4298.7 255.99 1.65E-03
Fig. 2. Comparison of the heat flux at stagnation point as function of time. The dotted line is the heat flux evaluated by Olynik at al3) using a CFD solver while the solid lines represent the heat flux estimated by HyFlow and the heat flux used to perform the analyses which correspond to 80% of the previous value.
used. The method consists of evaluating the convective heating rate starting from the velocity gradients in both the streamwise and crosswise directions.
In the current approach the shared data between the two codes is composed by the heat flux and the surface recession values on the different panels; thus the aerodynamic code is influenced only by the change of geometry but not by other phenomena caused by the material ablation (e.g. blocking, pyrolysis gas flux). These ablation characteristics do influence the aerody-namics but their effect is neglected in the current study.
4. Methodology
The test case proposed in the current study is the re-entry of the Stardust sample return capsule. The TPS of the capsule was formed by two different materials, PICA and SLA-561 V, and its thickness varied depending on its position on the capsule: the fore-body was composed by a thicker ablative layer than the aft-body. Due to some code limitations, the simulations were performed considering the PICA material of thickness 0.06 m for the entire capsule. Fig. 1 shows the Stardust SRC geometry and mesh used by the flow solver. The simulation air flow con-ditions for eleven time instances during the re-entry phase are shown in Table 1.
At the beginning of a simulation HyFlow estimates the heat flux
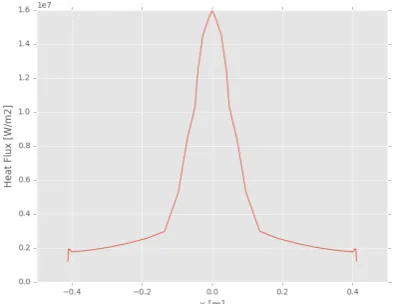
[image:3.595.60.274.74.394.2]Fig. 3. Heat flux distribution on the windward surface of the capsule at peak heat flux t=60s
Fig. 4. Heat flux trend at peak heat flux along the capsule external surface.
[image:3.595.306.533.86.416.2] [image:3.595.324.521.468.620.2]ma-30 40 50 60 70 80 90 time [s]
1500 2000 2500 3000 3500 4000
Temperature [K]
[image:4.595.56.262.68.234.2]current study Cheng and Milos
[image:4.595.322.520.79.233.2]Fig. 5. Comparison of the temperature at the stagnation point as function of time evaluated by the current study and by Cheng and Milos.4)
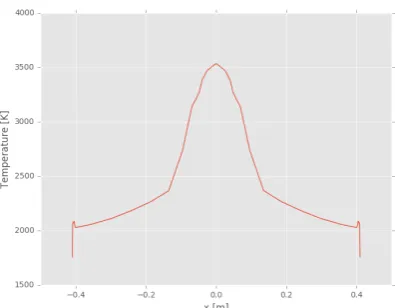
Fig. 6. Temperature distribution of windward surface of the capsule at peak heat flux t=60s.
terial state and recession for every panel are stored and used as initial conditions for the following iteration. Once the thermal code has completed one iteration it passes the recession values of the panels to HyFlow which implements this modification on the geometry before evaluating the heat fluxes for the following time instance on Table 1.
The ablative code is able to evaluate the material recession if the B’ table is available. In this analysis, the Theoretical Ablative Composite for Open Testing (TACOT) B’ table was adopted to perform the simulations; the expected error introduced by this decision is expected to be negligible due to the similarities be-tween the TACOT and the PICA material.
5. Results
The evaluated TPS characteristics are compared with the re-sults obtained using high-fidelity codes; in all these high fidelity codes the chemistry of the external air and the internal gases is included in the simulations while in the proposed approach it is neglected both internally and externally. Therefore some diff er-ences are to be expected.
Fig. 7. Temperature distribution on the windward surface of the capsule at peak temperature.
5.1. Heat Flux
Fig. 2 illustrates the comparison between the heat flux at the stagnation point generated by3)and the heat flux evaluated by HyFlow. HyFlow overestimates the heat flux due to the fact that it neglects all the chemistry taking place in the external flux. To mitigate this overestimation it was determined to apply a corrective factor of 0.8 to the heat flux values utilized by the material response code. For the high temperatures that the external air reaches during the re-entry phase the assumption of 20% losses caused by the flux chemistry was considered to produce conservatives result.9) In particular Fig. 2 shows that in the current case study the heat flux at the stagnation point for3) is still lower than 80% of the heat flux calculated by HyFlow. The assumption of conservative results might not be true for the leeward part of the geometry that sees lower external temperature; this was not considered problematic because a higher cause of uncertainty is introduced in those parts of the geometry by the use of a single material of equal thickness for the whole capsule.
Fig. 3 illustrates the heat flux distribution on the windward side of the capsule for the instance of peak heat. The stagnation point is the point of maximum heat flux on the geometry. Heat flux values along a section of the capsule passing for the stagnation point is shown in Fig. 4; this graph highlights the significant difference between the value at the stagnation location and the rest of the front surface.
5.2. Temperature
[image:4.595.59.259.314.456.2]the analysis and a section of the geometry after the analysis was completed.
5.3. Recession
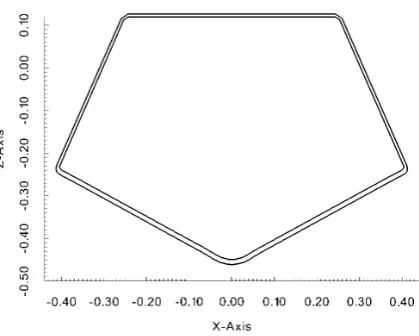
Fig. 8 illustrates the comparison between a section of the capsule before and after the simulation. The internal section corresponds to the recessed geometry while the external one correspond to the initial geometry. The distance between the two sections is higher in the region surrounding the stagnation point and it decreases farther away from that point. Moreover, the change of shape on the leeward side of the capsule is less evident than the one on the windward side. Fig. 9 represents the recession along the fore-body of the capsule. The maxi-mum recession is located on the stagnation point and it is equal to 12.0 mm; Olynick et al3)also found a recession of 12 mm for the stagnation point. The minimum recession eventuated in this study is of 6.7 mm for the leeward surface.
Fig. 9 shows a trend also present in Fig. 7 and 4: in these graphs the property has a sudden slope change at the point with dis-tance around 0.1 m from the stagnation location. This change is caused by the two different methods used to calculate the heat flux on the surface and it indicates the point where the code stops using the Reynolds analogy and starts using the alterna-tive method to evaluate the heat flux in the area around the stag-nation point. This abrupt slope dissimilarity could be avoided in future work including a more in depth study on where to place the border between the two heat flux prediction methodologies. Unfortunately, this type of study can not be applied universally but has to be performed for every spacecraft geometry. Another common trend in Fig. 9, 7 and 4 is an increase of the thermal characteristics in the points representing the conjunc-tion between the windward and leeward surfaces. The heat flux evaluation is based on the panel inclination and the surface cur-vature; both these properties vary in that region of the capsule leading to the jump in the heat flux, temperature and recession values. Fig. 10 illustrates the heat flux along the capsule curva-ture connecting the windward surface and the rest of the body and highlights the panels which generate the thermal property increase. This change in thermal values is not a mathematical error but an expected behaviour.
6. Conclusion
The results presented show that it is possible to use a reduced-order method to evaluate the internal material behaviour and
[image:5.595.61.271.67.235.2]stagnation point along the the capsule geometry.
Fig. 10. Heat Flux trend along the capsule curvature connecting the wind-ward surface and the rest of the body.
external flux aerodynamics during the re-entry phase of a space mission in three-dimensional space. In particular the prediction of the surface recession at the stagnation point was the same as the one calculated by Olynick et al3)while the surface temper-ature in the same location was predicted with a 10% error in comparison to Cheng and Milo.4) The overestimation of heat flux, which causes the temperature error, is due to HyFlow in-ability to evaluate the chemistry of the flux. These errors could decrease if an evaluation of the flux chemistry impact on the heat flux is conducted and applied in future. Another improve-ment that will be impleimprove-mented in the future is the possibility to have different materials for different parts of the spacecraft geometry and different TPS thicknesses. This will guarantee a higher precision in the predictions for the entire TPS.
[image:5.595.318.520.80.234.2] [image:5.595.320.543.269.437.2]References
1) Kuntz, D. W., Hassan, B. and Pott, D.L.: Predictions of Ablating Hypersonic Vehicles Using an Iterative Coupled Fluid/Thermal Ap-proach, Journal of Thermophisics and Heat Transfer, Vol.15,No.2, AprilJune 2001
2) Trumble, K. A., Sepka, S. and Jenniskens, P.: Postight Aerothermal Analysis of Stardust Sample Return Capsule, Journal of Spacecraft and Rockets, Vol. 47, No. 5, SeptemberOctober 2010
3) Olynick, D., Chen, Y.K. and Tauber, M.: Aerothermodynamics of the Stardust Sample Return Capsule, Journal of Spacecraft and Rockets, Vol.36, No.3, May-June 1999.
4) Chen, Y. K. and Milos, F.S.: Ablation and Thermal Response Pro-gram for Spacecraft Heatshield Analysis ,Journal of Spacecraft and Rockets, Vol. 36, No. 3, 1999
5) Chen, Y. K., and Milos, F. S.: Fully implicit ablation and thermal anal-ysis program (FIAT). Journal of Spacecraft and Rockets 36.3 (1999): 475-483.
6) Users Manual: Aerothermal Charring Material Thermal Response
and Ablation Program, Aerothermal Div., Acurex Corp., Mountain View, CA, Aug.1987
7) de Muelenaere, J., Lachaud, J., Mansour, N. N., Magin, T. E.: Stag-nation line approximation for ablation thermochemistry, 42nd AIAA Thermophysics Conference, 27-30 June 2011, Honolulu, Hi. 8) McBride, B. J., Gordon, S.: Computer Program for Calculation of
Complex Chemical Equilibrium Compositions and Applications, June 1996
9) Palharini, R.C.: Atmospheric Reentry Modelling Using an Open-Source DSMC Code. Ph.D. Thesis, University of Strathclyde, Glas-gow, UK, 2014.
10) Wuilbercq, R.: Multi-Disciplinary Modelling of Future Space-Access Vehicles. Ph.D. Thesis, University of Strathclyde, Glasgow, UK,, 2015.
11) Hankey, W. L.: Re-entry aerodynamics, Washington, DC: American Instituteof Aeronautics and Astronautics, 1988