Rochester Institute of Technology
RIT Scholar Works
Theses Thesis/Dissertation Collections
5-15-2012
Macroinvertebrates online
Caitlin TreutingFollow this and additional works at:http://scholarworks.rit.edu/theses
This Thesis is brought to you for free and open access by the Thesis/Dissertation Collections at RIT Scholar Works. It has been accepted for inclusion in Theses by an authorized administrator of RIT Scholar Works. For more information, please [email protected].
Recommended Citation
Macroinvertebrates Online
Caitlin Treuting
A Thesis Submitted in Partial Fulfillment of the Requirements for the Degree of Master of Environmental Science
Environmental Science Program Thomas H. Gosnell School of Life Sciences
College of Science
Rochester Institute of Technology Rochester, NY
May 15, 2012
Committee Approval:
______________________________________________________________________________
Karl Korfmacher Date
Committee Chair, Co-Advisor
______________________________________________________________________________
Michael Peres Date
Co-Advisor
______________________________________________________________________________
Gary Neuderfer Date
Committee Member
______________________________________________________________________________
Stephen Diehl Date
Table of Contents
Abstract ... 1
Introduction ... 2
Macroinvertebrates and Biological Pollution Indices ... 3
Barriers to Conservation... 7
Citizen Scientists and Citizen Scientist Programs... 8
Overcoming Barriers ... 9
Databases and Maps ... 10
Interactive Digital Identification Keys ... 11
The Project ... 11
Methods... 12
Photographing Macroinvertebrates ... 12
Editing the Photographs ... 15
Couplets ... 16
Distribution Map Data ... 18
Data Analysis ... 21
Results ... 22
E-vertebrate Website ... 22
Surveys ... 23
Discussion ... 27
Survey... 27
Conclusion ... 30
Appendix A Guide to Photographing Macroinvertebrates ... 32
Appendix E Results of Each Survey Event ... 47
Abstract
Macrobenthic invertebrates are important indicators of water quality in many aquatic systems, but accurately identifying these organisms is a challenge, particularly for citizen scientists, due to insufficient funding for training programs and events and a dwindling pool of training personnel. Accurately identifying these organisms is key to the accuracy of the models used to generate the water quality assessments. To help address these issues, this project has developed an interactive online photographic key for macrobenthic invertebrates, designed to improve classification accuracy with minimal training for use by citizen scientists. The online digital photographic field guide was created and tested against a widely used paper key (the Izaac Walton key). Classification exercises and user satisfaction surveys were conducted at different events over two years in order to compare the two identification methods. Results indicate that most participants preferred the online field guide, but that the digital field guide did not necessarily increase classification accuracy within all user groups. The results suggest the need for some basic experience or training in using macrobethic invertebrates for water quality assessment, similar to what high school or college students receive in aquatic ecology or field science courses.
Introduction
Background
Stream water quality assessments often focus on chemical analyses of nutrients
(primarily phosphorous and nitrogen), dissolved oxygen levels, conductivity, and other chemical tests. Chemical data, however, only give scientists a glimpse of what the stream quality is at the time of measurement. For this reason, chemical analyses are often augmented with geological or physical analyses (stream bank erosion and stream bed analyses), but biological assessments (samples of stream organisms) are used to assess water quality at seasonal or annual intervals, due to the lifespan of the organisms. Biological data reflect potential changes occurring in the stream over the year, using the organisms as markers, incorporating the chemical and the
physical factors. Areas of repeated sampling become reference sites, allowing monitoring teams to gauge upstream and downstream trends, as well as overall stream trends. Ideally, reference sites are minimally impacted by human development and represent undisturbed conditions (Chessman, 2006).
Benthic macroinvertebrates live in aquatic habitats in which many factors, such as the substrate, hydrology, land use, riparian vegetation, land use and water quality, can affect the type of invertebrate community present (Lamouroux, Doéledec, and Gayraud, 2004). These factors influence, or are influenced by, nutrient concentrations, water temperature, dissolved oxygen levels, water velocity, and water depth (Dewson, James, and Death, 2007). Due to most benthic macroinvertebrates' lifespans of approximately one year, their limited mobility and their low tolerance to changes in their environment, they are widely used as indicator species for stream quality. Use of benthic macroinvertebrates as water quality indicators is expanding to other water resources as well. In Europe, mayflies are now used for pond quality assessment (Menetrey et al, 2008). Macrobenthic invertebrates can also be used in monitoring marine environments (Borja, et al, 2000). Increasing the knowledge base of these benthic
macroinvertebrates can have greater application towards pollution control, impact assessments, and resource conservation (Society for Freshwater Science, 2011).
While biological assessments are in widespread use, there are a number of assessment aspects that need improvement. Some states have an official biomonitoring unit that collects information (chemical, physical and biological data) on water quality within that state. The biomonitoring unit in New York State, for example, does this for every stream on a five-year rotation. Data dissemination, however, is often delayed due to the processing needed for the sheer number of samples collected. Once processed, accessing these data can be difficult for those outside of the biomonitoring unit. For example, the New York State Department of Environmental Conservation (NYSDEC) publishes reports that you can download and read that summarize the biomonitoring units work and the protocol that they use, but if you want the raw data (what specimens, and abundances they were found in) you have to contact the
very small and insufficiently funded, perpetuating the data collection and dissemination issues. For example, the NYSDEC biomonitoring unit is made up of five people, all of which are taxonomists.
To help disseminate state and local data, agencies and departments within the Federal government have set up a number of data clearinghouses. The Environmental Protection
Agency’s (EPA) “Surf Your Watershed” data clearinghouse that incorporates state findings, as well as information from the United States Geological Survey (USGS) and citizen science programs that are working in a given watershed (Environmental Protection Agency, 2012). For example, by selecting New York State, Surf Your Watershed brings you to a webpage that allows you to access watershed groups, as well as volunteer monitoring efforts for New York state, along with their contact information, website and description of their organization. However, the STORET server, which is also run by the EPA, is not user friendly. Although you can get access to the field data, provided it has been uploaded, by clicking on the “get details” link of the stream, those data may not be complete. For example, Irondequoit Creek (Station ID 03023106)only has a single sampling season provided (April – November, 2005), and only the chemical data are provided.
To augment the official sampling teams, states often rely on citizen scientist monitoring efforts. Citizen scientists can be used to help collect data, but there are often limited resources for training them in the necessary skills for identification and analysis. In New York, a license to collect or possess is also required to collect macroinvertebrates in some stream systems (those that contain trout, among other fishes of interest), but not in other streams. Taxonomists who might conduct these training sessions to identify the macroinvertebrates are also in disagreement as to what level one should identify the macroinvertebrates to (order, family, genus, and species) in order to adequately assess water quality. The more detailed the identification, the more robust the water quality assessment, but that requires significant training, time, and increases the
chances of misclassifying an organism. In certain cases, the taxonomists themselves also have trouble replicating the identification of the same benthic macroinvertebrates classified by other taxonomists. Compounding the identification and training issues is the decreasing number of trained taxonomists due to retirement and a decrease in schools offering taxonomy courses (Holzenthal et al, 2010).
These related situations suggest the need for an efficient method to train citizen scientists to collect samples and accurately identify benthic macroinvertebrates without overburdening state biomonitoring staffs. This project proposes to develop an interactive digital key for benthic macroinvertebrates suitable for several skill levels of monitoring teams.
Macroinvertebrates and Biological Pollution Indices
taxa, as well as the individuals within the taxon family, may vary in their sensitivity to different disturbances. Generalizations are made on the family level for quick assessment of the site in question, but it would be desirable to have a diagnostic index which accounts for these
differences. For example, in a study conducted by Brix, et al (2011), the mayflies Eperous albertae and Serratella tibilais were absent or limited at the most contaminated sites, while Baetis spp., a metal tolerant mayfly, was found in abundance in the most contaminated section of the site.
Index values are typically determined through observations and experiments. For example, some species of caddisfly are intolerant of the insecticide diazinon, especially in their first instar stage (molting/growth) (Admiraal, 2004). Diazinon was banned for residential use in 2004 and is currently only used for agricultural purposes ("Aquatic life criteria," 2010). Another form of water pollution is inorganic nitrogen. Nitrogen can enter into the water through several different ways (surface and groundwater runoff, from the atmosphere, and dissolution of nitrogen rich groundwater, among others). The recommended level of nitrate in surface waters is 10mg NO3-N/L, although nitrate concentrations in waters have sometimes reached over 25mg NO3- N/L (Admiraal, 2004). One species of caddisflies, Hydropsyche exocellata, will leave their retreat and capture nets to escape potentially lethal nitrate and sodium nitrate. If there are short-term exposures of nitrate in the water, Echinogammarus echinosetosus, a type of gammarid species, appears to be more sensitive to nitrate than that of any other freshwater invertebrate in the study (Camargo et al, 2005).
Three orders are frequently used in biotic indices since they are among the most sensitive to pollution: caddisflies (Trichoptera), mayflies (Ephemeroptera), and stoneflies (Plecoptera) (Chen et al, 2009, Bode et al, 2002). The Ephemeroptera Plecoptera Trichopera (EPT) Biotic Index looks at the number of different taxa from these three orders found at a sampling site. That diversity number falls within a pre-determined range and is thus ranked excellent, good, fair, or poor. The greater the number of different species found, the healthier the stream is ranked.
New York State's biomonitoring group uses the Hilsenhoff Biotic Index (Bode et al, 1991, Smith et al, 2009). The Hilsenhoff Biotic Index (HBI) assigns a tolerance value to each species, from 0 (intolerant to organic wastes) to 10 (tolerant of organic wastes), which is then multiplied by the number of individuals of that species that are found. Summing the products and dividing by the total number of specimens that are found calculates the HBI index score. As the Hilsenhoff Biotic Index number increases, the probability of habitat degradation being present at that site also increases, but this test does not account for diversity in the aquatic community.
survey data collection. Some examples would include Gammarus sp (a crustaecaean), which has a tolerance value of 6, while Ameletus sp. (a type of mayfly) and Acroneuria sp. (a type of stonefly) have a value of 0 (Bode et al, 1991, Smith et al, 2009).
The Shannon-Weaver Diversity Index is another well-known biotic index. This index is used to evaluate the species diversity of the area being sampled. The advantage of the Shannon-Weaver Index is that it incorporates a diverse range of taxa and takes into account their
abundance (Chadd, 2010). The disadvantage of this index is that it only gives a numeric value and does not take into account the ecological (abiotic and biotic) needs of the organisms in order for them to survive in the area that was sampled (Chadd, 2010). The species richness index (SPP) also calculates the total number the different taxa/species found in the sample. The higher the species richness, the more it is associated with clean water conditions (Smith et al, 2009).
Another index that assigns values to the macroinvertebrates is the Percent Model Affinity (Bode et al. 1991, Bode and Novak 1992). This model attempts to account for both numbers and diversity by comparing a collected sample to the community of a ‘pristine’ model site. The model assigns percentage similarities to seven families representing sensitive, tolerant, and somewhat tolerant organisms (Oligochaeta, Ephemeroptera, Plecoptera, Coleoptera, Trichoptera, Chrionomidae, and Other). The total percent for both the sample and model must sum to 100%. One then compares the sample’s percent and that of the model’s percent and chooses the lesser values (Bode et al, 2002). The lesser values would then be summed from all seven groups and would determine the Percent Model Affinity score (Bode et al, 2002).
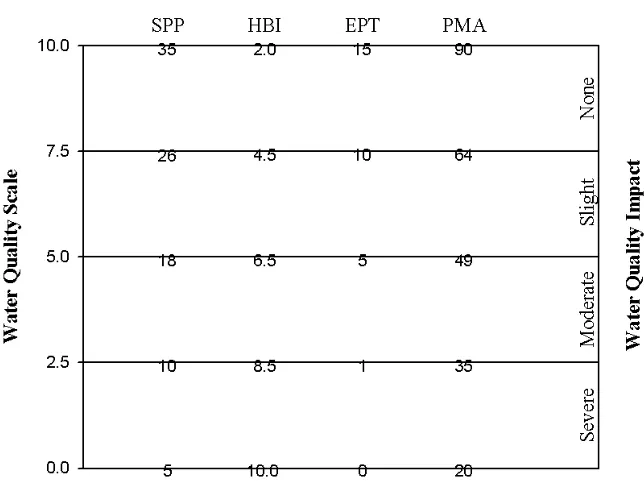
Figure 1. Biological Assessment Profile of the species richness (SPP), Hilsenhoff Biotic Index (HBI), Ephemeroptera Plecoptera Trichoptera richness (EPT), and the Percent Model Affinity (PMA) would be recalculated to fit a 0-10 scale for riffle habitats (Bode et al, 2002).
The water quality scale also helps scientists get a general idea of the overall water quality of a site since most of these indices look at different aspects of the community, but may not account for the community as a whole. Taking into account different indices for a habitat helps control for the weakness of any given index and creates a more complete picture of what is occurring in that stream. For example, if one location scores high on the species richness but low on the EPT test and PMA, this may show that there are varying amounts of species present in the area, but they may be more tolerant of pollution and changes to the environment than that of the mayflies, stoneflies, and caddisflies, leading to an ecological imbalance. Therefore, a stream may not be “healthy” overall, but it may have healthy elements.
Worldwide, there are many indices for assessing water quality using aquatic
suggests that not only are there a lot of indices, but that they may not address the needs of the research in a given area. Specialized indices are made for specific spatial components or microenvironments instead of developing an integrative index that can help account for environmental and spatial variability between sites. By developing an integrative index, predictable patterns of biological responses can be made if the technique is done consistently. Otherwise, inconsistent techniques can occur which could produce unreliable index results (Beck and Hatch, 2009).
Barriers to Conservation
Given that the freshwater benthic macroinvertebrates are primary indicators of freshwater health, it is important to study their biodiversity, population and distribution in order to develop effective indices. Some studies draw criticism stemming from a lack of taxonomists and the general lack of knowledge in the scientific community by citizen monitoring teams (Nerbonne et al, 2008). These issues are fueling a debate within the field as to what taxonomic resolution is required for water quality assessment- i.e., do you identify down to order, family, genus or species level (Holzenthal et al, 2010). It is estimated that there are less than 6,000 professional taxonomists in the world, although not all of them specialize in macroinvertebrates (Holzenthal et al, 2010). A study done by the U.S. National Science Foundation in 1985 estimated that there were 8,000 to 10,000 taxonomists in North America alone, with 60% focusing on animal phyla, 30% focusing on botany, 5% working on fossils, and 2% working on microorganisms (Gaston and May, 1992). To break it down further, out of the 60% animal phyla taxonomists, 32% studied tetrapods (vertebrates not including fish), 32% were entomologists (insects), 25%
invertebrates, and 11% studied fish (Gaston and May, 1992). Based off of surveys in the United Kingdom, North America and Australia, four out of approximately a million people are insect and spider taxonomists in the United Kingdom, and North America. However, in Australia, for every million people surveyed, 10 people were insect and spider taxonomists. This higher percentage of indicted participation in Australia may be due to increased taxonomy funding and/or to survey methodology (Gaston and May, 1992).
Not only are there a limited number of taxonomists worldwide, but their geographic distribution is skewed. By looking at who borrowed samples from the entomological collections at the Natural History Museum in London from 1987 to 1992 and their geographic location, it is estimated that 80% of entomologists are located in North America and Europe and 7% in the neotropical and Ethiopian areas (the other 13% was not specified) (Gaston and May, 1992).
error of misidentification, and thus jeopardizing the integrity of the assessment data (Holzenthal et al, 2010). This is due to the lack of funding and faculty support to educate others in the field of taxonomy. The decreasing number of taxonomists, as previously mentioned, can also be attributed to the introduction of DNA coding, a newer field and viewed as a better (but more expensive) technology for identification. People are now going into genetics, rather than
taxonomy, thus reducing the pool of field taxonomists and citizen scientist trainers (Holzenthal et al, 2010).
Citizen Scientists and Citizen Scientist Programs
To help alleviate limited funding and a lack of manpower, citizen scientists aid in environmental studies. Citizen Science can be defined as individuals in the general public having the capability to contribute to science by adding their knowledge/skills/time to the research (Stevenson et al, 2003). There are two ways that this can be accomplished. The first method is for scientists to team up with students so that the scientists can teach the students the rules and procedures of doing the research/experiment. The student benefits by learning and the scientist benefits from the additional help. The scientist in this approach does the analysis and the interpretation of the data (Stevenson et al, 2003). The second method, which originated due to the interest of the general public, is to allow people to add data about a topic or theme after some basic training on the rules and regulations of the program and to assume that the
participants are competent in their field (Stevenson, et al. 2003).
One well-known example of citizen science is the Christmas Bird Count, which started in 1900. People all over the globe record the birds that they observe from December 14th to
January 5th. This information is then used to assess birds population status, as well as help conservationists get an idea of what is occurring long term and to assess how to better conserve some species.
The World Water Monitoring Day is another program run by citizen scientists. Launched in 2009, it is sponsored by the USGS and the USEPA and over 120,000 people located in 81 countries have monitored their local waterways by measuring the water temperature, turbidity, dissolved oxygen, and pH (Water Environment Federation, International Water Association,
2012). On their website
displays a map of the world and locations where sampling took place. When clicked, these points open up a window that displays the water chemistry data in a graphical output.
that required the Minnesota Pollution Control Agency to draw oncitizen scientists to help monitor the streams (Nerbonne et al, 2008).
While citizen scientists play key roles in augmenting the work of professional survey teams, it is critical for citizen science programs to ensure that citizen scientist participants receive the necessary training, to inform them how their data are being used, and to get feedback on the quality of their collected data. To ensure that the citizen scientist participants receive the necessary training, some programs require that participant be certified by getting a perfect score on an online "quiz" that would go over the correct procedures and training. Maps, graphs, histograms and other visual aids being displayed online with the real data can help show how the data are being used (Bonney et al, 2009).
Without this oversight and quality assurance, biased sampling, identification and
reporting may take place. Especially for water quality assessment, the volunteers must be trained to correctly perform the protocol that is given to them from the sponsor scientists in order to maintain scientific rigor. Training topics should include the differences in the habitat type (riffle and run habitat, vegetation and snag habitat, cobblestone or muddy bottom streams), sampling techniques and sample collection and storage protocol in addition to how to key out an organism. This is important, since research has shown that oversampling in the riffles rather than on the vegetated banks may lead to a lower water quality assessment. It was also determined that using single habitat protocols can create higher water quality assessments than that of a multi habitat protocol (Nerbonne et al, 2008). These observations suggest that it benefits citizen science programs in water quality assessment to use many metrics of measurement to assess water quality and to have the proper training for the protocols used. Citizen scientists can use these applications to learn more and to add to the general knowledge.
While citizen scientists can certainly expand water quality assessment activities, the need for training and oversight, even if it is minimal, can still stretch overcommitted professional survey staffs. So there is a real need to develop tools, materials, and strategies that will help maintain high quality data collection through accurate assessments while reducing the oversight responsibilities of the professional scientists and technicians.
Overcoming Barriers
Since so many groups are involved in water quality monitoring activities, it is extremely important that collected data should be readily available to all groups to help aquatic
conservation and to increase the knowledge in this field. There are three areas that can
Databases and Maps
Several large-scale database initiatives are currently underway, such as the Encyclopedia
of Life
bodies, jointed limbs, and exoskeletons), however, are the least complete and the species level pages only give taxonomic data. There is little information about their biology, conservation status, photographs, or distribution (Holzenthal et al, 2010). In order to have a better knowledge base, and to make critical advances in the taxonomic academic field, the information from separate studies and research have to be gathered, combined and exchanged among scientists (McIntosh et al, 2007). This will enable scientists to identify patterns and the cause and effects of these patterns more so than analyzing individual studies. This synthesis of data should involve large scale and long-term data from multiple sites, which would require a lot of data sharing.
Creating a large-scale database that could be represented visually on a map that is also accessible to anyone who is connected to the Internet may help provide a tool to enhance data sharing between the different groups. There are some examples of such maps being used to merge different data from different sources together in a digital format. My WATERS (Watershed Assessment, Tracking and Environmental ResultS) Mapper
Protection Agency (EPA) that allows the user to download data as well as make personalized maps. This map contains data such as National Pollutant Discharge Elimination System
(NPDES) permits for each State, summary information from the Clean Watershed Needs Survey, and the National Hydrology dataset, as well as Storage and Retrieval (STORET) water
monitoring stations. Some data layers allow the user to download the data in different formats (xml and csv), and can link you directly to STORET, for access to additional information not displayed on the map. The reason for the creation of this online interactive map is to help make large scale databases from different programs maintained by the EPA's Office of Water
accessible and comparable to each other.
Today field guides can be found anywhere, libraries, bookstores, online and at home. There are over 3,000 English language field guides with topics ranging from birds, mammals, flowers, trees and reptiles (Schmidt, 2006). Field guides have many uses; some have
information on the organisms’ habitat range, life span, and what they are mainly used for identification. These guides are not only used for identification, but are also used as resources for other research. Most commonly these guides are used to determine distribution and habitat range of the species (usually for mammals or birds) followed by diet, breeding, and migration patterns (Schmidt, 2006). In fact, the Field Guide to the Reptiles and Amphibians of Britain and Europe by Arnold has been cited 163 times in scientific papers from 1985-2004 (Schmidt, 2006). Field guides not only play a significant role in the scientific community, but also create public awareness. All kinds of people use field guides for many different reasons. Birders, gardeners, ecotourists, educators that work at schools or at nature camps, naturalists, and professionals in such areas as land management, public health, and agriculture use field guides (Stevenson et al, 2003). Amateur bird watchers own, on average, two field guides, while more experienced birders own, on average, 14.3 field guides (Schmidt, 2006). This is the most extreme statistic considering field guides, since bird guides are the most common field guides; out of a sample of 50 field guides, 17 were devoted to birds (Schmidt, 2006).
Interactive Digital Identification Keys
With advances in technology, many field guides are now on-line and some are even created for mobile applications. For example, Peterson Field Guides of different type of birds are also available on the iPhone. The Audubon Guides are all downloadable as an application to iPhone, iPod touch, iPad, and Android devices for a small fee. The Audubon Guides are
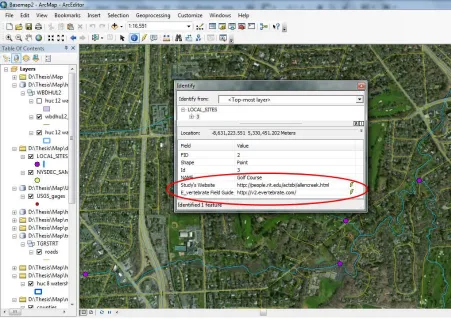
available onlin can then identify a specific species, leave notes on it as well as dates when it was sighted. Other members can go online and view these data by looking them up on the map, by viewing them by list, and through images of the subject identified. Having online field guides creates greater access opportunities while in the field. Creating an online field guide also makes it possible to tailor the guide to the experience of the user and to combine advantages of different
identification techniques (Stevenson et al, 2003).
The Project
The map portion of the service will have diverse information (water chemistry, land use/land cover information, and macroinvertebrates found at that location) from different sources (state agencies to citizen sciences). The user will also be able to input their field data into the map, and edit it through a form. However, these users will only be able to edit their own data. Over time the map will show trends in the data and become more useful as more and more people collecting these types of data (schools doing their own research, citizen science organizations etc), add to it. When people access the map they will be able to see where
sampling has taken place, as well as having different layers for different information that the user will be able to click to view or hide the data. When a data point has been clicked, the raw data at the point will appear. If that point is a place that has been sampled over several years, then a time series graph will also appear with the raw data. The time series graph will show the user how the population of macroinvertebrates in that sample area may have increased or decreased over time.
Methods
Interactive Digital Identification Keys/E-vertebrate Field Guide
Photographing Macroinvertebrates
Prior to being photographed, the macroinvertebrate samples included in this digital key (E-vertebrate website) were identified by the New York State Department of Environmental Conservation. Specific traits of the macroinvertebrates were then selected to be highlighted.
Many different photographic setups were tried. While some of the specimens were photographed alive, to preserve colors, most had been preserved in ethanol when photographed in order to capture the detail needed to distinguish specific features of the organisms. Whether or not the specimen was alive or preserved at the time it was photographed determined the type of lights that were used (continuous fiber optic lights for the dead specimens, or a fiber optic flash used for the live specimens), as well as what photographic setup that was used. All of the setups (Appendix A) consisted of the specimen being submerged in a 70% alcohol solution (or water for the live specimens) in order to keep parts of the specimen from creating flare, or non-image forming light. All photographic setups used fiber optic lights to create lightening to reveal the details of the specimen as well as to give it a realistic look.
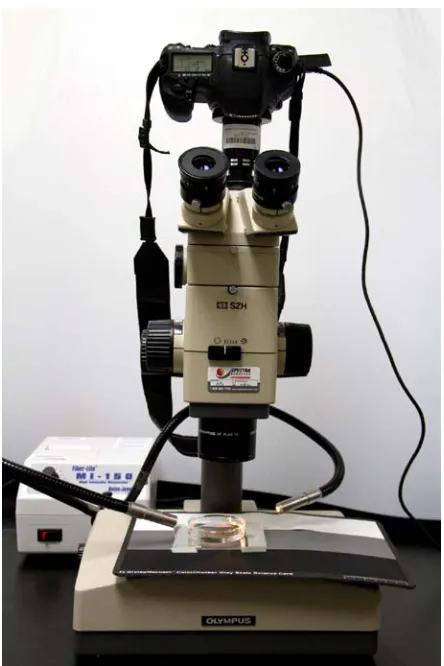
Figure 2.Macrophotography setup consisting of the camera (A), 2 extension tubes (B),100mm macro lens (C), fiber optic light (D), lab jack (E), gray card (F), petri dish, piece of glass, and a copy stand. The copy stand is what all of the materials are on, and what the camera is attached to.
The second photographic setup used consisted of attaching the camera to a dissecting microscope, which could be focused on the specimen located in the petri dish with either the gray card or white paper underneath (Figure 3) (Appendix A). Fiber optic lights were also used for side lighting. This was done in order to maintain the same lighting and background through all the photographs. The setup was adapted through trial and error by taking out the gray card and using the default white or black background in the dissecting microscope and using the internal dissecting microscopes light for backdrop/hair lighting. Combining the internal
dissecting microscopes backlighting with that of the fiber optic lights at an oblique angle helped enhance the photographs; it helped separate the specimen out from the background and gave the resulting image a greater sense of depth and roundness of the specimen.
Figure 3. Dissecting microscope setup that consists of a camera attached to a dissecting microscope with fiber optic lights at an oblique angle to the specimen in the petri dish that is located over a gray card on the dissecting microscope.
The third photographic setup used was created mainly to photograph a live crayfish. The setup consisted of using black felt (instead of a gray card or white paper) and a glass “cell” partially filled with water to keep the live specimen in. For the top view, the camera was attached to the copy stand and looked down on the specimen in the glass “cell”, situated on top of black felt. To get a “bottom view” the camera was put on the table and the “cell” was put atop the copy stand with the black felt above the “cell”. A fiber optic flash was used for lighting and was moved around as the specimen moved. The black felt was used for a backdrop and it seemed to calm the crayfish down probably due to its limited sight. This helped because the calmer crayfish would not move as much.
The photograph setup consisting of the macro lens (Figure 2) was used to photograph large structures or for the body photographs of large specimens, one which could easily be seen with the eye. Having the camera attached to a dissecting microscope (Figure 3) allowed close up photographs to be made of minute structures, such as the gills. These details could not be
captured through the macro lens setup. Having both the macro lens and the dissecting
Editing the Photographs
When photographing small objects, the more magnified the object, the less depth of field is available. Therefore, increased depth of field imaging was used. This included z-stacking software to obtain focus throughout the entire image. To create a z-stack, several photographs had to be made for each subject by using a different plane of focus in each photograph (Figure 4). These photographs can then be combined using a stacking software. There are many z-stacking software packages available. The z-z-stacking software used for this project was the Zerene Stacker™ image software. Zerene Stacker™ has two settings - the PMax and the DMax setting. PMax is better for preserving detail and working with subjects that may have
overlapping structures (Zerene Systems LLC, 2011). DMax is good for a depth map, which keeps the original colors, but isn’t good at preserving the original details (Zerene Systems LLC,
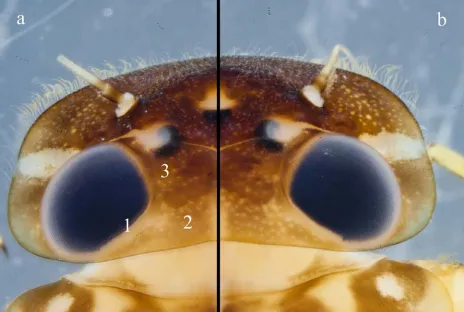
[image:19.612.91.523.292.580.2]2011). Therefore, the PMax setting was chosen over the DMax setting and resulted in better image quality when compared to other z-stacking software, such as Helicon Focus™ (Figure 5).
Figure 5. Comparison of z-stacks of Stenonemavicarium using a) DMax setting and b) PMax setting in Zerene Stacker™. The numbers represent the areas determined to lack sufficient detail using the DMax setting. 1) The lining of the eye is doubled/spotted. 2) The yellow dots were blended in with the rest of the head and are lost on the DMax. 3) The brown area on the DMax should be able to be delineated from the rest of the head similar to what is seen in the PMax.
Couplets
The couplets for the family and genus level were made based upon the Freshwater
Macroinvertebrates of Northeastern North America (Peckarsky et al, 1990). For the order part of the key, the couplets were a mix of Freshwater Macroinvertebrates of Northeastern North
America and the online Aquatic Macroinvertebrate Identification Key
order to limit the disadvantages of the guides and to take full advantage of their assets.
The Aquatic Macroinvertebrate Identification Key's comprehensible couplets and easy terminology make it simple for novices to identify macroinvertebrates. The key also identifies commonly found macroinvertebrates however it does not consider what classification they fall into, therefore limiting further identification by the novice.
The Freshwater Macroinvertebrates of Northeastern North America identifies the
needed by the user. However, the order level in Freshwater Macroinvertebrates of Northeastern North America is lacking in couplets to identify certain specimens. For example, the book contains identification steps to genus for crayfish, but the user must start at the order level knowing what order crayfish belong to. It seems to require that the user know most aquatic organisms to the order level initially.
By combining both the Aquatic Macroinvertebrate Identification Key and Freshwater Macroinvertebrates of Northeastern North Americaguide, the resulting field guide will provide a feature based starting point for the identification process. This should help fill the gaps present in Freshwater Macroinvertebrates of Northeastern North America, making it easier for beginners to start a classification as well as helping to ensure accuracy in the classification.
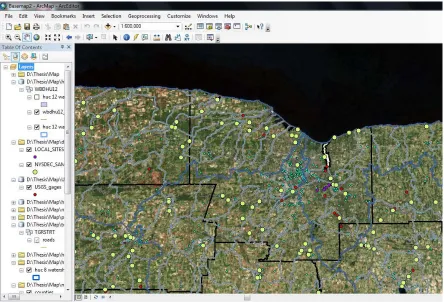
Distribution Map
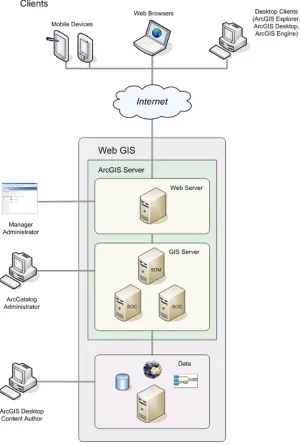
The distribution map and interactive database will be made using ArcGIS (ESRI, 2010) through ArcMap and digital basemaps. ArcGIS also contains ArcGIS Server, which is made up of a Web Server, a GIS Server and a Data Server (Figure 6). The Data Server contains all of the information of the map, such as the geodatabases, toolboxes, and data that you would use in order to create the map. The GIS Server then takes the information from the Data Server and packages it into a service for the client. The GIS Server is composed of two parts: the Server Object Manager (SOM) and the Server Object Container (SOC). When a client uses the
application and asks for information the Server Object Manager will manage the information and pull it from the Server Object Container. The Web Server hosts the services that are created from the GIS Server and puts them onto the Internet. The Web Server and the GIS Server make up what is referred to as the ArcGIS Server.
Figure 6. The network of the ArcGIS Server. (ESRI, 2012)
Distribution Map Data
New York State Department of Environmental Conservation, the Pennsylvania Department of Environmental Protection, and New Jersey Department of Environmental Protection were contacted for information on their macroinvertebrates. Different collection methods were obtained over a period of time and imported into ArcMap 10 as a *.shp file.
stations are located and has a hyperlink to those stations, which can bring you to real time data for that location. The 12 Digit and 8 Digit Watershed layers show the watershed and the sub watersheds boundaries of the area, which can help show what other characteristics of the other layers are in those watersheds and affecting them. The 2006 Land Use Land Cover layer displays classifications (emergent wetland, hay/pasture, water, urban high intensity, low, medium and high density residential, etc) of the land use/land cover. The land cover/use influences the type of runoff that ends up in the local water. This helps the scientists take into account where the water may be most impaired based off of agricultural runoff, where there may be more runoff than usual (impervious surfaces in the residential areas). This layer can also help put studies into perspective temporally by seeing how the change (or lack of change) in land use/cover may have affected the macroinvertebrate community. The impervious surfaces layer shows where most of the runoff is coming from. The TRI report layer shows the locations of facilities that report to the EPA on their toxic release inventory. The TRI report layer has a hyperlink that is specific for each facility and will take you to the EPAs website that has the reporting information for that facility. These layers combined create a complete map of references that one may know (streets) and that of information that may influence the macroinvertebrate communities and put it into geospatial reference.
Table 1. Layers in the distribution map that came from different sources and display different information that is important to water quality analysis.
Data Obtained Websites
Tiger 2010 Streets
National Hydrography Dataset 1:24,000
12 Digit Watershed Boundary Set
8 Digit Watershed Boundary Set
NY State County Boundaries (Shoreline Version)
Water Inventory/Priority Waterbodies List
Water Quality Classifications
TRI reports
USGS Gaging Stations
Impervious surfaces ArcGIS Online
NYS DEC Sampling NYS DEC Water Monitoring Group
2006 LULC
Data Analysis
To evaluate the effectiveness of the e-vertebrate tool, a survey exercise was developed for participants to key out an organism using a simple paper key (Izaac Walton League, 1999) and using the digital E-vertebrate Field Guide. Target groups included individuals from a variety of age ranges and environmental backgrounds. Overall 73 surveys were conducted at a public location (Imagine RIT in 2011 and the Seneca Park Zoo in 2012), K-12 classrooms, and in college courses. The objective was to survey a wide range of people with different levels of familiarity with water quality assessment to help determine how much training a person would need to accurately use the digital key and to see if the digital key was more accurate than the traditional paper key. The survey included background questions that pertain to their knowledge of benthic macroinvertebrates, their age, education level, as well as rating their satisfaction level (very satisfied, satisfied, neutral, dissatisfied, very dissatisfied) with the
photographs/illustrations, wording, ease of navigation, layout design, whether they would
recommend the application to a friend, what could be improved upon, what they thought was the best and worst part of the guide, and general comments/feedback (Appendix B). The students were also asked to comment on their confidence level of identification using the Izaac Walton Key, and that of the E-vertebrate Field Guide. The Izaac Walton Key was chosen for
Results
E-vertebrate Website
The field guide portion of the project can be accessed on web browsers such as Firefox,
Google Chrome, or Safari at
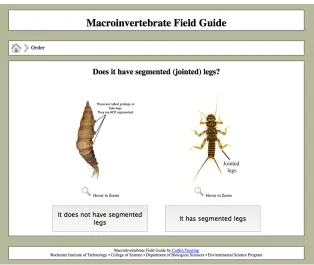
function correctly using Microsoft Explorer. The field guide went through several iterations. All versions had the user start out using a common illustration showing three different key entry points (order, family, and genus), with the order level being the recommended path to choose. The first edition of the field guide had only the order level working. The order level was based strictly off of the online Aquatic Macroinvertebrate Identification Key (Webb, 1999). The user was given a page that contained two questions, a title describing the attribute in question, and two photographs of specimens that fit the answers of the questions. To move onto the next couplet or solution page the user would have to click on the image of the answer they have chosen. At the end of the couplets the user would get to a solution page which only had the scientific name and some examples of the common names of the specimen. This version did not have an easy way to retrace your steps in case you misclassified the organism, which users found frustrating.
Figure 9. Version 2 of the E-vertebrate Field Guide photographs with the graphics describing the attributes, clickable buttons to continue on, and a clarified question posed to the user.
Surveys
Initially, students from the 2011 RIT Environmental Science Field Skills course were surveyed as a pilot for a larger data collection event (i.e., the 2011 Imagine RIT booth). Students in the Field Skills course are trained to use macrobenthic invertebrates in water quality
assessments using the Izaac Walton League key.
In addition to the Field Skills students, surveys were handed out during the 2011 Imagine RIT festival to people visiting the e-vertebrate booth (Appendix C). Imagine RIT is an annual event held at the Rochester Institute of Technology, in Rochester New York, showcasing different exhibits, demonstrations, and research projects by the Rochester Institute of
Technology faculty, staff, and students to the surrounding community. The diverse crowd made it possible to sample people of all ages and all levels of environmental understanding. The
Imagine RIT surveys were designed to have people identify a specimen using the Izaac Walton sheet and/or the E-vertebrate Field Guide and compare the ease and accuracy of the two methods.
training workshop, and 4th-6th grade students at the World of Inquiry (School 58) in Rochester NY. All groups were asked to participate in the exercise of trying to identify macroinvertebrates using the digital key and the paper key and then fill out the survey. The survey and exercise form used in 2012 (Appendix D) was adapted from the version given at Imagine RIT (Appendix C) and to the students in the 2011 Environmental Field Skills (Appendix B) course to reduce bias in the questions and to help create a direct comparison between the two methods of
[image:28.612.71.574.264.349.2]identification. Combined there are 55 surveys that have fulfilled the requirement of using both identification methods to identify an unknown specimen and to rate those identification methods (E-vertebrate Field Guide, and the Izaac Walton sheet).
Table 2. Overview of survey events showing participants identification accuracy using both identification methods. The identification accuracy is based upon the level of identification down to the order level.
The 2012 Field Skills survey event had the highest percentages of using both
identification methods (69.2%) and the E-vertebrate Field Guide (92.3%) to correctly identify the unknown specimens (Table 2). The 2012 Field Skills, and the 2012 Field Biology survey events had a higher identification accuracy with the E-vertebrate Field Guide than that of the Izaac Walton key. The World of Inquiry School 58 had the highest percentage of misidentification using both methods (45.5%), and the E-vertebrate Field Guide (63.63%), and is the second highest percentage in misidentification with the Izaac Walton (45.45%) key. The low
Table 3. Identification accuracy down to the order level based upon the participants age.
The age of the participants could influence the identification accuracy due to the participants reading level, and prior exposure to the identification process. The similarities between the Seneca Park Zoo identification accuracy and that of the World of Inquiry School 58 identification accuracy may be due to the participants being similar in age range (<11), and having very little or no prior experience. The youngest participants (age <11) had a higher accurately on the Izaac Walton guide than that of the E-vertebrate Field Guide (Table 3). The participants that ranged from <11-18 seemed to have the highest misidentification using both identification methods. The age ranges of <11-18 seemed to have the highest inaccuracy with the E-vertebrate Field Guide and only half of the participants correctly identified the specimen using the Izaac Walton guide. Most of the participants (25) that were surveyed were in the age range of 18-24. The 2012 Field Skills and Field Biology class comprised of mainly 18-24 year olds and may account for the skew in the age of those surveyed. A greater percentage of
participants in the age range of 18-24 had correctly identified their unknown specimens using the Izaac Walton guide, the E-vertebrate Field Guide, and both methods than misidentifying their specimens. Participants within the age range of 24-34 had the highest overall accuracy with 100% and 60% of the participants correctly identifying their specimen using the Izaac Walton guide and the E-vertebrate Field Guide respectfully. The oldest and least surveyed age range was 35-50 years old. All of the participants in the 35-50 age range had correctly identified their specimens using the Izaac Walton sheet, while only half had correctly identified the E-vertebrate Field Guide. The accuracy level generally increased with increased age. The Izaac Walton guide went from 50% of the participants correctly identifying their specimen to 100% as the age of the participants increased.
identified the most was the Caenis sp. (mayfly), which was given to those participants at the RIT Field Skills, World of Inquiry School 58 and the RIT Field Biology class. Out of the eleven participants who identified the Caenis sp. specimen, only three participants from the RIT Field Biology class misidentified it as a stonefly. Caddisflies also appeared to be a difficult specimen to correctly identify. Out of the 28 participants that had a caddisfly as their unknown specimen, a little over half correctly identified it using the E-vertebrate Field Guide (15) or the Izaac Walton key (17). Some of the participants did not even think that the caddisfly was on the Izaac Walton key and wrote their answer as "not on the sheet".
[image:30.612.71.494.461.630.2]The participants were asked what their satisfaction levels were on four categories, photographs/illustrations, wording, navigation/ease of use, and design for both the Izaac Walton key and the vertebrate Field Guide. When comparing the Izaac Walton key to that of the E-vertebrate Field Guide, most participants rated the E-E-vertebrate Field Guide higher than that of the Izaac Walton key (Table 4). The highest ratings for both the E-vertebrate Field Guide and the Izaac Walton key were the navigation/ease of use with 35 and 12 participants respectively rating it as very satisfied, followed closely by the photographs/illustrations with 34 and 11 participants respectively rating it as very satisfied. Both identification methods had participants score the navigation/ease of use as very dissatisfied. The Izaac Walton key also scored very dissatisfied in the illustration and design categories.
Table 4. Levels of satisfaction/dissatisfaction of photographs/illustrations, wording, navigation/ease of use, and design of the E-vertebrate Field Guide and that of the Izaac Walton key from 53 of the participants that were surveyed. Please note that the wording and the navigation column adds up to 52 since a young participant did not navigate the E-vertebrate Field Guide or read the Izaac Walton sheet and thus was not able to accurately assess those categories.
Very
Satisfied Neutral Dissatisfied Very Dissatisfied Satisfied
Photographs E-vertebrate 34 14 4 1 0
Illustrations Izaac Walton 11 16 15 10 1
Wording E-vertebrate 24 15 11 3 0
Izaac Walton 8 20 21 3 0
Navigation E-vertebrate 35 8 8 0 1
Ease of Use Izaac Walton 12 15 15 8 3
Design E-vertebrate 28 14 5 6 0
Izaac Walton 9 14 21 8 1
Discussion
Survey
Overall, people who used the E-vertebrate Field Guide preferred it to the static Izaac Walton key, despite mixed results in the classification accuracy. 100% of those surveyed in the 2011 Environmental Field Skills class and at the Imagine RIT event wrote that they would recommend the E-vertebrate Field Guide. Even participants that preferred the Izaac Walton key would recommend the E-vertebrate Field Guide. While this might suggest some sort of bias in the survey, leading people to support the digital project created by a student, comments and feedback suggest that participants liked the high resolution photographs and the logical tree structure of the digital key.
The participants' confidence ratings and the corresponding accuracy showed mixed results, and some of this confidence may be due to having a "high tech" key, compared to a simple paper key. Most confidence ratings of the E-vertebrate Field Guide are rated equal or higher than those of the Izaac Walton sheet. In only seventeen cases is the Izaac Walton
confidence rating higher than that of the E-vertebrate Field Guide. Out of these seventeen cases, eight correctly identified their specimen.
Throughout the survey activities, the researchers strove to maintain objectivity to avoid influencing the participants' experience with both classification tools, but there are several ways participants could have been influenced. First, how the researchers presented both identification methods, unintentionally emphasizing one method of identification over the other or
unintentionally making the participant expect better results from one method than the other. Second, the sequence of methods the participant used to identify the specimen could also affect their confidence level as well as accuracy. The answer from the first method could influence the participant’s confidence and decisions in the second method, if they assume they correctly
identified the specimen. Third, familiarity with computers or a given classification method could affect the participants’ confidence level. For example, some participants mentioned they liked the “old-fashioned” paper method (Izaac Walton sheet) better since they were more used to it, and would use the E-vertebrate Field Guide as a check to the Izaac Walton sheet. Another participant mentioned that they were unsure that they would identify the specimen correctly since they were bad at working computers.
Therefore, further surveys and analysis should be done to see if and how the E-vertebrate Field Guide does help boost the confidence rates as well as the accuracy in identification
cpmpared to the Izaac Walton sheet. This could include having participants identify different specimens using one method only.
was the best part of the E-vertebrates field guide?“ at the Imagine RIT event stated that it was easy to use or simple. When asked “What was the worst part of the field guide?” the responses stated that the instructions, questions (“repeated question”, “vague questions”, “choices that closely resembled each other”) and pictures (“the pictures don’t necessarily show the given characteristic because they show other characteristics at the same time”) were vague. Some people mentioned their difficulty using the E-vertebrate website with the microscope (using the mouse, and comparing the specimen through the microscope and then the computer photograph).
The survey results of the 2011 Field Skills class and that of Imagine RIT were done during an early stage of development of the E-vertebrate Field Guide, and thus have helped shape it. Such comments as “there needs to be more pictures, especially at the final this is what you have page helped influence the decisions to include the variety of family and genus photos at the end of the order. The second prototype also addressed issues with the management of
photographs by having an option to “zoom” in on a location of the image to better see the details, as well as more photographs on the solution pages. The survey results also helped shape the Seneca Park Zoo, Envirothon, RIT Field Biology, and the most recent (2012) RIT Field Skills surveys. Those revised surveys were geared more towards comparing the two methods of identification (Izaac Walton and the E-vertebrate Field Guide) than that of the 2011 Field Skills and Imagine RIT surveys.
Overall each survey event had a small sample size (2011 RIT Field Skills, 2011 Image RIT, Seneca Park Zoo, 2012 RIT Field Biology, 2012 RIT Field Skills, Envirothon and World of Inquiry School 58 had 8, 39, 16, 10, 13, 5 and 11 respectfully participants). One large unbiased survey event where everyone would use the same method and instructions would have to take place in order to better evaluate the E-vertebrate Field Guide.
It was observed that the specimen the participants were to identify appeared to influence the participants' accuracy. To help address this, the exercise should consider varying the
specimens that the participants had to identify to help determine where people are having problems in the key. For example, at the Seneca Park Zoo, participants were trying to identify a caddisfly but were making the same mistakes due to picking the wrong answer on “Does it have a grasping lower lip?” and the “Does it have segmented (jointed) legs?” couplets. This may be due to the participants not understanding the couplet itself, but it could also be due to participants not being willing to move the specimen under the microscope in order to highlight the feature. Many participants simply left the specimen as it was placed in the dish.
The survey results do suggest that the E-vertebrate Field Guide requires some training and experience in order to be used reliably. Some of this training would entail going over each part of the macroinvertebrate showing its location and what it looks like, leading to less
accuracy of identification of the harder specimens (caddisflies). For example, those individuals surveyed at the 2012 RIT Environmental Field Skills, identified the caddisflies more accurately than those at the Zoo. This could be because those at the 2012 RIT Environmental Field Skills class have been familiarized with the process of identification, and the terminology before by having some training before the survey than those at the Zoo.
The wording seems to be the hardest aspect of the online field guide. Therefore, in the future, focus groups can be formed to assess what terminology would be the most appropriate for the couplets. Due to the difficulty of phrasing couplets to identify a specific feature on the sample, the E-vertebrate Field Guide may not be best suited for those under the age of 11 or those without a basic background in water quality sampling. Some of the participants that were surveyed were under the age of 11 and needed to be helped/coached through the exercise.
Distribution Map
The distribution map (Figures 6 and 7) was part of a collaborative project with a computing masters student. Server space has been made at RIT to host the map and was
formatted for the ArcGIS server. Progress is being made on formatting the different states water biomonitoring unit data into one easy format/table (NY, PA and NJ each have different aspects of water quality they report on as well as have that data in different formats). The computing student is also working on creating a way to view some of this data via a time series chart. This will help scientists visualize the changes of the macroinvertebrate community, at a well studied location over time.
A map has been made with the data that can be easily imported into ArcMap from various sources on a basemap provided by ArcGIS (Table 1). This map incorporates data that could affect water quality (impervious surfaces, land use/cover, toxic release reports), water data (gauging stations, national hydrology dataset) and a local study done annually by an RIT class. This shows that different information can be shown spatially and temporally in order to facilitate studies on water quality and what may or may not be affecting it.
Future versions of this project may help better link the E-vertebrate Field Guide and the map. This can be done by making the E-vertebrate Field Guide prompt the user to enter the abundance of the specimen at each solution and track those specimens and abundances as you continue to identify them and add them automatically into the form that the user would fill out which would be uploaded into the map.
and thus should be added to the map. This way one can see how the land use/cover has changed over time and be able to compare it to the water quality or macroinvertebrate community.
Overall this application would allow the scientists to put their data into context to see if they are getting results similar to other groups (that they see as a reliable source), share their findings in real time with others across state lines, give the scientists the raw data of not only their water quality analysis but also the tallies of the invertebrates counted, their field notes, and water chemistry that the scientist had observed. This application will also help in showing the general trends of the population at that site over the years. Overall, the distribution map would generate a large scale database of work that has been done over time.
Conclusion
Macrobenthic invertebrates are important indicators of water pollution in many differing water systems, but accurately identifying these organisms is a challenge due to insufficient funding and a dwindling pool of training personnel. Digital classification keys that help guide users to the correct identification of specimens are promising technological bridges, but at this point they still require a basic sampling and classification background or training. The results of this project indicate that citizen scientists would use them (and prefer them) and accurately identify specimens with training. So this could become a valuable tool for citizen scientist monitoring teams.
Tools that citizen scientists and all groups can use to view and exchange data will also help eliminate information gaps and disseminate information across boundaries (state borders, between different institutions such as schools and governments, etc). Such tools can include an interactive online map that displays every group's data, contact information or other relevant resources to that study, which can be edited from anywhere for the user as long as it is their information. Development of an interactive mapping application that can link to the E-vertebrate Field Guide more effectively would be an excellent project for future students.
Overall this project can be classified as a success. It was successful in terms of getting a start on bringing the water quality analysis/taxonomic field guides up to date with technological advances. During the course of this research, various people (including the DEC) indicated that they were looking for a product like the E-vertebrate Field Guide but couldn't find one, or that they wanted to make a tool but didn't know how to or have the funding. This not only shows that there is a need for the product but people who would want to see it succeed and would want to further the tools.
specimen, a glossary of terms that the user may not be familiar with, some quick facts about the specimen they have identified, and a “I don’t know” button should be added to the field guide that would result in another couplet that would get you to the same answer. There should also be a checklist page which would display the specimens that can be identified using the E-vertebrate Field Guide. The one downfall is that someone may try to identify a common macroinvertebrate which is not in the field guide and thus misidentify it entirely, assuming that it would be in the field guide. One major improvement may be the need to make a training module for the E-vertebrate Field Guide. The training module would tell the user what each part of each
macroinvertebrate is named and where it is located. This will help the user understand where to look and help the user understand the terminology behind the couplet (i.e. jointed or segmented). This module could have photographs of a "known" specimen that the user would have to try to identify using the E-vertebrate Field Guide. If the user were to chose a wrong answer, the training module would tell the user it was a wrong answer and why. This training module could be made mandatory before the user could move on to identify their unknown macroinvertebrates
This tool can also be used as a teaching aide in schools. Teachers can use this website to teach their students how to identify macroinvertebrates, and how to use a field guide or
Appendix A Guide to Photographing Macroinvertebrates
Guide to Photographing Macroinvertebrates
There are many different ways to photograph the macroinvertebrates. In this manual two methods will be described. Each method has its own advantages and disadvantages.
Images to be produced
[image:36.612.134.480.224.465.2]
Figure 2. Gilled snail solution image at a 900x300 pixel size with a scale bar of the magnification which was made from the ruler image taken at the same magnification as the lunged snail photographs.
There are two types of end results, a couplet image and a solution image (Figure 1, Figure 2). A couplet image is an image highlighting a specific detail (or lack thereof) of the specimens in question (question posed to the user). The couplet images are sized at 600 pixels high. A solution image will be what the user should see at the end of all the couplets. This image will be a combination of the top and bottom view of the specimen, giving the user a confirmation of what they have identified. The size of the solution image should be 900 pixels by 300 pixels. The solution images should be shot on a black or white background.
Backgrounds
The colors white, black, and gray were used. White was used to make the images more incorporated into the website by creating a seamless flow from the website to the image. If the specimen is also dark or black then white as a background is a good way of making sure that none of the specimens' features are lost in the background. A white paper can be used to create this white background.
Black was used in order to bring out all the qualities of the specimen. The color black should be used if the specimen has see-thru qualities. Black velvet is recommended to use for a
seamless black background.
Dissecting Microscope
Figure 3. Macrophotography setup consisting of the fiber optic light, dissecting microscope, camera mount, camera, microscope slides to use as a stage, petri dish, and a gray card.
Equipment
• Dissecting scope that has a tube for the camera to go onto • Camera
• Camera mount • Fiber optic light • Petri dish
Advantages
• You don’t have to switch lens/move the bellows to change the magnification of the specimen.
• You can only magnify the specimen to a certain extent based upon the working distance between the specimen and the dissecting microscope.
• You will have to change the “f-stop” through the microscope controls which is arbitrary. (It does not tell you what it corresponds to).
Directions
1. Attach the camera to the microscope using the camera mount. (If you want to work tethered attach the camera to the computer).
2. Pick your respectable background (either white, grey or black) from the stage of the microscope.
3. Put alcohol and your specimen into the petri dish. Make sure that the alcohol is completely covering the specimen.
4. Put the petri dish on your stage.
5. Plug in and try to position the fiber optic lights so the light is oblique giving the object more of a realistic view. These lights are to make sure you get the top of the specimen and any under exposed areas of the specimen lit. You may have to move the lights around quite a bit to get the right lighting. However, once you get the right lighting do not move them afterwards,
otherwise you will not have consistent images in the couplets/solution images. 6. For the background use the microscopes light to evenly illuminate the
background and use as a key light to bring out the details of the specimen. Make sure that this lighting is consistent with your oblique lighting (make sure your sample does not have a “glowing” look).
7. Photograph using the appropriate camera settings. In addition to shooting though the camera you can shoot tethered to a computer. It is recommended that you take multiple images at different depths either starting at the top of the specimen or the bottom or working your way to the opposite direction. 8. After photographing the specimen, photograph a ruler at that same
Macro Setup
Figure 4. Macrophotography setup consisting of the fiber optic light, lab jack, 100mm macro lens, 2 extension tubes, gray card, petri dish, piece of glass, camera, and a copy stand.
Equipment
• Camera
• Piece of paper/black velvet • Fiber optic light
• Petri dish • Lab Jack • Piece of Glass • Copy Stand • Macro Lens • Extension Tubes • Bellows
• Thimble lens
• By varying the lens (how many extension tubes you use), as well as the length of the bellows, there isn’t as big as a limitation of how much or how little you can magnify the object.
• Depending on the setup you can vary the f-stop.
Disadvantages
Even though this setup is variable, it leaves room for problems as well. With increased magnification you lose lighting and thus have to increase the exposure time. This may cause your images to be blurry due to vibration (anything in the room can make your specimen move, causing it to be blurry). Therefore you will have to use a fiber optic flash instead of just the fiber optic lights. This may be a disadvantage since fiber optic flashs are hard to come by and do not have a lot of settings to vary the power of the lights. Therefore the setup becomes more complicated in respect to lighting.
Directions
1. Locate a vertical camera stand in a convenient and easily accessible area to work with (if working tethered near a computer). It is important to make it comfortable for you to work with, otherwise your back may hurt from craning over or reaching up to look through the camera.
2. Put the background (gray card, white piece of paper, black velvet) on the copy stand
3. Secure the piece of glass to the lab jack with lots of tape. 4. Put the lab jack/piece of glass ensemble on the background. 5. Put the petri glass on the piece of glass.
6. Attach your lens/bellows to the camera. 7. Attach the camera to the copy stand.
8. Plug in and try to position the fiber optic lights so the light is oblique, giving the object more of a realistic view. You may have to move the lights around quite a bit to get the right lighting. However, once you get the right lighting don’t move them, otherwise you will not have consistent images in the couplets/solution images. You may need to use this light to help see through the camera in the next few steps.
9. Using the empty petri dish, find your field of view and make sure that you can easily move the camera around to change your field of view of the petri dish. 10.Put your specimen into the petri dish.
12.Photograph using the appropriate camera settings. You can photograph the specimen either tethered or through the camera. It is recommended that you take multiple images at different depths either starting at the top of the specimen or the bottom or working your way to the opposite direction. 13.After photographing the specimen photograph a ruler at that same
magnification.
Tips in Photographing
1. Over time you may want to change out the alcohol to remove any dust that may have fallen into the alcohol, which may interfere or attach to your specimen.
2. You can break a microscope slide into pieces to help flatten your specimen or use it to pin down specific parts of it (legs, head etc).
3. You can use a paintbrush to brush away dirt/debris that may have been attached to your specimen.
Photographic Revisions
1. Take the images and load them into Adobe Photoshop ® or another image processing program. Synchronize them so that all their black and white points are the same.
2. Save the images in a .tiff file format.
3. Use the .tiffs and load them into a stacking software (Zerene stacker is recommended-if using zerene stacker use the PMax setting to stack the images).
4. After the images are stacked, edit them appropriately in the stacking software if you can (to rid of spotting that may be on the sensor).
5. Edit the images, making sure that both images for the couplets/solutions are similar. Save the images as .jpeg with the height of 600 pixels.
6. Upload these images to the evertebrate administration website.
Solutions
The E-vertebrate Field Guide currently consists of 17 order, 24 family, and 17 genus solu