City, University of London Institutional Repository
Citation
:
Shi, X., Bigdeli, A. Z. and Li, F. (2016). An examination of NPD models in the context of business models. Journal of Business Research, 69(7), pp. 2541-2550. doi: 10.1016/j.jbusres.2015.10.087This is the accepted version of the paper.
This version of the publication may differ from the final published
version.
Permanent repository link: http://openaccess.city.ac.uk/13877/
Link to published version
:
http://dx.doi.org/10.1016/j.jbusres.2015.10.087Copyright and reuse:
City Research Online aims to make research
outputs of City, University of London available to a wider audience.
Copyright and Moral Rights remain with the author(s) and/or copyright
holders. URLs from City Research Online may be freely distributed and
linked to.
An examination of NPD models in the context of
business models
Xiaohui Shi
1,2, Feng Li
3, and Ali Ziaee Bigdeli
4
1 Portsmouth Business School, University of Portsmouth, Portland Street, Portsmouth PO1 3DE, UK.
[email protected] 2 Corresponding author.
An examination of NPD models in the context of
business models
Abstract:
Most prior new product diffusion (NPD) models do not specifically consider the role of the
business model in the process. However, the context of NPD in today’s market has been changed
dramatically by the introduction of new business models. Through reinterpretation and extension,
this paper empirically examines the feasibility of applying Bass-type NPD models to products
that are commercialized by different business models. More specifically, the results and analysis
of this study consider the subscription business model for service products, the freemium
business model for digital products, and a pre-paid and post-paid business model that is widely
used by mobile network providers. The paper offers new insights derived from implementing the
models in real-life cases. It also highlights three themes for future research.
An examination of NPD models in the context of
business models
1.
INTRODUCTION
The process of bringing new products to market is a key area in business research and
practice (Hauser, Tellis and Griffin 2006). At an aggregated level, the market performance of a
new product usually follows a bell-shaped curve that will finally decay due to the saturation of
market potential (Geroski 2000). Following this notion, scholars have built on and extended the
Bass model (Bass 1969) to explore many NPD issues of interest, as summarized by Mahajan,
Muller and Wind (2000), Meade and Islam (2006), and Peres, Muller and Mahajan (2010).
However, a new product’s commercial potential is not guaranteed, because the market
performance of a new product is complex, multifaceted, and exposed to a wide range of
influences (Mahajan et al. 2000). In particular, the strategy and e-business literatures have
recognized the significant role of business models in connecting a new product’s potential with
the realization of its commercial value (Li 2007; Amit and Zott 2012), since business models
determine the rationale of how firms generate profit from the new product. More specifically,
business models that target different customer segments through different channels with different
monetization strategies would inevitably influence the market performance of new products.
Therefore, as one of the key elements that define the context of NPD, the role of business models
should not be neglected.
For instance, two significant changes have affected the business models in a wide range of
Firstly, while the existing NPD literature predominantly focuses on durable goods (Barczak
2012), the world economy has shifted from one based on goods to one that is increasingly
service-oriented (Eichengreen and Gupta 2013). Even for durable goods, many firms
increasingly sell temporary or periodic access to a product rather than selling it for one-time
revenue, in order to generate recurring profit and build brand loyalty (Rust and Chung 2006).
Examples include Internet/telephone/mobile network providers, software/music/movie industries,
business consulting firms, and rental services for various durable goods such as cars and laptops.
Even aircraft engines nowadays can be paid for based on the flying miles, or purchased as a
service from General Electric or Rolls-Royce.
Secondly, it is now common practice for firms to offer customers multiple options to
access their product, in order to satisfy different customers’ needs and maximize market potential.
Adoption options can be differentiated via product features, distribution channels, payment
methods, and price. For instance, the freemium business model offers a free version of a product
as well as a premium version with advanced features. Mobile network providers usually provide
customers with pre-paid and post-paid services. More notably, the issue of cannibalization
between online and off-line sales has been emphasized by a number of scholars, such as
Deleersnyder, Geyskens, Gielens and Dekimpe (2002) and Biyalogorsky and Naik (2003). In
such business models, adoption options for a single product are likely to influence each other’s
market performance and the market performance of the product as a whole.
Since ever-fewer firms rely on the traditional retail model to sell products through a single
channel, NPD studies should evolve in order to match the shift of the NPD context from
traditional business models to the new models. However, little effort has been dedicated to align
prior Bass-type NPD models, in order to apply them to service products with multiple adoption
options which allow customers to adopt different versions of the products with different payment
methods and amounts. By explicitly setting the model parameters according to the attributes of
the studied cases, this paper seeks to explore the feasibility of explaining, assessing, and
predicting the market growth of new products in the contexts of three business models:
subscription, freemium, and pre-paid and post-paid.
Three cases are employed for the empirical analysis. The first case is a service product that
employs a subscription business model. Service providers often differentiate their products in
regard to technological advances in order to satisfy different customers’ needs. The studied
product here has evolved through multiple generations that can be selectively adopted by
customers. The second case is a typical example of the freemium business model, which offers
free and premium versions of the product to target different customers. The final case is a mobile
network service, which provides post-paid and pre-paid options for customers. The primary
objective of the empirical analysis is to examine the performance of the Bass-type models in
terms of model fit and forecasting. More specifically, this paper assesses whether the extended
Bass-type model is capable of providing accurate description, prediction, and corresponding
analysis to NPD cases under the business models of interest. The suggested model and its results
also provide useful implications for those who are not familiar with modelling techniques. For
instance, this study demonstrates the importance of the distinction between adoption options and
customers’ dis-adoption behaviors in the process of NPD, and encourages future research to
further study the impact of these factors on NPD.
The remainder of the paper is structured as follows. Section 2 reviews the related literature.
models employed in the empirical analysis. After the employed cases are presented in Section 4,
Section 5 offers empirical analysis of the model’s performance. Finally, Section 6 concludes this
study.
2.
LITERATURE REVIEW OF BASS-TYPE NPD MODELS
Most prior research using diffusion models has been based on the model framework
developed by Bass (1969). The Bass model employs two main drivers for modelling the rate of
diffusion. One driver is constant through time, which is mostly explained as the innovation effect
or the mass media effect. The other driver is dynamic, subject to the number of existing product
users, and can be referred to as the imitation effect, the word-of-mouth effect, the social
conformity effect, or the network effect (Robinson and Lakhani 1975; Ansari, Fiss and Zajac
2010). The discrete analogue of the Bass model can be written in the following form:
(1) ( ) (
)
where is the coefficient for innovation; is the coefficient for imitation; is the market
potential of the product; is the market growth at time ; and indexes the
cumulative number of users.
Although the Bass model was developed for the aggregated market growth of a product
category, it serves as the conceptual foundation for many subsequent NPD models. One
significant development is the introduction of the marketing-mix variables – price and
advertisement. In particular, the generalized Bass model (Bass, Krishnan and Jain 1994) reliably
captures the influence of price and advertising on market growth. The model can be explained in
respectively, of the product; and are the corresponding coefficients for the influences of
price and advertisement on the market growth.
(2) ( ) (
) ( )
Although a product can have a monopoly in the market at the beginning, it may quickly
attract competing brands.The main body of the literature suggests a Bass-type model for the
competitive NPDphenomena (Peres et al. 2010), stating that the market growth of each brand is
driven by its respective mass media effect, and by the combination of within-brand and
cross-brand influences. A generalized form of those models can be explained by either of the two
equations below, the difference between which is whether the brands’ market potentials overlap
(Equation 3) or not (Equation 4).
(3) ( ∑
) ( )
(4)
( ∑
) ( )
In Equations (3) and (4), ( ) is the cumulative number of users of brand at time ;
and are the corresponding coefficients for the innovation and imitation effects for brand of
its own within-brand influence; and more importantly, is introduced to explain the
cross-brand influence of cross-brand on the market growth rate of brand . Parameter is assumed and
analysed differently in the existing literature. For instance, some studies (e.g. Savin and
Terwiesch (2005)) consider is unique between any two brands; some studies (e.g. Krishnan,
( ); and some studies (e.g. Libai, Muller and Peres (2009)) argue that the cross-brand
imitation effect is not important and can be ignored ( ). Furthermore, the reported value of
parameter can be positive, negative, or zero in different cases, indicating that brand
competition can speed up, delay, or have no impact on the market performance of each brand
(Chatterjee, Eliashberg and Rao 2000). It should be noted that those Bass-type NPD models that
study cross-country influence (e.g. Albuquerque, Bronnenberg and Corbett (2007)) and the
legal-piracy relationship (e.g. Givon, Mahajan and Muller (1995)) usually have a similar format to
equations (3) and (4).
In addition to the above, Bass-type NPD models have been used for a wide range of other
topics related to new product growth. Examples abound. For instance, Norton and Bass (1987)
and Mahajan and Muller (1996) extend the Bass model in distinct ways for multigenerational
products; Chung (2011) studies online buzz activities using the Bass model framework; by
differentiating product users into imitators and influencers. To conclude, our literature review
ascertains that Bass-type models are the most cited and used models to understand and predict
the market dynamics of new products. Therefore, this research extends the original Bass model
with new variables to examine its ability to explain market growth of new products under certain
business models, and its ability to forecast how the market will evolve. It is expected that this
study could further extend the applications of Bass-type NPD models, and offer insights that
have not been captured by prior studies.
3.
AN EXTENDED BASS-TYPE MODEL
Time is discrete and indexed by . Consider a product that is new and monopolistic in the
feature, functionality, payment method, payment amount, distribution channel, etc. The market
growth of each adoption option is driven by the innovation and imitation effects as suggested by
the Bass framework. In particular, different adoption options could be either competitors or
complementors, influencing the market performance of each other. In addition, the respective
price and advertisement of different adoption options could further influence the market
dynamics of the product.
---
INSERT TABLE 1 HERE
---
Let be the number of new users of the adoption option. Based on equations (1), (2),
(3), and (4), the paper proposes an extended Bass-type model for the given context. The discrete
time form of the suggested model can be explained in equations (5) and (6), and the difference
between the two is whether the adoption options of the product share an overall market potential
(i.e. Equation 5) or not (i.e. Equation 6).
(5) ( ∑
) (
) ( ∑ )
(6) ( ∑
) (
) ( )
In equations (5) and (6), indexes the unit in use for the adoption option of the
product, thus ( ). The variables and indicate the dynamic market
potential of the overall product and each adoption option ( ∑ ). Hence, (
option, when the market potential of different adoption options overlaps and does not overlap,
respectively.
In the above model, ( ∑ ) and ( ∑
) index the growth rate
of the adoption option in the respective scenarios, where and are the coefficients for
innovation effect and imitation effect, respectively. In particular, ( ) represents the
coefficient for the inter-influence of the adoption option on the adoption option. The new
model implies that the inter-influence between adoption options of a product could follow a
similar pattern to the inter-influence between different brands of a product. Note that the value of
( ) can be positive, negative, or zero in real practice, indicating that the adoption options
could have positive, negative, or no impact on each other’s market performance. Function
(
)in equations (5) and (6) is derived from the generalized Bass model (Bass et al.
1994) to explain the influence of price on the market performance of the corresponding adoption
options. And finally, this study introduces as the churn rate. Note that when ( )
, the inter-influence between adoption options, the influence of price on market growth
and users’ dis-adoption behaviours are excluded, then the suggested model reduces to the
original Bass model.
Although Bass-type models have often been used for service products, the existing
literature has not reached a conclusion on modelling churn rate (i.e. ) in the NPD process. In
some simple cases, a constant can be used, which means users of the product have a relatively
stable life-cycle. In the extreme case, indicates that once users have adopted the product,
other cases, the churn rate could relate to the growth rate of the product. That is, the more users
actively use the product, the fewer the number of users who dis-adopt. And more complicatedly,
the churn rate may be decided by a combination of the above and other factors. For instance,
Libai et al. (2009) use a constant for users who dis-adopt the product category permanently and
models the switch rate between competing brands according to the relative number of users for
each brand.
Furthermore, this study considers and as variables rather than constants in
equations (5) and (6), since the ceiling on the number of users of a product is usually dynamic in
real cases. For instance, Mahajan and Peterson (1978) report the influence of demographic
factors on the market potential; multigenerational diffusion studies (e.g. Norton and Bass (1987))
often consider that the market potential of a later generation is related to the dynamic user base
of its predecessor due to user upgrading. Kim, Chang and Shocker (2000) also find that the
market potential of a product category could be influenced by the market growth of related
product categories. To cover each of these possibilities, the empirical analysis will consider and
model the churn rate and the dynamic market potential in various scenarios.
4.
DATA
This paper employs three cases for the analysis. The first case concerns radio and TV
licensing in the UK. Every British household needs to pay for a TV license on a yearly, quarterly
or monthly basis in order to watch and record live television transmissions. The origin of this
practice goes back to 1922, when BBC was established for radio broadcasts. The black and white
service, and the color television license was introduced in 1968, following the commencement of
BBC color transmissions.
The second case is an instant messaging (IM) service, which was released in 1998 by
Tencent Holdings Ltd. As the product is tailored for the regional culture, it has a de facto
monopoly in the regional market. The IM service is commercialized through a classical
freemium business model: it can be used for free, but it charges for value-added services that
enhance user experience. Those Internet-based value-added services (IVAS), including club
membership, avatar, personal spaces and communities, online music and dating services, can
give premium users advantages in the virtual community and are the source of most of the firm’s
profit.
The last case is a mobile network service. The studied network provider is owned by the
state government. Due to the best network coverage in the country and substantial protection
from the government, it has a dominant role in the regional market. The business model of the
network provider has evolved during the studied time period: it only offered post-paid service in
the early years. Then it introduced pre-paid service (also known as pay as you go) in 2000.
Compared with post-paid service, the pre-paid service has less obligation and lower cost for
low-usage patterns, but it could be limited in certain aspects (e.g. no roaming service) and more
expensive for heavy usage patterns.
---
INSERT TABLE 2 HERE
---
---
---
This study gathers all the available market growth data from the corresponding companies’
interim and annual reports (see Table 2). This study also obtains the price/revenue data for the
three cases in the corresponding time periods, which can be seen in Figure 1.
5.
EMPIRICAL APPLICATIONS
5.1.Model and Parameter Setting
By considering adoption options, price effect, and customer dis-adoption, the extended
Bass-type model takes the business models of the three cases into consideration (see Table 3).
First, all three cases offer multiple adoption options, which are set by the business models.
However, the underlying relationships between the adoption options differ. In the case of the
radio/TV license, the three adoption options are substitutional in nature and do not involve direct
competition (i.e. color TV is significantly more advanced than b/w TV and radio, so they tend to
target different market niches). Therefore, the model parameters for this case are set according to
the notion of the classical multigenerational NPD model of Norton and Bass (1987). More
specifically, the subscribers of one generation become the potential users of the following
generation, and the model excludes the competition effect between adoption options (i.e.
( ) ).
In the remaining two cases, the adoption options for each product have similar functions,
so they are essentially market competitors. For simplicity, in the case of the IM service, this
paper assumes that the free version and the premium version receive the same level of influence
influenced equally by free and premium users, as they contribute equally to the network effect;
while , because potential premium users can easily observe the advanced utility of the
premium version, therefore receiving further influence from premium users. For the mobile
network subscription, the model uses similar settings with the IM service, with the difference of
and , under the assumption that the post-paid and pre-paid subscribers
contribute equally to the network effect.
Second, the payment methods and payment amounts differ between the adoption options
for each product when different business models are used. In the first case, the adjusted
subscription fee for each generation of the license is relatively stable through time (see Figure 1),
hence the price influence can be excluded. In the case of the IM service, customers can access
the product for free but they will have to pay if they want to become premium users. However,
the price effect is also not considered here, since the price of virtual goods is relatively stable
during the studied time period, although the purchasing power of premium users has been
increasing. In the last case, the price effect is triggered for post-paid service, as its adoption cost
changed significantly during the studied time period.
Third, all three cases uses a service-based offering, which makes customer churn an
important element of their business models. In the case of the radio/TV license, the main driver
of customer dis-adoption is generational upgrade. Therefore, the effect of customer churn has
already been considered above, in the substitutional relationship between adoption options. In the
case of the IM service, this study assumes that the churn rate is positively related to the adoption
rate, and users who dis-adopt the service become potential users again since the service provider
behavior is available, therefore, this study considers that users do not dis-adopt during the period
of study due to the monopoly and significant role of the product.
Last but not least, the UK population increased nearly 40% during the studied time period
of the first case, so the change in the market potential cannot be ignored in the analysis. This
study uses the UK population as the indicator of the market potential for simplicity. More
specifically, the UK population size in 2011 and in 1931 are62,110,000 and 46,040,000. This
paper assumes that the UK population grows steadily during the 80 years, so the average yearly
population growth rate is: √ ⁄ . In the other two cases, the
population is relatively stable during the studied time period, so .
---
INSERT TABLE 3 HERE
---
More details of the model and parameter settings can be found in Table 3. The above
assumptions were carefully made according to the context of each case. Moreover, those
assumptions shall be validated by model fit, as otherwise it should be difficult to obtain
reasonable fit to the observed data when the simplified models are applied.
5.2.Parameter Estimation Technique
The proposed model is estimated based on all available data. For the first case, this study
estimates the parameters with the actual data sets by minimizing function (7), where is the
observed market data and ( ) is the corresponding data estimated by the model. For the other
two cases, the data on different adoption options have different levels of scale that need to be
data during the studied period. The parameters to be estimated during the model implementation
are , , , η, as well as the market potential of each adoption option at time (i.e. ). Here
modelers can estimate directly. Or they can estimate the total market potential and the
proportion of the adoption options. The two approaches should not influence the accuracy of the
results.
(7) ∑ ∑( ( ) )
(8) ∑ ∑ ( ( )
̅ )
The paper introduces a genetic algorithm for the estimation results, as it has a higher
probability of reaching the global optimum solution when the targeted model is inherently
nonlinear and contains a large number of parameters (Del Moral and Miclo 2001). The
application of this technique for NPD models has been examined by Venkatesan, Krishnan and
Kumar (2004). The study uses the genetic algorithm package in MatLab. The population size of
the estimation is set as 200 (200 sample solution vectors are generated for each iteration). The
probability of crossover and mutation is set at the software’s default value. The stopping rule for
estimation is as follows: terminate if there is no improvement (less than 1E-12) in the objective
function for 100 consecutive generations. Also this study runs the estimation for each model of
each case 100 times repeatedly in order to further reduce the possibility of local optima and
provide a validity check. The reported values in this study are the best fit and the standard
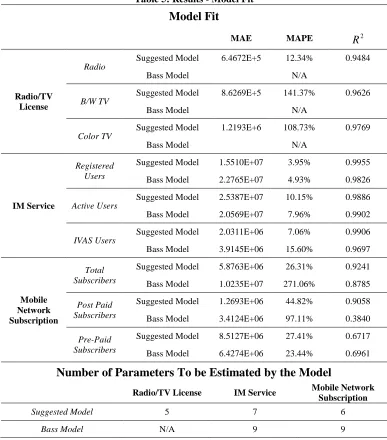
5.3.Results and Discussion – Model Fit
The paper reports the estimated parameters in Table 4 and the result of model fit in Table 5
and Figure 2. The reported results of the suggested model are based on Equation (6) (i.e.
adoption options have respective market potentials), as they fit the observed data better than
Equation (5) (i.e. the model with shared market potential). In the case of the UK radio/TV
license, Equation (6) is preferred because the relationship between the adoptions options is
substitution rather than competition, hence the earlier generations have little advantage in
accessing potential customers of the newer ones. In the cases of the IM service and the mobile
network service, perhaps the better fit of Equation (6) is due to the adoption options being
appropriately defined to target different market niches: the free users of the IM service simply
use the service as a communication tool, while the premium users are those hard-core users who
are happy to spend money for additional functions; the post-paid subscribers of the mobile
network were mostly businesspeople at the beginning and later included other types of heavy
users, while the pre-paid version targets price-sensitive users.
---
INSERT TABLE 4 HERE
---
---
INSERT TABLE 5 HERE
---
---
INSERT FIGURE 2 HERE
The current study uses mean absolute error (MAE), mean absolute percentage error
(MAPE), and R-squared ( ) as the measures of descriptive performance. It also introduces the
original Bass model to fit the curves and report the results as a benchmark (also see Table 5).
The following paragraphs summarize the key findings.
First, the suggested model performs well in general, both graphically and statistically. As
can be seen in Figure 2, the proposed model is capable of explaining all the product growth
trends as well as the important turning points. The good fit between the observed and estimated
market data also validates the assumptions in the parameter settings. However, the model
underestimates the growth of color TV license in the last few years, partially because some
concessionary factors (e.g. discounts for disabled and senior citizens) introduced during that
period are not considered. The model also fails to capture the initial stage of the curves for b/w
TV and color TV, resulting in a large MAPE value. This may be because the model does not
employ a specific focus on the take-off stage in NPD (Golder and Tellis 1997).
Second, the original Bass model is not functional in the case of UK radio/TV license. This
is because the Bass model does not include a function for customer dis-adoption, hence it cannot
explain why the number of users decreases after a certain time. In the other two cases, the
suggested model outperforms the original Bass model. It is important to note that the suggested
model’s superior performance is not due to the increased model parameters, but rather to the
consideration of the NPD context as defined by the business model. In fact, as three estimated
parameters are required for each data set of each case, the Bass model requires nine parameters
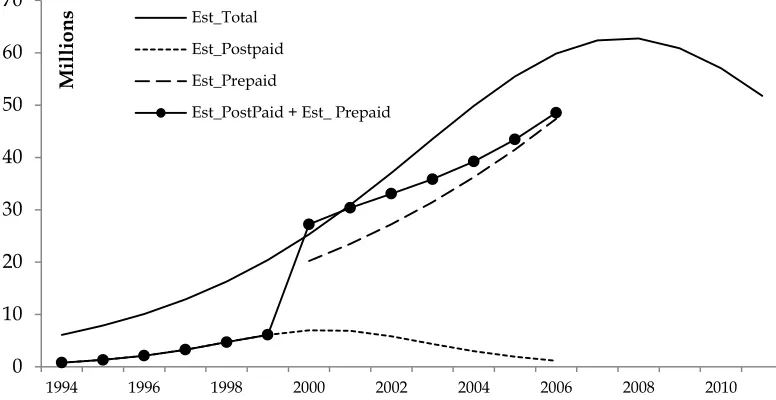
Third, as a homogeneous model for category-level products, the original Bass model has to
consider each adoption option as a separate and independent NPD process in order to fit its
growth trend. Therefore, its results are in fact problematic. For instance, Figure 3 shows the
estimated curves of the Bass model for the mobile network case. Ideally, the sum of the pre-paid
and post-paid subscriptions should match the overall subscription number. However here the
sum of the two estimated adoption options (i.e. the solid line with round marks in Figure 3) does
not match the estimated overall subscription (i.e. the solid line in Figure 3) – a result that
contradicts itself.
---
INSERT FIGURE 3 HERE
---
Last but not least, the reported parameters of the suggested model can provide some useful
insights, which are absent from the results of the Bass model. The reported value of in the case
of the IM service suggests a negative relationship between the product growth rate and customers’
dis-adoption rate; in order words, the popularity of the product plays a significant role not only in
attracting new customers, but also in retaining existing users. This finding can be further
evidenced by the increasingly slower growth rate of the observed inactive users relative to the
observed active users (see Figure 1). The reported value of parameter in the mobile network
case endorses the price effect as a key factor in the fluctuations of the market dynamics. In
addition, the paper finds a significant difference between the influence exerted by free and
premium users on the premium market in the case of the IM service ( and
), indicating that the product’s premium version is promoted more by premium users than
not only the main source of profit, but also the key driving force of the new profit source. Also in
the case of the mobile network subscription, the reported parameter values of and differ
significantly (0.5096 and 6.4246), which indicates that post-paid subscribers are more vulnerable
to the network effect than are pre-paid subscribers. The finding also explains why the post-paid
subscription reached market saturation in a relatively early stage.
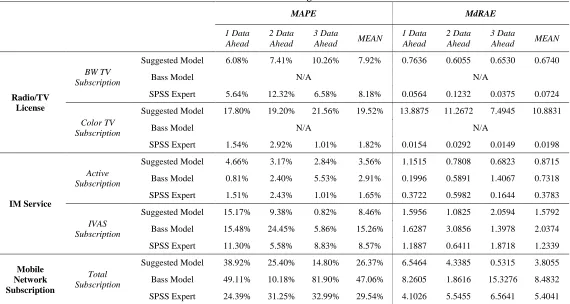
5.4.Results and Discussion – Forecasting
One key benefit of diffusion models is to predict market size and growth (Tsai 2013; Qian
and Soopramanien 2014). This study follows the approach of Decker and Gnibba-Yukawa (2010)
to report the model’s forecasting performance: each data set is divided into the calibration period
and the forecasting period, then the data in the calibration periods are used to estimate the model
parameters in order to predict the data in the forecasting periods. Note that the analysis of the
first case only uses the data points before 1987, because the data between 1987 and 1996 are not
available and the results could be skewed by the neglecting of concessionary factors in the last
few years, as discussed earlier in the analysis of model fit. The other two cases employ all
available data points for the forecasting analysis.
The study predicts the last one, two, and three data points and compares with the observed
data (see Table 6). In addition to the measure of MAPE, the paper reports the results with median
relative absolute error (MdRAE), as it is recommended by Armstrong and Collopy (1992) for
forecasting studies. The reported MAPE results in most cases are under 20%. However, the
results also report higher MAPE in several cases; for instance, in one data
point forecasting the total subscription number in the mobile network case, which indicates a
---
INSERT TABLE 6 HERE
---
The study introduces two benchmarks for the comparative results, the original Bass model
and the IBM SPSS Expert Modeler (the software package automatically determines the
best-fitting ARIMA or exponential smoothing model for the given time-series data), as they are two
of the most widely used forecasting techniques for NPD in theory and practice. Table 6 reports
the results of the comparison. Unsurprisingly, the suggested model outperforms the Bass model,
especially when the forecasting period is long. In particular, the Bass model fails to fit and
therefore predict the case of UK radio/TV license, due to its lack of consideration for customer
dis-adoption; it also fails to predict the turning point in the case of mobile network service.
Again, note that the superior performance of the suggested model is not due to the increased
model parameters.
The SPSS Expert Modeler, on the other hand, provides some unexpected yet interesting
findings. When the studied curve is smooth with few fluctuations in the forecasting period (such
as the case of UK radio/TV license), the SPSS Expert Modeler, although simple, can produce
more reliable results than the Bass model and the suggested model. However, when the
forecasting period starts to have unexpected fluctuations (e.g. in the case of IM service), the
performance of the SPSS Expert Modelers and those of the Bass-type NPD models quickly
approach. Once the smoothness of the forecast NPD curve reduces to a certain level, especially
when the turning point is included in the forecast period, the SPSS Expert Modeler loses its
value. In fact, by utilizing the growth pattern of post-paid and pre-paid subscription data, the
suggested model is the only one among the three that can predict the turning point in the case of
forecasting model should reflect the reality of the market. Such ability is absent in the simple
estimation tools and techniques, including the SPSS Expert Modeler, but is present in the
suggested model of this study.
6.
CONCLUDING REMARKS
This study reinterprets and extends prior Bass-type NPD models according to the context
of certain business models and examines their validity by using real-life cases. For marketing
researchers, this study extends the application of NPD models in today’ business context, and it
opens a new channel for understanding the relationship between NPD and business models. For
marketing practitioners, this study examines Bass-type NPD models as an explanation and
forecasting tool for the contexts of today’s NPD phenomena, which can be used for market
planning and related purposes.
6.1.Implications
This paper takes the lead in exploring the capability of Bass-type NPD models to explain
and forecast cases in the context of different business models. The empirical results conclude
that it is possible to study NPD in the context of business models through Bass-type NPD models,
when the models and parameters are interpreted and set accordingly. However, the paper also
shows that models could produce contradictory and misleading results in some NPD cases, if
appropriate interpretation of and settings for the underlying business models are absent. An
example was demonstrated in Figure 3 and its corresponding discussions, showing that the
original Bass model and its results for the case can provide little, and even negative, support for
produce cohesive and more accurate results than the original Bass model in the studied NPD
cases.
---
INSERT TABLE 7 HERE
---
This study also provides some interesting implications based on the model estimation (see
Table 7). First, while traditional NPD studies have dedicated little effort to differentiating the
adoption options of a product offering, the suggested model and its results indicate that the
distinction and the inter-influence between the types of adoption option are important, and they
encourage future research to further study the distinction and its significance. Access to such
information based on the suggested model will allow researchers and firms to better understand
the role of each adoption option in the process of NPD. For instance, the results of this study
show that the existing premium users of the IM service play a more important role in driving the
market growth of the premium users than the free users do; the results also show the significant
difference between pre-paid and post-paid users in driving the market growth of the product in
the case of the mobile network service.
Second, this study furthers the understanding of the role of product price in the market
growth of new products. The empirical analysis indicates that the price change of one adoption
option not only calibrates its own market growth, but also influences the product’s other
adoption options through their inter-influence (i.e. ( ) in the suggested model), and hence
changes the overall market dynamics. It is now common practice for firms to offer multiple
adoption options for a product and to set a different price for each option. The suggested model
traditional models. For instance, this study shows how the price change influences the number of
post-paid users as well as the overall market growth in the mobile network service, which cannot
be seen in the previous models.
Third, the adoption options of the studied products tend to target respective market niches,
and they contribute to the overall market growth differently. More specifically, the results of the
radio/TV license case indicate that most service subscribers were in fact triggered by BBC’s
early radio service, and then gradually upgraded to b/w and color TV users. In the other two
cases, the products’ market domination should be mainly credited to the low-cost version of their
adoption options, that is, the free version of the IM service and the pre-paid version of the mobile
network service. In addition, the suggested model and the three cases demonstrate three forms of
customer churn. In the simplest case (i.e. mobile network service) customers are unlikely to
dis-adopt as the product is important and no better replacements or competitors exist in the market.
This paper also give an example of customer dis-adoption due to generation substitution (i.e.
radio/TV license) and provide a case in which the dis-adoption rate is largely influenced by the
size of the existing user base (i.e. IM service). In the current stage, this study does not find any
single logic that can explain all types of dis-adoption. Therefore, modelers should differentiate
the reasons for customer dis-adoption and model them to match the contexts of different cases.
In terms of the models’ predictive ability, the results of this study support the ability of the
Bass-type models in the employed cases, but encourage future scholars to further study the cases
and the models for improved performance. The results also indicate that simple forecasting
techniques such as the SPSS Expert Modeler can produce reliable forecasts, when the forecast
curve is simple and smooth. Otherwise, the suggested model should be recommended. In
and more decision aids are demanded by marketers in scenario planning. For instance, How
much market potential is still available? Are the customers sensitive to the price change and
what will happen if we calibrate the product price? How the market growth of one adoption
option will influence other adoption options and the overall product? (see details in Table 7)
6.2.Future Directions
This study can be enhanced and extended in a number of directions in future research. First,
it would be interesting to further explore the potential of the Bass-type models in the context of
other products and other business models, which would require a large number of empirical
applications to estimate parameters in many different cases. Second, alongside the Bass-type
models, the diffusion phenomena can also be explored at a heterogeneous level; for instance,
through utility-based NPD models (Jun and Park 1999; Namwoon, Han and Srivastava 2002;
Ding and Eliashberg 2008; Decker and Gnibba-Yukawa 2010) and agent-based NPD models
(van Eck, Jager and Leeflang 2011; Zhang, Gensler and Garcia 2011). Future studies should
model the issues of this study at a heterogeneous level. The results are likely to provide a
comparison and lead to a better explanation and forecasting tool. Third, scholars have generated
many useful insights based on previous Bass-type NPD models, such as optimal pricing
strategies (Krishnan, Bass and Jain 1999; Prasad and Mahajan 2003) and new product entry
timing (Wilson and Norton 1989). It would be interesting to reconsider these issues in the
7.
REFERENCES
Albuquerque Paulo, Bronnenberg Bart J., Corbett Charles J. A Spatiotemporal Analysis of the Global Diffusion of ISO 9000 and ISO 14000 Certification. Management Science 2007; 53 (3): 451-468.
Amit Raphael, Zott Christoph. Creating Value Through Business Model Innovation. MIT Sloan Management Review 2012; 53 (3): 41-49.
Ansari Shahzad M., Fiss Peer C., Zajac Edward J. Made To Fit: How Practices Vary As They Diffuse. The Academy of Management Review 2010; 35 (1): 67-92.
Armstrong J. Scott, Collopy Fred. Error measures for generalizing about forecasting methods: Empirical comparisons. International Journal of Forecasting 1992; 8 (1): 69-80.
Barczak Gloria. The Future of NPD/Innovation Research. Journal of Product Innovation Management 2012; 29 (3): 355-357.
Bass Frank M. A New Product Growth for Model Consumer Durables. Management Science 1969; 15 (5): 215-227.
Bass Frank M., Krishnan Trichy V., Jain Dipak C. Why the Bass Model Fits without Decision Variables. Marketing Science 1994; 13 (3): 203-223.
Biyalogorsky E., Naik P. Clicks and Mortar: The Effect of On-line Activities on Off-line Sales. Marketing Letters 2003; 14 (1): 21-32.
Chatterjee Rabikar, Eliashberg Jehoshua, Rao Vithala R. Dynamic Models Incorporating
Competition. In: V. Mahajan, E. Muller, Y. Wind editors. New Product Diffusion Models. New York: Kluwer Academic Publishers, 2000. pp. 165-206.
Chung Jaihak. Investigating the roles of online buzz for new product diffusion and its cross-country dynamics. Journal of Business Research 2011; 64 (11): 1183-1189.
Decker Reinhold, Gnibba-Yukawa Kumiko. Sales Forecasting in High-Technology Markets: A Utility-Based Approach. Journal of Product Innovation Management 2010; 27 (1): 115-129.
Del Moral P., Miclo L. Asymptotic Results for Genetic Algorithms with Applications to
Nonlinear Estimation. In: L. Kallel, B. Naudts, A. Rogers editors. Theoretical Aspects of Evolutionary Computation. Berlin, Germany: Springer-Verlag, 2001. pp. 439-494.
Deleersnyder Barbara, Geyskens Inge, Gielens Katrijn, Dekimpe Marnik G. How cannibalistic is the Internet channel? A study of the newspaper industry in the United Kingdom and The Netherlands. International Journal of Research in Marketing 2002; 19 (4): 337-348.
Eichengreen Barry, Gupta Poonam. The two waves of service-sector growth. Oxford Economic Papers 2013; 65 (1): 96-123.
Geroski P. A. Models of technology diffusion. Research Policy 2000; 29 (4-5): 603-625.
Givon Moshe, Mahajan Vijay, Muller Eitan. Software Piracy: Estimation of Lost Sales and the Impact on Software Diffusion. The Journal of Marketing 1995; 59 (1): 29-37.
Golder Peter N., Tellis Gerard J. Will It Ever Fly? Modeling the Takeoff of Really New Consumer Durables. Marketing Science 1997; 16 (3): 256-270.
Hauser John R., Tellis Gerard J., Griffin Abbie. Research on Innovation: A Review and Agenda for Marketing Science. Marketing Science 2006; 25 (6): 687-717.
Jun Duk Bin, Park Yoon S. A Choice-Based Diffusion Model for Multiple Generations of Products. Technological Forecasting and Social Change 1999; 61 (1): 45-58.
Kim Namwoon, Chang Dae Ryun, Shocker Allan D. Modeling Intercategory and Generational Dynamics for a Growing Information Technology Industry. Management Science 2000; 46 (4): 496-512.
Krishnan Trichy V., Bass Frank M., Jain Dipak C. Optimal Pricing Strategy for New Products. Management Science 1999; 45 (12): 1650-1663.
Krishnan Trichy V., Bass Frank M., Kumar V. Impact of a Late Entrant on the Diffusion of a New Product/Service. Journal of Marketing Research 2000; 37 (2): 269-278.
Li Feng. What is E-Business? How the Internet Transforms Organizations. Singapore: Blackwell Publishing, 2007.
Libai Barak, Muller Eitan, Peres Renana. The Diffusion of Services. Journal of Marketing Research 2009; 46 (2): 163-175.
Mahajan V., Muller E., Wind Y. New-Product Diffusion Models. Boston & Dordrecht: Kluwer Academic Press, 2000.
Mahajan Vijay, Muller Eitan. Timing, diffusion, and substitution of successive generations of technological innovations: The IBM mainframe case. Technological Forecasting and Social Change 1996; 51 (2): 109-132.
Mahajan Vijay, Peterson Robert A. Innovation Diffusion in a Dynamic Potential Adopter Population. Management Science 1978; 24 (15): 1589-1597.
Namwoon Kim, Han Jin K., Srivastava Rajendra K. A Dynamic IT Adoption Model for the SOHO Market: PC Generational Decisions with Technological Expectations. Management Science 2002; 48 (2): 222-240.
Norton John A., Bass Frank M. A Diffusion Theory Model of Adoption and Substitution for Successive Generations of High-Technology Products. Management Science 1987; 33 (9): 1069-1086.
Peres Renana, Muller Eitan, Mahajan Vijay. Innovation diffusion and new product growth models: A critical review and research directions. International Journal of Research in Marketing 2010; 27 (2): 91-106.
Prasad Ashutosh, Mahajan Vijay. How many pirates should a software firm tolerate?: An analysis of piracy protection on the diffusion of software. International Journal of Research in Marketing 2003; 20 (4): 337-353.
Qian Lixian, Soopramanien Didier. Using diffusion models to forecast market size in emerging markets with applications to the Chinese car market. Journal of Business Research 2014; 67 (6): 1226-1232.
Robinson Bruce, Lakhani Chet. Dynamic Price Models for New-Product Planning. Management Science 1975; 21 (10): 1113-1122.
Rust Roland T., Chung Tuck Siong. Marketing Models of Service and Relationships. Marketing Science 2006; 25 (6): 560-580.
Savin Sergei, Terwiesch Christian. Optimal Product Launch Times in a Duopoly: Balancing Life-Cycle Revenues with Product Cost. Operations Research 2005; 53 (1): 26-47.
Tsai Bi-Huei. Modeling diffusion of multi-generational LCD TVs while considering generation-specific price effects and consumer behaviors. Technovation 2013; 33 (10–11): 345-354.
van Eck Peter S., Jager Wander, Leeflang Peter S. H. Opinion Leaders' Role in Innovation Diffusion: A Simulation Study. Journal of Product Innovation Management 2011; 28 (2): 187-203.
Venkatesan Rajkumar, Krishnan Trichy V., Kumar V. Evolutionary Estimation of Macro-Level Diffusion Models Using Genetic Algorithms: An Alternative to Nonlinear Least Squares. Marketing Science 2004; 23 (3): 451-464.
Wilson Lynn O., Norton John A. Optimal Entry Timing for a Product Line Extension. Marketing Science 1989; 8 (1): 1-17.
Table 1: Summary of Notations Used in the Model
Notation Interpretation
The ceiling on the market potential of the adoption option, at time ;
∑ ;
The new users of the adoption option at time ;
The cumulative users of the adoption option at time ;
The churn rate of the adoption option, at time ;
Coefficient for the dynamic churn rate due to the effect of cumulative users
Coefficient for the constant driver for the market growth of the adoption option;
Coefficient for the dynamic driver for the market growth of the adoption option that is
resulted by the existing users of the adoption option. Price of the adoption option at time ;
Coefficient for the price effect;
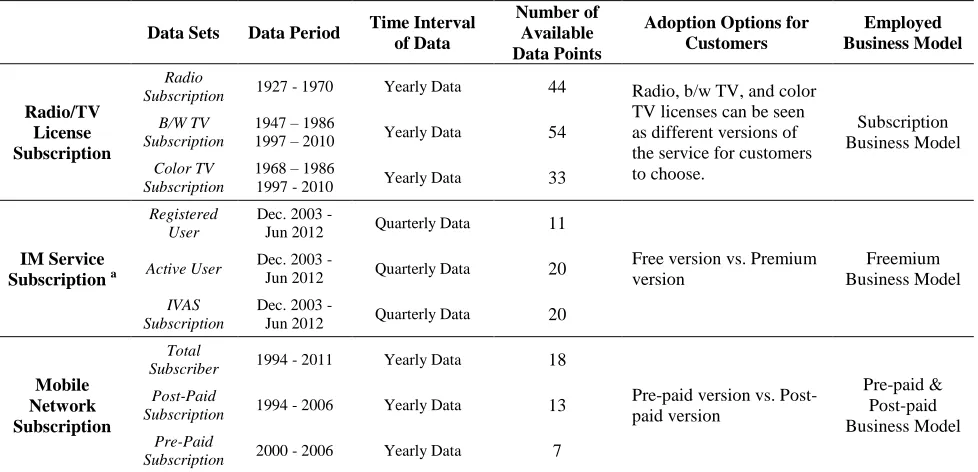
Table 2: Description of the Data Sets
Data Sets Data Period Time Interval of Data
Number of Available Data Points
Adoption Options for Customers Employed Business Model Radio/TV License Subscription Radio
Subscription 1927 - 1970 Yearly Data 44 Radio, b/w TV, and color
TV licenses can be seen as different versions of the service for customers to choose.
Subscription Business Model
B/W TV Subscription
1947 – 1986
1997 – 2010 Yearly Data 54
Color TV Subscription
1968 – 1986
1997 - 2010 Yearly Data 33
IM Service Subscription a
Registered User
Dec. 2003 -
Jun 2012 Quarterly Data 11
Free version vs. Premium version
Freemium Business Model
Active User Dec. 2003 - Jun 2012 Quarterly Data 20
IVAS Subscription
Dec. 2003 -
Jun 2012 Quarterly Data 20
Mobile Network Subscription
Total
Subscriber 1994 - 2011 Yearly Data 18
Pre-paid version vs. Post-paid version
Pre-paid & Post-paid Business Model
Post-Paid
Subscription 1994 - 2006 Yearly Data 13 Pre-Paid
Subscription 2000 - 2006 Yearly Data 7
Table 3: Parameter and Model Settings
Adoption Options Market Growth Rate Churn Rate Market Potential Radio/TV License : Radio Licence
: B/W TV Licence
: Color TV Licence
1) ;
2) ; 3) ( ) ; 4) .
.
(1) users of one generation become potential users of its following generation; (2) market potential increase per year:
( ).
IM Service : Free version
: Premium version
1) ;
2) ; 3) .
( (
∑
)).
Market potential is constant, since dis-adopters become potential users again:
.
Mobile Network Subscription
: Post-Paid service
: Pre-Paid service
1) ;
2) ; 3) ; 4) .
. Market potential is constant, since :
.
Table 4: Estimated Parameters Radio/TV License 0.0216 (0.0006) 0.1899 (0.0003) 2.2349E+7 (0.0010E+7) 0.7765E+7 (0.0003 E+7) 0.9133E+7 (0.0002 E+7) IM Service ⁄ 0.0126 (0.0004) 0.1651 (0.0069) 0.0637 (0.0086) 0.6440 (0.1074) 8.1383 E+8 (0.1845E+8) 0.8801 (0.0018) 0.5658E+2 (0.0323) Mobile Network Subscription , , ⁄ 0.0020 (0.0003) 0.5096 (0.0074) 6.4246 (0.2587) 1.2014E+9 (0.029E+9) 0.9182 (0.0023) 3.7139 (0.1125)
Values in parentheses are the standard deviations of the 100 repeated estimations;
Table 5: Results - Model Fit Model Fit
MAE MAPE 2
R
Radio/TV License
Radio
Suggested Model 6.4672E+5 12.34% 0.9484
Bass Model N/A
B/W TV
Suggested Model 8.6269E+5 141.37% 0.9626
Bass Model N/A
Color TV
Suggested Model 1.2193E+6 108.73% 0.9769
Bass Model N/A
IM Service
Registered Users
Suggested Model 1.5510E+07 3.95% 0.9955
Bass Model 2.2765E+07 4.93% 0.9826
Active Users
Suggested Model 2.5387E+07 10.15% 0.9886
Bass Model 2.0569E+07 7.96% 0.9902
IVAS Users
Suggested Model 2.0311E+06 7.06% 0.9906
Bass Model 3.9145E+06 15.60% 0.9697
Mobile Network Subscription
Total Subscribers
Suggested Model 5.8763E+06 26.31% 0.9241
Bass Model 1.0235E+07 271.06% 0.8785
Post Paid Subscribers
Suggested Model 1.2693E+06 44.82% 0.9058
Bass Model 3.4124E+06 97.11% 0.3840
Pre-Paid Subscribers
Suggested Model 8.5127E+06 27.41% 0.6717
Bass Model 6.4274E+06 23.44% 0.6961
Number of Parameters To be Estimated by the Model
Radio/TV License IM Service Mobile Network Subscription
Suggested Model 5 7 6
Table 6: Model Forecasting Performance
MAPE MdRAE
1 Data Ahead
2 Data Ahead
3 Data
Ahead MEAN
1 Data Ahead
2 Data Ahead
3 Data
Ahead MEAN
Radio/TV License
BW TV Subscription
Suggested Model 6.08% 7.41% 10.26% 7.92% 0.7636 0.6055 0.6530 0.6740
Bass Model N/A N/A
SPSS Expert 5.64% 12.32% 6.58% 8.18% 0.0564 0.1232 0.0375 0.0724
Color TV Subscription
Suggested Model 17.80% 19.20% 21.56% 19.52% 13.8875 11.2672 7.4945 10.8831
Bass Model N/A N/A
SPSS Expert 1.54% 2.92% 1.01% 1.82% 0.0154 0.0292 0.0149 0.0198
IM Service
Active Subscription
Suggested Model 4.66% 3.17% 2.84% 3.56% 1.1515 0.7808 0.6823 0.8715
Bass Model 0.81% 2.40% 5.53% 2.91% 0.1996 0.5891 1.4067 0.7318
SPSS Expert 1.51% 2.43% 1.01% 1.65% 0.3722 0.5982 0.1644 0.3783
IVAS Subscription
Suggested Model 15.17% 9.38% 0.82% 8.46% 1.5956 1.0825 2.0594 1.5792
Bass Model 15.48% 24.45% 5.86% 15.26% 1.6287 3.0856 1.3978 2.0374
SPSS Expert 11.30% 5.58% 8.83% 8.57% 1.1887 0.6411 1.8718 1.2339
Mobile Network Subscription
Total Subscription
Suggested Model 38.92% 25.40% 14.80% 26.37% 6.5464 4.3385 0.5315 3.8055
Bass Model 49.11% 10.18% 81.90% 47.06% 8.2605 1.8616 15.3276 8.4832
Table 7: Summary of Model Implications Case Key Issues Considered in
Model Development
Estimated
Parameters Key Implications Based on Parameter Estimation
Practical Applications
(example questions that can be answered by the model & its parameter estimation)
Radio/TV License
This service product employs a subscription business model; Customers choose between three
options to subscribe: radio, b/w TV, and color TV;
The three options are substitutable in nature; The overall market potential
changes due to the significant population growth in the studied time period
Echoing previous generational NPD studies (e.g. Norton and Bass (1987)), the market drivers for the three adoption options: radio, b/w TV, and color TV licenses do not change across generations
What is the role of the constant market driver in the market growth, and what is the role of the dynamic market driver?
What is the relationship between the adoption options?
Which adoption option(s) deserves more attention in the market planning?
Most service subscribers were triggered by BBC’s early radio broadcasting service, and then gradually upgraded to b/w and color TV users;
The overall market potential is also influenced by the dynamic population
What is the market potential, for each adoption option and the overall product?
How will the market potential change? What is the status of customer dis-adoption
now and in the near future?
IM Service
This service product employs a freemium business model; Customers choose between free
and paid versions to use the service;
Users of each version influence the other’s growth;
The churn rate is influenced by the overall popularity of the service
The constant market driver plays an important role in the market growth of the IM service
See above for parameter and parameter of Case 1
The potential paid users of the IM service are mainly driven by existing paid users, rather than free users;
Paid users of the IM service have little influence on those who plan to subscribe to the free version
, the popularity of the IM service plays an important and positive role in retaining existing users
What is the relationship between the product’s market share and the churn rate?
The Free and premium versions of the IM service tend to target different market niches;
Most of the market potential is established by the free version of the IM service
See above for parameter of Case 1
Mobile Network Subscription
This service product employs a pre-paid & post-paid business model;
Customers choose between pre-paid and post-pre-paid to subscribe to the service;
Users of one version influence the other’s growth;
The product price changes visibly in the studied period;
The market potential is constant due to the product’s monopoly market position and slow population growth
The constant market driver has little influence on the market
growth of the mobile network service See above for parameter and parameter
of Case 1 The post-paid subscribers here are more influential than the
pre-paid ones in driving the market growth
The Pre-paid and post-paid versions of the product tend to target different market niches in the market;
Most of the market potential is established by the pre-paid version of the mobile network service;
The model estimation endorses the assumption that the market potential can be set to be constant when the product has a monopoly market position
See above for parameter of Case 1
Price change of one adoption option plays an important role in its own market growth and the market dynamic of the overall product
Market Growth Data Price/Revenue Data
Figure 1: Curves of Observed Data
0 5 10 15 20
1920 1940 1960 1980 2000 2020
Millio
ns Radio only
B/W TV Col. TV £0 £20 £40 £60 £80 £100 £120 £140 £160
1947 1957 1967 1977 1987 1997 2007
Radio only (Adjusted Price) B/W TV (Adjusted Price) Col. TV (Adjusted Price)
0 100 200 300 400 500 600 700 800 900 1000
01/09/02 28/05/05 22/02/08 18/11/10 14/08/13
Millio
ns Registered IM Users Active Users Inactive Users IVAS Users Free Users ¥0 ¥20 ¥40 ¥60 ¥80 ¥100 ¥120
01/09/02 28/05/05 22/02/08 18/11/10 14/08/13
Revenue Per IM IVAS User
0 10 20 30 40 50 60 70 80 90 100
1994 1996 1998 2000 2002 2004 2006 2008 2010
Millio
ns Total New Subscribers
New Post-Paid Subscribers New Pre-Paid Subscibers
¥0 ¥100 ¥200 ¥300 ¥400 ¥500 ¥600 ¥700 ¥800 ¥900 ¥1,000
1994 1997 2000 2003 2006 2009
0 50 100 150 200 250 300 350 M ill io n
s Radio/TV License Suscribers
Observed (Radio) Estimated (Radio) Observed (B/W TV) Estimated (B/W TV) Observed (Colour TV) Estimated (Colour TV)
0 200 400 600 800 1000 1200 1400 Millio
ns IM Registered User
Observed Estimated 0 100 200 300 400 500 600 700 800 900 Millio
ns IM Active User
Observed Estimated 0 10 20 30 40 50 60 70 80 90 Millio
ns IM Premium User
Observed Estimated 0 10 20 30 40 50 60 70 80 90 100 Millio
ns Total New Subscribers
Observed Estimated 0 2 4 6 8 10 12 14 16 18 20 Millio
ns New Post-Paid Subscribers
Observed Estimated 0 10 20 30 40 50 60 Millio
ns New Pre-Paid Subscribers
Figure 3: Model Fit - Original Bass Model (Mobile Network Subscription) 0
10 20 30 40 50 60 70
1994 1996 1998 2000 2002 2004 2006 2008 2010
Mi
ll
ions
Est_Total Est_Postpaid Est_Prepaid
HIGHLIGHTS
We suggest an extended Bass-type model for NPD in the context of business models.
We examine the model’s explanation and forecasting ability with real-life cases.
We show how NPD models are enhanced by considering the role of business models.