City, University of London Institutional Repository
Citation
:
Abdollahi, Z., Phillips, J. P. & Kyriacou, P. A. (2013). Evaluation of a combined
reflectance photoplethysmography and laser Doppler flowmetry surface probe. 35th Annual
International Conference of the IEEE Engineering in Medicine and Biology Society (EMBC),
pp. 1728-1731. doi: 10.1109/EMBC.2013.6609853
This is the accepted version of the paper.
This version of the publication may differ from the final published
version.
Permanent repository link:
http://openaccess.city.ac.uk/11701/
Link to published version
:
http://dx.doi.org/10.1109/EMBC.2013.6609853
Copyright and reuse:
City Research Online aims to make research
outputs of City, University of London available to a wider audience.
Copyright and Moral Rights remain with the author(s) and/or copyright
holders. URLs from City Research Online may be freely distributed and
linked to.
Abstract—Photoplethysmographic (PPG) signals were recorded from the fingers of 16 healthy volunteers with periods of timed and forced respiration. The aim of this pilot study was to compare estimations of arterial oxygen saturation (SpO2)
recorded using a dedicated pulse oximetry system while subjects were breathing regularly with and without a mouthpiece containing a flow resistor. The experiments were designed to mimic the effects of mechanical ventilation in anaesthetized patients. The effect of estimated airway pressures of ±15 cmH2O caused observable modulation in the
recorded red and PPG signals. SpO2 values were calculated
from the pre-recorded PPG signals. Mean SpO2 values were
95.4% with the flow resistor compared with 97.3% with no artificial resistance, with statistical significance demonstrated using a Student’s t-test (P = 0.006).
I. INTRODUCTION
Despite the success of pulse oximetry as an invaluable monitor of arterial oxygen saturation, its limitations are well documented. In particular the accuracy of pulse oximeters may be affected by a wide range of factors including poor peripheral blood supply [1’], the presence of dysfunctional haemoglobins [2’], dark-colored nail polish [3’] and motion artifact [4’].
Many investigators have reported periodic variations in blood volume in the peripheral vascular bed due to respiration, evident as Respiratory-Induced Intensity Variations (RIIVs) on recorded photoplethysmography (PPG) signals during spontaneous and mechanical ventilation [5’]. Canneson et al. noted that RIIVs of the PPG signal in ventilated patients reduces when intravenous fluids are given and quantified the variation by measuring the difference between maximum and minimum pulse oximetry plethysmogram amplitude (∆POP), i.e. ∆POP = POPmax – POPmin. They suggest that the ∆POP variable may be used as an indication of ‘fluid responsiveness’ (the increase in blood pressure after administration of a given volume of intravenous fluid) [7]. Gesquiere et al. demonstrated that the respiratory modulation increases significantly when 450 mL of blood is removed from the patient [8].
J. P. Phillips and P.A. Kyriacou are with the School of Engineering and Mathematical Sciences, City University London, EC1V 0HB, UK (e-mail: Justin.Phillips.1@city.ac.uk)
A. Belhaj and R. M. Langford are with the Pain and Anaesthesia Research Centre, St Bartholomew’s Hospital, London, EC1A 7BE, UK.
Pulse oximetry algorithms estimate arterial oxygen saturation (SpO2) from the red and infrared PPG signals. Specifically the ratio of absorbance of red and infrared light by the hemoglobin is calculated using the PPG signals to discriminate between arterial blood and the non-pulsatile absorbers in the tissue such as venous blood, skin, muscle bone and pigments such as melanin [2]. As such, any variation in amplitude of the PPG signal has the potential to affect the reported SpO2 value, particularly if the RIIVs affect the red PPG is significantly more than the infrared PPG (or vice versa).
The aim of this study was to investigate the effects of respiration on the SpO2 values estimated from PPG measurements in healthy volunteers. SpO2 values measured while subjects performed periodic tidal breathing were compared with values recorded from the same subjects while performing periodic forced respiration.
II. MATERIALS AND METHODS
A. Measurement system
The measurement system consisted of a custom made finger pulse oximeter. The probe is a standard commercial finger pulse oximeter probe (GE Datex-Ohmeda, Helsinki, Finland). The instrumentation system comprises multiplexed emitter drivers, which produce 40 mA and 25 mA drive current in the red (660 nm) and infrared (940 nm) LEDs contained within the probe.
The output from the photodiode is passed to a transimpedance amplifier, then a demultiplexer to separate the signals into two red and two infrared channels (four channels in total). One red and one infrared signal is high pass filtered using a 2nd order Butterworth filter with -3dB cutoff frequency 0.38 Hz to isolate the PPG signal then passed to a low pass filter with pass band 0–23.4 Hz to remove switching artifact, coupled mains and other interference. These signals are subsequently referred to as ACR and ACIR. The remaining two signals were low pass filtered using a 2nd order Butterworth filter with -3dB cutoff frequency 0.38 Hz. These signals are subsequently referred to as DCR and DCIR. All four signals were then digitized using two analog inputs of a National Instruments NI-6216 16-bit data acquisition card (National Instruments Inc., Austin, TX, USA) using a sample rate of 100 Hz.
A mouthpiece consisting of a narrow tube 8 cm long and 8 mm internal diameter was used as a flow resistor to allow significant airway pressures to be generated during forced
Effect of respiratory-induced intensity variations on finger SpO
2measurements in volunteers
breathing. A port at the proximal (mouth) end was used to measure pressure at the mouth to give an estimation of large airway pressure. The port was connected to a signal conditioned 40PC001B1A pressure sensor (Honeywell Inc., Freeport IL, USA) via an airway gas sampling line of length 1.5 m and internal diameter approximately 2.4 mm. The red and infrared photoplethysmographic signals, together with airway pressure signals were recorded in a tab-delimited text file on a notebook computer running LabVIEW (National Instruments Inc.). During data acquisition, the respiratory pressures were displayed on a computer screen using a graphical ‘slider’ type indicator. This facility enabled subjects to vary their inspiratory and expiratory pressures to a prescribed pressure during forced breathing maneuvers (see next section).
B. Experimental protocol
The protocol was approved by City University Senate Research Ethics Committee. Measurements were made on 10 healthy volunteers (5M, 5F, mean age 33.6 years). Subjects were asked to refrain from smoking and caffeinated drinks for three hours prior to the study and were seated in a chair with the right hand resting on a table in front of them. The pulse oximeter probe was placed on the index finger of the right hand and a commercial pulse oximeter probe (Masimo Corp. Irvine, CA, USA) was placed on the right middle finger. Subjects were asked to breathe tidally at a rate of 10 breaths per minute for one minute. Subjects were then asked to breathe forcefully through the mouthpiece (containing flow resistor and proximally placed pressure sensor), at the same breathing rate, aiming for steady inspiratory and expiratory pressures of –15cmH2O and +15cmH2O respectively for a further minute. Optical signals from the finger probe and airway pressure were recorded on the notebook computer, while oxygen saturation readings on the commercial pulse oximeter were noted at the end of each maneuver.
C. Signal processing and statistical analysis
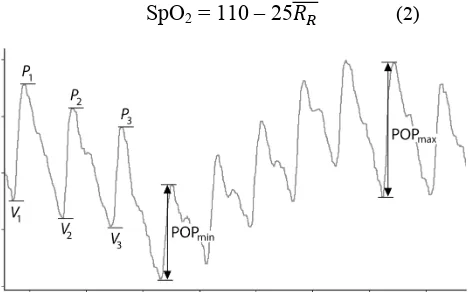
Oxygen saturation was calculated retrospectively from the recorded signals using the following method: the PPG signals (ACR and ACIR) were normalized by dividing by their respective DC signal (DCR and DCIR). The ‘peak to valley’ amplitudes of each cardiac cycle appearing in the signal ACR and ACIR were calculated using a peak and valley detection algorithm, with a width-rejection threshold of 20 samples, i.e peaks or valleys less than 20 samples wide were not recognised. This ensures that features such as the dicrotic notch do not cause underestimation of PPG amplitude. The peak to valley amplitude was taken as the difference in normalized amplitude between a peak and the valley immediately preceding it in the signal data (see Fig 1). The mean ratio of ratios 𝑅! for each cardiac cycle was then calculated from the following:
𝑅!=
𝑃!−𝑉!!
𝑃!−𝑉!!"
! !!!
𝑁 (1)
where 𝑃!−𝑉!! and 𝑃!−𝑉! !" are the peak-valley
differences for red and infrared PPGs respectively corresponding to the ith pulse beat in the dataset and N is the total number of beats in the dataset (approximately 60-80 beats present in one minute of data). The mean value of RR was taken for each 60-second measurement period e.g. normal breathing, forced breathing. Oxygen saturation values were calculated for each period using the often-quoted equation used to calibrate Nellcor commercial pulse oximeters; a linear approximation of empirical data obtained from volunteer studies [11]:
SpO2 = 110 – 25𝑅
! (2) [image:3.612.321.556.238.384.2]
Figure 1. Scheme showing how PPG amplitudes (POP) fare calculated from peaks and valleys in the waveform signal.
The respiratory variation in pulse oximetry plethysmograph amplitude (∆POP) was also estimated from the coefficient of variation (CV) of the peak-valley amplitude divided by the mean peak-valley amplitude, i.e. for the red signal,
∆POP!≈
SD(𝑃!−𝑉!!)
Mean(𝑃!−𝑉!!) (3) and an equivalent equation was used for the infrared signal variation (∆POPIR). Oxygen saturation (SpO2) and respiratory variation in pulse oximetry plethysmograph for red and infrared signals (∆POPR, ∆POPIR) were calculated and compared for the 60-second normal breathing and forced breathing measurement periods.
III. RESULTS
Figure 2. 120-second sample of simultaneous red and infrared PPG signals and airway pressure recorded during 60 seconds of periodic normal breathing, followed by 60 seconds of forced periodic breathing in one subject (Subject #5).
TABLE I. RESPIRATORY VARIATION IN PULSE OXIMETRY
PLETHYSMOGRAPH AMPLITUDE (∆POP) DURING NORMAL
AND FORCED BREATHING
Normal Breathing Forced Breathing Subject
# ∆POPR ∆POPIR ∆POPR ∆POPIR
1 0.164 0.223 0.181 0.300
2 0.304 0.239 0.472 0.513
3 0.334 0.208 0.393 0.211
4 0.193 0.297 0.419 0.422
5 0.197 0.204 0.248 0.457
6 0.470 0.441 0.553 0.496
7 0.354 0.381 0.445 0.373
8 0.445 0.348 0.443 0.477
9 0.232 0.176 0.399 0.392
10 0.311 0.339 0.319 0.416
11 0.371 0.249 0.425 0.286
12 0.310 0.400 0.440 0.467
13 0.156 0.187 0.441 0.453
14 0.365 0.376 0.535 0.407
15 0.268 0.220 0.420 0.394
16 0.333 0.277 0.449 0.401
Mean 0.300 0.285 0.411 0.404
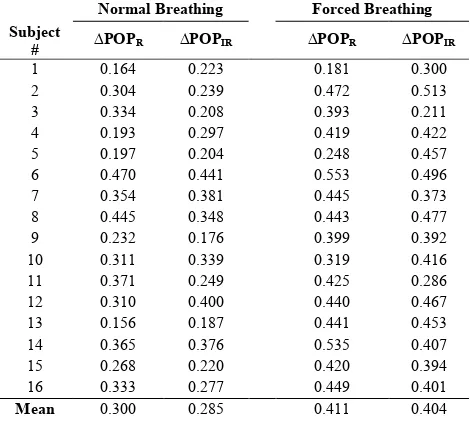
Table 1 shows the respiratory variation in pulse oximetry plethysmograph amplitude (∆POP) during for both red and infrared PPGs calculated during normal and forced breathing in each subject. The mean ∆POP values for both red and infrared PPGs are considerably higher during forced breathing, indicating increased amplitude modulation of the PPG signals caused by variations in airway pressure.
Table 2 shows the arterial oxygen saturation (SpO2) values calculated during the 60-second period of normal breathing and the 60-second period of forced breathing. It can be seen that during forced breathing, the mean SpO2 for all subjects was 1.9% lower than during normal breathing. A paired a Student’t t-test showed a significant difference in SpO2 values measured during normal and forced breathing (P = 0.006).
TABLE II. ARTERIAL OXYGEN SATURATION (SPO2) VALUES
CALCULATED DURING NORMAL AND FORCED BREATHING
Normal Breathing
Forced Breathing Subject
# SpO2 (%) SpO2 (%)
Difference [F–N] (%)
1 97.7 95.6 -2.1
2 98.6 95.4 -3.2
3 98.3 93.7 -4.6
4 96.1 95.9 -0.2
5 96.6 97.6 1.0
6 95.0 92.2 -2.8
7 99.7 93.8 -5.8
8 96.0 95.6 -0.3
9 95.5 95.5 0.0
10 97.4 98.8 1.4
11 98.3 91.1 -7.2
12 97.6 96.4 -1.2
13 95.8 95.3 -0.5
14 99.9 99.2 -0.7
15 96.1 93.7 -2.4
16 97.6 95.9 -1.7
Mean
[image:4.612.60.295.407.618.2] [image:4.612.328.540.507.732.2]IV. DISCUSSION
This study clearly demonstrates the effect of variations in airway pressure on recorded PPG signals. The Respiratory-Induced Intensity Variations (RIIVs) were quantified by comparing the ∆POP values during normal and forced breathing. As may be expected, RIIVs are greater when the variations in airway pressure are significant. Although there was airway pressures during the (periodic) normal breathing were not measured, no doubt there were differences in expiratory and inspiratory pressures. It is almost certain that the pressures were much less than those recorded during the forced maneuvers however.
The reduction in apparent oxygen saturation once forced breathing commences may certainly be attributed to measurement artefact rather than physiological effects. This assumption is valid as it is extremely unlikely that forced breathing would produce desaturation. This finding has potentially serious implications for monitoring ventilated patients, particularly when using high positive airway pressures as erroneous oxygen saturation readings may be reported. Although underestimation of SpO2 is less serious than overestimation, any error should be considered. Indeed this effect could contribute to the generally accepted (in)accuracy of pulse oximeters, which is usually reported to be within the order of 3%, a value which if improved could further enhance the utility and reputation of pulse oximetry in clinical practice.
The effect on the PPG signals and oxygen saturation of airway pressures other than ±15 cmH2O were not investigated in these studies, neither were the individual effects of inspiratory (negative) and expiratory (positive) pressures on the PPG. Further studies are thus planned to investigate these effects, both in volunteers and in ventilated anesthetised patients.
REFERENCES
[1] J. Allen, “Photoplethysmography and its application in clinical physiological measurement,” Phys meas, vol. 28, pp. R1–R39, 2007. [2] J. Moyle, Pulse Oximetry (Principles and Practice), 2nd ed. London:
BMJ Books, 2002.
[3] L. Nilsson, A. Johansson, S. Kalman, “Respiratory variations in the reflection mode photoplethysmographic signal. Relationships to peripheral venous pressure,” Med Biol Eng Comp, vol. 41, pp. 249-254, May 2003.
[4] Michard F., “Changes in arterial pressure during mechanical ventilation,” Anesthesiology, vol. 103, pp. 419-28, 2005.
[5] P. D. Mannheimer, M. P. O'Neil, Ewald Konecny, “The influence of larger subcutaneous blood vessels on pulse oximetry”, J Clin Mon Comp, vol.18, pp.179–188, April 2004.
[6] Kirk H. Shelley. “Photoplethysmography: Beyond the calculation of arterial oxygen saturation and heart rate,” Anesth & Analg, vol. 105, pp. S31-S36, Aug 2007.
[7] M. Cannesson, Y. Attof, P. Rosamel et al., “Respiratory variations in pulse oximetry plethysmographic waveform amplitude to predict fluid responsiveness in the operating room, “ Anesthesiology, vol. 106, pp. 1105–11, 2007.
[8] M. J. Gesquiere, A. A. Awad, D. G. Silvermen et al., “Impact of withdrawal of 450 ml of blood on respiration-induced oscillations of the ear plethysmographic waveform.” J Clin Mon Comp, vol. 21, pp. 277-82, 2007.
[9] Z. D. Walton, “Measuring venous oxygenation using the photoplethysmograph waveform,” M.D. thesis, Dept. Anesth., Yale Univ., New Haven, CT, USA, 2010.
[10] J. P. Phillips, P. A. Kyriacou, D. P. Jones et al. “Pulse oximetry and photoplethysmographic waveform analysis of the esophagus and bowel,” Curr Op Anesth, vol. 21, pp.779–783, 2008.