Effect of waves on the leading-edge undulated tidal turbines
12
Weichao Shi 1 *, Mehmet Atlar1, Rosemary Norman2, Sandy Day1, Batuhan Aktas1 3
4
1 Department of Naval Architecture, Ocean & Marine Engineering, University of Strathclyde, 5
UK 6
2 School of Marine Science and Technology, Newcastle University, UK 7
8 9
Corresponding Author 10
Weichao Shi, Weichao.shi@strath.ac.uk 11
12
Department of Naval Architecture, Ocean & Marine Engineering, 13
Strathclyde University 14
Henry Dyer Building, 100 Montrose Street, 15
Glasgow G4 0LZ, U.K. 16
Abstract: This paper presents an investigation on the efficiency performance of the leading-18
edge undulated tidal turbine blades under the effect of waves. This biomimetic blade 19
application is inspired by humpback whale flippers which provide these mammals with an 20
exceptional manoeuvring ability that is mainly accredited to the beneficial of their leading-21
edge tubercles. The paper first presents the design, optimisation and experimental validation 22
of these turbine models. With the aim of further validating the efficiency performance in a 23
different testing environment as well as exploring the combined effect of the tidal current 24
and wave interaction, a test campaign in a towing tank facility was conducted. Both regular 25
and irregular wave conditions were considered combining with varying towing speeds to 26
simulate the tidal current effect. The test results revealed that the leading-edge undulated 27
turbine has a stable hydrodynamic performance over a combined range of current speeds and 28
waves indicating that the overall performance was not affected considerably by the combined 29
effects as opposed to the performance solely due to steady tidal current. 30
31
Keywords: Wave-current interaction, Tidal turbine, Blade design, Leading-edge Tubercles, 32
1
Introduction
34Humpback whale, known as one of the giant marine mammal species, is surprisingly agile 35
while preying. This is mostly accredited to its highly efficient pectoral fins which are not 36
smooth or streamlined as generally expected on performance swimmers. On the contrary, 37
they are rough surfaces with undulated leading edges (Fish and Battle, 1996, Fish et al., 2011), 38
which have drawn attentions of researchers and designers. The undulated leading edge is 39
formed by the tubercles on the pectoral fins. This feature, which induces beneficial and 40
chordwise counter-rotating vortices between the tubercles, provides the pectoral fins with 41
an efficient performance in terms of delaying stall and improving the lift-to-drag ratio. These 42
performance benefits were demonstrated through relatively recent wind tunnel tests for a 43
pair of replica humpback whale flippers with and without leading-edge tubercles (Miklosovic 44
et al., 2007, Miklosovic et al., 2004). Following this, investigations both numerical and 45
experimental in nature, have looked at potential applications of leading-edge tubercles 46
applied to air fans, wind turbines, rudders, propellers and so on (Ibrahim and New, 2015, 47
Bolzon et al., 2016, Weber et al., 2010, Stanway, 2008, Howle, 2009, Corsini et al., 2013). 48
However most of the research has focused on the foil performance under steady conditions, 49
while rare studies have been conducted to investigate the performance in the unsteady 50
conditions. 51
Recently a study has been conducted to explore the feasibility of applying this feature onto a 52
tidal turbine blades (Shi et al., 2016a, Shi et al., 2016c, Shi et al., 2016b). This study first 53
focused on the design and optimisation of the leading edge tubercles for a specific tidal 54
turbine blade section by using numerical methods to propose an “optimum” design for the 55
blade section. This optimum design was then applied onto a representative tidal turbine blade. 56
This representative 3D blade demonstrated significant benefits especially after stall. The 57
experimental measurements were further validated and complimented by numerical 58
simulations using commercial CFD software for the detailed flow analysis. 59
Following that, a set of tidal turbine models with different leading-edge profiles was 60
manufactured and series of model test campaigns were conducted in a cavitation tunnel to 61
evaluate their efficiency, cavitation, underwater noise, and detailed flow characteristics. 62
Based on these experimental investigations it was confirmed that the leading edge tubercles 63
can improve: the hydrodynamic performance in the low Tip Speed Ratio (TSR, as defined in 64
Equation 2) region without lowering the maximum power coefficient (Cp, as defined in 65
Equation 3) (Shi et al., 2016c); constrain the cavitation development to within the troughs of 66
the tubercles (Shi et al., 2016b); and hence mitigating the underwater noise levels (Shi et al., 67
2016b). 68
However, due to the complexity of natural environment, tidal turbines are operating not only 69
in currents but also under the combined effect of waves. Therefore the performance of these 70
leading-edge tubercles on the undulated turbine blades are questioned in the real sea 71
conditions. To answer this question, this paper presents and discusses the results of a series 72
of test campaigns with the leading-edge undulated turbine models in a controlled 73
environment to evaluate their performances under the real sea conditions. The tests were 74
conducted in the Kelvin Hydrodynamic Lab (KHL), Strathclyde University, under both regular 75
turbines were investigated under the combined effect of the steady current and waves and 77
findings were presented and discussed. 78
2
Description of the tested model
79The biomimetic tidal turbine blade with an undulated leading edge was designed through the 80
recent postgraduate study of the principle author (Shi, 2017). First, a reference turbine blade 81
was chosen based on a previous research project in which a tidal turbine model was designed, 82
tested and numerically modelled (Wang et al., 2007, Shi et al., 2013). The blade section of the 83
reference turbine used the NREL S814 foil section, as shown in Figure 1. The main particulars 84
and the definition of the main particulars for this 400mm diameter model turbine are shown 85
in Table 1 and Figure 2 and based on this model, the leading-edge tubercles were applied to 86
the blades. 87
[image:4.595.46.516.289.575.2]88
Figure 1. S814 foil section
89
Table 1. Main particulars of tidal stream turbine model
90
r/R 0.2 0.3 0.4 0.5 0.6 0.7 0.8 0.9 1 Chord length(mm) 64.35 60.06 55.76 51.47 47.18 42.88 38.59 34.29 30
91
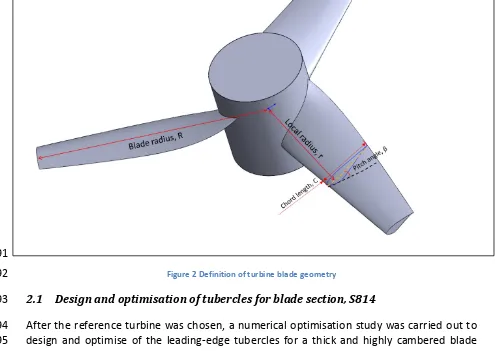
Figure 2 Definition of turbine blade geometry
92
2.1 Design and optimisation of tubercles for blade section, S814 93
After the reference turbine was chosen, a numerical optimisation study was carried out to 94
design and optimise of the leading-edge tubercles for a thick and highly cambered blade 95
section with the well-known S814 section profile. The sinusoidal form of tubercles was 96
selected as the basis shape to conduct the numerical optimisation process. The investigation 97
into the optimisation of the tubercle profiles was initiated by systematically changing two 98
variants: the Height (H); and the Wavelength (W), of these protrusions based on the sinusoidal 99
form of their shapes. The definitions of these parameters are shown in Figure 3. 100
[image:5.595.46.541.76.427.2]101
Figure 3 Definition of 2D foil with a sinusoidal tubercle
102
With the changing variants, the models were built, meshed and evaluated all in the integrated 103
performance evaluation. Based on the optimisation study for the 2D foil section, a sinusoidal 106
form of leading-edge tubercle profile with 0.1C height and 0.5C wavelength appeared to be a 107
good compromise for an optimum design as the maintained lift over the varied angles of 108
attack (marked red in Figure 4) at a cost of slightly lowering the maximum lift coefficient, CL
109
(Shi et al., 2016a). 110
[image:6.595.77.524.157.499.2]111
Figure 4 Comparison of 2D foil lift coefficients with different tubercle profiles by varying the wavelength (W) at constant
112
tubercle height (H=0.1C)
113
2.2 Experimental investigation of a hydrofoil for the best tubercle coverage 114
The designed tubercle profile of 0.1C height and 0.5C wavelength was applied onto a specially 115
manufactured, carbon-fibre model hydrofoil with interchangeable leading-edge profiles. This 116
hydrofoil is a straightened turbine blade with the same chord length distribution but a 117
constant pitch angle, of which the leading edge is modularized and 3D printed. In total 4 118
interchangeable modules with smooth leading edge and 4 modules with tubercles were 119
prepared to test various combinations of the leading-edge profiles with changing the tubercle 120
122
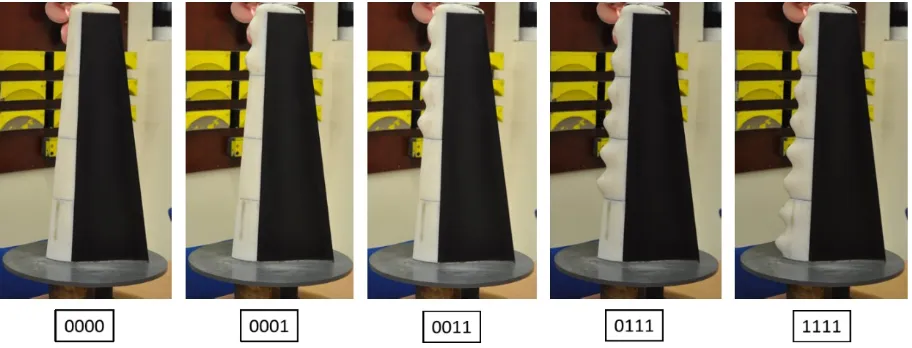
Figure 5 Tested 3D hydrofoil models with interchangeable leading-edge parts
123
Based on the measurements of the lift and drag characteristics of the different tubercle 124
arrangements, the comparisons of the lift-to-drag ratios appear that Foil “0001”, which had 125
1/4 of its leading-edge covered with tubercles, displayed an overall better performance. This 126
can be clearly seen in Figure 6 where Foil “0001” shows a positive impact from 0o to 26o of
127
angle of attack (AOA) with more than 10% enhancement in the maximum lift-to-drag ratio at 128
5o of AOA, compared to the reference (Foil “0000”). Even though Foil “1111” displayed the
129
highest growth rate at 16o AOA, Foil “0001” may offer more potential in improving the
130
performance of a tidal turbine operating over a wider range of tip speed ratios. This 131
experimental study is documented within more details in (Shi et al., 2016a). 132
133
Figure 6 Comparison of relative growth ratios for CL/CD for Foil “1111” (with leading-edge tubercles applied on whole
[image:7.595.107.491.427.725.2]2.3 Cavitation tunnel tests for the performance evaluation 136
Three pitch-adjustable turbine models with different leading-edge profiles were 137
manufactured from bronze material by Centrum Techniki Okrętowej S.A. (CTO, Gdansk), as 138
shown in Figure 7. “Ref” refers to the turbine model with a smooth leading edge; while “Sin2” 139
refers to the one with two leading-edge tubercles at the tip which performed most efficiently 140
in the hydrofoil tests; and the one with eight leading-edge tubercles is named “Sin8” which 141
presented the maximum lift coefficient as well as the most sustained linear increase of the lift 142
during the hydrofoil test. The sinusoidal leading-edge profile was developed as shown in 143
Figure 8. The amplitude (A) of the sinusoidal tubercles was equal to 10% of the local chord 144
length (C) while eight tubercles were evenly distributed along the radius with the wavelength 145
(W) equal to 20mm. The profile of the leading tubercles was as represented by Equation 1. 146
𝐻 =𝐴
2𝑐𝑜𝑠 [ 2𝜋
𝑊 (𝑟 − 40) − 𝜋] +
𝐴 2
Equation 1
where H is the height of the leading-edge profile relative to the reference one which has the 147
smooth leading-edge profile. 148
149
Figure 7. Tested turbine models
150 151
[image:8.595.43.523.348.697.2]152
Figure 8. 3D design of the turbine blade with leading-edge tubercles
153
Before the wave-current interaction tests, which is the main objective of this paper, these 154
three turbine models were tested in the Emerson Cavitation Tunnel of Newcastle University. 155
These tests showed significant improvement in the turbine performance in terms of 156
value of CP, limiting the cavitation development and lowering the underwater radiated noise 158
level (Shi et al., 2016c, Shi et al., 2016b). 159
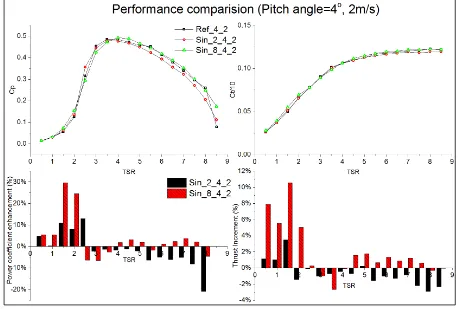
The hydrodynamic test result under 2m/s incoming velocity was presented in Figure 9. In this 160
figure, the pitch angle setting was increased to +4o which was the most efficient pitch angle
161
setting for the reference turbine. The leading-edge tubercles can contribute more torque as 162
represented by the power coefficient (Cp) at the lower end of the TSR range as well as thrust 163
as represented by the thrust coefficient (Ct/10). A maximum of 30% more torque can be 164
produced at TSR=1.5. Compared with Sin_2, the impact caused by Sin_8 is more obvious in 165
both Cp and Ct/10. The leading-edge tubercles did not have any effect on the maximum Cp 166
apart from shifting its TSR from 3.5 to 4.0. The effect of tubercle is similar under varied pitch 167
angles and Reynolds numbers. 168
[image:9.595.69.527.259.568.2]169
Figure 9 Experimental result of model turbine performance in a cavitation tunnel (Pitch=4o, 2m/s)
170
Following the experimental campaign in the cavitation tunnel, the following experimental 171
investigation in a towing tank was planned to further validate the performance of these 172
biomimetic turbines and to explore the combined wave-current effect on the turbine 173
3
Experimental setup and approach
1753.1 Description of the Kelvin Hydrodynamic Lab 176
The experiments were conducted in the Kelvin Hydrodynamic Lab (KHL), Strathclyde 177
University by using its towing tank facility which is 76m in length, 4.6m in width and 2.5m in 178
depth. As shown in Figure 10, one end of the tank is equipped with a variable-water-depth, 179
computer-controlled four-flap absorbing wave-maker generating regular or irregular waves 180
over 0.5m height while the opposite end is fitted with a high-quality variable-water-depth
181
sloping beach, with reflection coefficient typically less than 5% over frequency range of
182
interest.
183
[image:10.595.67.525.242.597.2]184
Figure 10 KHL towing tank
185
3.2 Experimental setup 186
The towing tank of KHL is equipped with the self-propelled Kempf & Remmers towing carriage 187
with a max speed of 5m/s on which an open water dynamometer can be attached to drive 188
the turbine models. The open water dynamometer, that KHL is using, is an in-house built 189
dynamometer driven by a 900w AC motor decelerated by a 10:1 gear box, which has a 190
maximum 300 RPM, specially designed for tidal turbine testing. To get rid of the electrical 191
noise, the cases of the motor and the whole body are connected to the earth. The torque and 192
thrust are measured by a torque and thrust transducer with the capability to measure 2000N 193
test and corrected during the tested. All the signals and power supplies are all transferred 195
through a multi-channel slip ring. A general view of the dynamometer and model fitting at 196
the towing carriage can be seen in Figure 11. A sonic wave probe fitted onto the carriage was 197
used to measure the height and the encounter frequency of the waves. All the measurement 198
data was acquired at 137 Hz as the sample frequency. 199
[image:11.595.94.504.157.463.2]200
Figure 11 Turbine model and dynamometer fitting onto the towing carriage
201
The turbine was mounted on the dynamometer. The rotational speed is controlled by the 202
motor to achieve the desired Tip Speed Ratio (TSR) which can be calculated using Equation 2. 203
During the model tests, the torque and thrust of the turbine were measured and from these 204
measurements the power coefficient (Cp) and the thrust coefficient (CT) can be derived by
205
using Equation 3 and Equation 4 respectively: 206
𝑇𝑆𝑅 =𝜔𝑟
𝑉
Equation 2
𝐶𝑝 =1 𝑄𝜔
2 𝜌𝐴𝑇𝑉3
Equation 3
𝐶𝑇 =
𝑇 1
2 𝜌𝐴𝑇𝑉2
where Q is the torque of the turbine, in Nm; T is the thrust, in N; 𝜔 is the rotational speed, in 207
rad/s; AT is the swept area of the turbine and equals D2/4, m2; 𝜌 is the tank water density, in
208
kg/m3; V is the incoming velocity, in m/s, D is the turbine diameter, in m.
209
As the performance of the turbine is strongly dependent on the Reynolds number, this non-210
dimensional numbers at 0.7 radius of the turbine blade, 𝑅𝑒0.7𝑟 were monitored and can be 211
derived from Equation 5. 212
𝑅𝑒0.7𝑟 = 𝐶0.7𝑟√(𝑉2+ (0.7𝜔𝑟)2 ν
Equation 5
where 𝐶0.7𝑟is the chord length of the turbine at 0.7 radius, m; ν is the kinematic viscosity of 213
the water, m²/s. 214
The uncertainty level of the towing tank tests was well controlled with a 0.3% for the TSR, 1.1% 215
for the Cp and 0.2% for Ct/10 which were based on 7 individual tests for TSR=4. In addition all 216
the test runs were repeated twice for the repeatability checks. 217
3.3 Test matrix 218
The initial set of the tests with the three model turbines involved the open water performance 219
measurements in steady current (i.e. calm water). The testing matrix in Table 2 is to 220
investigate the effect of Reynolds number on the turbine performance, followed by the test 221
matrix in Table 3 for the open water performance test in a range of TSRs with the highest 222
[image:12.595.65.525.450.751.2]achievable Reynolds number. 223
Table 2 Test matrix for Reynolds number test
224
TSR RPM V(m/s) Re0.7r
Reynolds number test
4 50 0.262 29,317
4 100 0.524 58,634
4 150 0.785 87,950
4 200 1.047 117,267
4 250 1.309 146,584
225
Table 3 Test matrix for open water performance test
226
Open water performance test
TSR RPM V(m/s) Re0.7r
1 150 3.142 144,433
2 250 2.618 169,643
2.5 250 2.094 158,993
3 250 1.745 152,897
3.5 250 1.496 149,101
4 250 1.309 146,584
5 250 1.047 143,568
The next two sets of the experiments involved the performance measurements with the same 227
model turbines in waves: firstly in regular waves with two different wave amplitudes and over 228
a range of frequencies as shown in Table 4; and secondly in irregular waves defined by three 229
different JONSWAP wave spectra as shown in Table 5. Table 5 also indicated the 230
corresponding full-scale conditions of the tested JONSWAP spectra for a 20m diameter 231
[image:13.595.46.527.115.473.2]turbine. 232
Table 4 Test matrix for regular wave test
233
Regular wave tests (Dia=0.4m, Shaft submergence=1.1m)
TSR N
(RPM) V (m/s)
Re Wave Amplitude
(m)
Wave Frequency (Hz)
4 250 1.309 146,584 0.05 0.3~0.9
4 250 1.309 146,584 0.1 0.3~0.9
234
Table 5 Test matrix for irregular wave test and corresponding full-scale conditions
235
Irregular wave tests (Dia=0.4m, Shaft submergence=1.1m) Sea State TSR N
(RPM) V (m/s)
Re JONSWAP, Hs
(m)
JONSWAP, Tp (s)
NO.1 4 150 0.785 87,950 0.15 1.581
NO.2 4 150 0.785 87,950 0.25 2.214
NO.3 4 150 0.785 87,950 0.3125 2.372
Full-scale (corresponding) conditions of Irregular wave test (Dia=20m, Shaft submergence=55m) Sea State TSR N
(RPM) V (m/s)
Re JONSWAP, Hs
(m)
JONSWAP, Tp (s)
Return period
NO.1 4 21.01 5.50 3.08E+07 7.5 11.18 1 year
NO.2 4 21.01 5.50 3.08E+07 12.5 15.65 10 year
NO.3 4 21.01 5.50 3.08E+07 15.625 16.77 100 year
236
During the irregular wave tests, 250 wave encounters were guaranteed by multiple runs 237
depending on the test conditions. Two turbines were tested which were the reference turbine 238
(Ref) and biomimetic turbine with full tubercles (Sin8). Modelling of the irregular waves was 239
carried out based on the specified significant wave height Hs, peak wave period Tp and
240
spectral peakedness parameter γ=3.3 in the JONSWAP spectrum given by Equation 6. The 241
three tested JONSWAP spectra were plotted as shown in Figure 12. 242
2 2 2 / 1 exp 4 5 4 2 25 . 1 exp )(f
s p p f
T f S p
T
f
T
H
Equation 6where, S f( ) is the spectral wave energy density distribution; f is the wave frequency 243
(Hz); 𝑓𝑝 is the peak wave frequency (Hz), 1 / Tp; σ = 0.09 for 𝑓 > 𝑓𝑝 and σ =0.07 for 𝑓 < 𝑓𝑝; 244
and 245
0.0624
0.230 0.0336 0.185 / (1.9 )
248
Figure 12 JONSWAP wave spectra generated in model tests
4
Results and discussions
2514.1 Reynolds number effect 252
In order to analyse the effect of the Reynolds number, the three turbines were tested with 253
five different Reynolds numbers at the TSR = 4. Based on the measured torque and thrust the 254
analysed Cp and Ct/10 are presented in Figure 13. As shown in this figure the values of Cp and 255
Ct/10 rise up with the increasing Re. However, these coefficients for the turbines with 256
tubercles, “Sin2” and “Sin8”, are less sensitive to the change in Re number compared with the 257
reference turbine, “Ref”, especially for Cp. This was potentially because of the waviness 258
caused by the tubercles in the leading edge was tripping the laminar flow to move into the 259
transition or turbulent regime. 260
Because of the limited Reynolds number, that can be reached in these tests, the maximum Re 261
condition was used in the following performance tests. However, the Reynolds number effect 262
still had to be born in mind even with the use of the max Re number. Having said that these 263
tests clearly demonstrated more stable performance for the biomimetic turbine as such the 264
power generation efficiency was not dependent on the incoming velocity. This effect is 265
expected as the leading-edge undulation will excite the streamwise contra-rotating vortices 266
which can energise the flow and accelerate the flow transition, as shown in Figure 14. 267
[image:15.595.76.519.371.738.2]270
Figure 14 Schematic description showing a turbulence development on a conventional blade and the one on a
leading-271
edge undulated blade
272 273
4.2 Open water performance tests in the towing tank 274
After the Reynolds number effect tests, open water performance tests with constant carriage 275
speed were conducted for the three models to evaluate their hydrodynamic performance in 276
the towing tank as it has been done in the cavitation tunnel. The test results are shown in 277
Figure 15. Because of the limited Re number, the coefficients of Cp and Ct/10 have shown 278
significantly lower performance. The maximum Cp of the reference turbine tested in the 279
cavitation tunnel as shown in Figure 9 is around 48%, whereas the maximum Cp of the 280
reference turbine in the towing tank is around 40%, which indicated 20% less. This might be 281
not only because of the significant difference in the Reynolds numbers but also because of 282
the difference in the blockage ratios between the two facilities. However, due to nature of 283
the relative comparisons, only the performance results of the tests conducted in the towing 284
tank were compared and discussed in the following. 285
As shown in Figure 15, even though the magnitudes of the results from these two facilities 286
have shown certain level of disparity, the same trend in the effect of the tubercles on the 287
results of the towing tank test based performances can be observed as such: the tubercles 288
still improved the performance in the low TSR region without compromising the peak Cp; Sin8 289
showed the best performance with a slightly shifted Cp curve compared with the reference 290
turbine; general performance of Sin2 was very close to the reference turbine but also with 291
293
Figure 15 Test result of open water performance in the towing tank
294
4.3 Wave-current interaction tests in regular waves 295
Following the open water performance tests in calm water, the same tests were conducted 296
in regular waves with two different wave amplitudes (0.05m and 0.1m) and over a range of 297
incoming wave frequencies (0.3-0.9Hz). As shown in Table 4, all the regular wave tests were 298
carried out for TSR=4, RPM=250 and V=1.309m/s. The time history of the wave height, torque 299
and thrust of the turbines were recorded and then the peak amplitude Fast Fourier transfer 300
analysis (FFT analysis) was applied using Hanning window function. 301
Typical results of time history records and FFT analyses of a sample test run are shown in 302
Figure 16 where the regular wave with a distinct encounter frequency generated significant 303
fluctuation on the torque and thrust records. One can also observe two further peaks in the 304
torque and thrust around the 1st blade passing frequency (12.5Hz) and shaft rotating
305
frequency (4.17Hz), which might be caused by the shaft friction and non-uniform incoming 306
flow. However, these two peaks were very stable throughout the whole tests even with 307
different wave frequencies. Therefore, in order to identify the fluctuation caused by the wave 308
action, which may cause fatigue failure for the tidal turbine, the peaks of the torque and 309
thrust at encounter wave frequencies were excluded in the analyses. 310
Uncertainty analysis for the wave test 311
The uncertainty levels were also checked by four times of repeat tests with the reference 312
shown in Table 6, the results of the measurements for the torque and thrust at the same 314
[image:18.595.66.526.123.268.2]encounter frequencies were quite repeatable with small values of standard deviations. 315
Table 6 Uncertainty analysis of the wave test
316
Real Carriage Speed (m/s)
Real TSR Encounter
Frequency (Hz)
Torque Fluctuation Amplitude (NM)
Thrust Fluctuation Amplitude (N)
Average Cp
Average Ct/10
1.30713 4.005728 0.69978 0.679986 17.160794 0.384556 0.97679
1.30729 4.005229 0.69978 0.674702 17.089281 0.385723 0.97423
1.3072 4.005507 0.69978 0.671198 17.147577 0.386217 0.977304
1.30712 4.005758 0.69978 0.675299 16.868419 0.387079 0.977287
Percentage of standard deviations (%) 0.53% 0.79% 0.27% 0.15%
4.3.1 Effect of regular wave action on the performance of turbines
320
The analysed results of the time averaged power coefficient (Cp) and thrust coefficient (Ct/10) 321
for each encounter frequency tested are presented in Table 7 and Table 8 the wave amplitude 322
of 0.05m and 0.10m, respectively. These coefficients were normalized against the 323
corresponding Cp and Ct/10 values in calm water for the same tip-speed ratio, TSR=4. 324
Table 7 Normalized time average Cp and Ct/10 in regular wave test at wave amplitude=0.05m and TSR=4
325
Encounter wave frequency
Normalized Averaged Ct/10 Normalized Averaged Cp
(Hz) Ref Sin2 Sin8 Ref Sin2 Sin8
1.54952 1.00260 0.99059 1.00012 0.99261 0.98216 0.99944
1.34957 1.00563 1.00025 1.00947 1.00231 0.99761 1.01657
1.09965 1.00854 1.00866 1.00910 1.00960 1.01437 1.02035
0.89971 1.01450 1.00971 1.01304 1.03353 1.02217 1.02716
0.69978 1.01718 1.01222 1.01078 1.04775 1.02091 1.01681
0.54982 1.01280 1.01074 1.00498 1.02144 1.02608 1.00144
0.39987 1.00794 1.00893 1.00205 1.01362 1.02345 1.00472
Calm water 1 1 1 1 1 1
326
Table 8 Normalized time average Cp and Ct/10 in regular wave test at wave amplitude=0.1m and TSR=4
327
Encounter wave
frequency Normalized Averaged Ct/10 Normalized Averaged Cp
(Hz) Ref Sin2 Sin8 Ref Sin2 Sin8
1.54923 0.99165 0.99783 1.00036 0.9819 0.99761 0.9982
1.29958 1.00666 1.00414 1.00280 1.00555 1.00891 1.00514
1.09965 1.01034 1.00614 1.00826 1.01625 1.01939 1.01617
0.89971 1.01810 1.01641 1.01559 1.03896 1.04049 1.03551
0.69978 1.02375 1.01515 1.01665 1.05632 1.04570 1.04519
0.54982 1.01436 1.01525 1.00778 1.04811 1.04999 1.03546
0.39987 1.01151 1.00677 1.00106 1.04986 1.04357 1.02837
Calm water 1 1 1 1 1 1
328
As can be seen in Table 7, the impact of the waves on the Ct/10 of all three turbines was very 329
limited within 2%, while the impact on the Cp was slightly larger but still within 5%. 330
Meanwhile, the reference turbine appeared to be relatively more sensitive to the wave action 331
(by a max of 4.8% increase in Cp) while the ones with tubercles were less sensitive by a max 332
of 2.6% increase in Cp for the Sin2 and 2.7% for the Sin8, respectively. This kind of 333
performance enhancement could be because of the turbulent flow generated by the action 334
of small waves. 335
Similar form of performance enhancement can be also observed with bigger waves, as shown 336
in the Table 8. But the differences in performance change between the reference turbine and 337
turbine; while 5.0% and 4.5% for the Sin2 and the Sin8 respectively. The impact of the wave 339
effect on the coefficient, Ct/10 was even smaller within 2.5% for all three turbines. 340
Based on the above result, it can be seen that the wave action on the performance of the 341
turbine can be beneficial in terms of performance enhancement, but this kind of 342
enhancement is limited within 5% depending on the wave condition. 343
4.3.2 Effect of regular wave action on the performance fluctuations of turbines
344
Apart from the impact on the averaged performance, the fluctuation on the torque and thrust 345
can be a further concern on the performance of a tidal turbine. The fluctuation in torque is 346
concern for the quality of the generated power while the fluctuation in thrust is concern for 347
the supporting structure. In order to shed a light on this aspect Table 9 and Table 10 are 348
included. 349
In these tables, Table 9 and Table 10, the percentage of Cp and Ct/10 fluctuation amplitudes 350
against the mean Cp and Ct/10 values for the same wave condition are presented for two 351
different wave amplitudes tested. As can be seen in the tables, the amplitudes of both Cp and 352
Ct/10 increased with increasing wave amplitude and decreasing wave frequency. Significant 353
fluctuation can be observed with all three turbines, even more than 50% in Cp and a maximum 354
of 30% in Ct/10. Sin2 turbine generally showed higher level of fluctuation while Sin8 turbine 355
showing the lowest fluctuation. However the differences in the fluctuations amongst the 356
[image:21.595.56.527.417.755.2]models were limited to small values. 357
Table 9 Percentage of Cp and Ct/10 fluctuation in regular wave test at wave amplitude=0.05m
358
Encounter wave frequency
Percentage of Ct/10 fluctuation Percentage of Cp fluctuation
(Hz) Ref Sin2 Sin8 Ref Sin2 Sin8
1.54952 2.2% 2.6% 2.1% 5.0% 5.4% 4.5%
1.34957 3.0% 3.5% 2.9% 6.3% 7.1% 6.0%
1.09965 4.8% 4.9% 4.6% 10.1% 10.4% 9.6%
0.89971 7.2% 7.7% 7.0% 15.2% 15.5% 14.3%
0.69978 7.9% 8.3% 7.8% 16.1% 16.4% 16.0%
0.54982 11.9% 12.6% 11.6% 24.5% 25.0% 23.7%
0.39987 13.9% 14.7% 14.0% 28.0% 28.8% 28.2%
Table 10 Percentage of Cp and Ct/10 fluctuation in regular wave test at wave amplitude=0.1m
359
Encounter wave frequency
Percentage of Ct/10 fluctuation Percentage of Cp fluctuation
(Hz) Ref Sin2 Sin8 Ref Sin2 Sin8
1.54923 3.8% 4.0% 4.0% 8.4% 8.2% 8.3%
1.29958 6.6% 7.0% 6.4% 13.5% 14.1% 13.1%
1.09965 10.5% 10.9% 10.1% 21.7% 22.3% 20.9%
0.89971 14.7% 15.5% 14.2% 29.9% 30.8% 28.9%
0.69978 16.4% 17.3% 15.9% 33.0% 34.0% 31.4%
0.54982 23.6% 25.0% 23.0% 47.3% 48.5% 45.9%
In Figure 17 the torque and thrust amplitudes of the three turbines were compared against 360
each other over the encounter frequency range tested. As shown in this figure the amplitudes 361
of the torque and thrust of Sin8 turbine were generally lower than those of the other two 362
turbines. This was more obvious in the thrust while the torque of the Sin8 turbine were similar 363
to the reference turbine. A maximum of 4% lower thrust can be achieved with the Sin8 turbine 364
compared to the Ref turbine in the most extreme condition (Wave Amplitude=0.1, Encounter 365
Wave Frequency=0.39987Hz). 366
[image:22.595.97.503.186.518.2]
367
Figure 17 Amplitudes of torque and thrust in regular waves
368 369
4.4 Wave-current interaction tests in irregular wave tests 370
Having completed the performance tests in regular waves, the Ref turbine and Sin8 turbine 371
were tested in irregular head waves which were generated based on the earlier described 372
JONSWAP wave spectra. Figure 18 shows a typical time history of the wave profile generated 373
in the tank for Hs= 0.15m; Tp=1.581s. The wave calibration against the encounter wave 374
frequency is shown in Figure 19. These tests were conducted with the slower carriage speed 375
(V= 0.785 m/s) and single turbine speed, N=150RPM to reflect the full-scale conditions as 376
prescribed in Table 5. 377
379
Figure 18 Sample of JONSWAP wave profile (Hs=0.15m, Tp=1.581s)
380
381
Figure 19 Wave spectrum calibration against encounter wave frequencies (Hs=0.15m, Tp=1.581s)
382
As previously in the regular wave test, Figure 20 presents the full time history records and 383
peak amplitude FFT analyses of the wave profiles as well as the torque and thrust responses 384
of the Ref turbine for test condition of Hs=150mm; Tp=1.581s, N=150RPM and V=0.785m/s. 385
A closer look at the FFT analyses indicates that apart from the major torque and thrust peak 386
around 0.833 Hz, which corresponds to the encounter frequency for the maximum energy in 387
the wave spectrum (at Tp= 1.581s), there is another local peak at 2.5Hz which corresponds to 388
[image:23.595.95.496.254.549.2]390
Figure 20 Time history and FFT analysis for the irregular wave test (Hs=150mm; Tp=1.581s, N=150RPM and V=0.785m/s)
4.4.1 Effect of irregular wave action on the performance of turbines
392
The analysis was first conducted about the time averaged performance to identify the wave 393
effect on the power generation. The time averaged performance normalized against itself in 394
[image:25.595.69.522.159.272.2]the calm water has been presented in Table 11. 395
Table 11 Normalized time average Cp and Ct/10 in irregular waves (JONSWAP)
396
JONSWAP Hs
JONSWAP
Tp Normalized Averaged Ct/10 Normalized Averaged Cp
(m) (s) Ref Sin8 Ref Sin8
0.15 1.581 1.0157 0.9959 1.0512 1.0156
0.25 2.214 1.0144 0.9963 1.1039 1.0469
0.3125 2.372 1.0148 1.0012 1.1320 1.0755
Calm water 1 1 1 1
As it can be easily noticed, the variation on the averaged Ct/10 is very limited (within 2%), 397
with Sin8 even smaller and limited within 1%. On the other hand, the averaged Cp can be 398
improved by the irregular waves, however this might also because of the wave generated 399
turbulence. These phenomena can also be seen in the regular wave test. The Ref turbine can 400
be improved maximum 13.2% under the condition “Hs=0.3125m and Tp=2.372s”, but the 401
baseline Cp is only 30% in the calm water at this condition (150RPM) limited by the Reynolds 402
effect while 35.6% for the Sin8. With the increasing Reynolds number as in the full-scale 403
conditions, this kind of enhancement might not exist. But because the variation for the Sin8 404
turbine caused by the wave effect was very limited compared to the Ref turbine, a more stable 405
power generation performance of Sin8 can be expected. 406
4.4.2 Effect of irregular wave action on the performance fluctuations of turbines
407
In order to clarify the wave action on the force fluctuations, the significant values (1/3) of 408
torque and thrust were obtained through the FFT analysis. The results were presented in 409
[image:25.595.68.524.532.624.2]Table 12. 410
Table 12 Percentage of significant values of thrust and torque fluctuation in irregular waves (JONSWAP)
411
JONSWAP Hs
JONSWAP Tp
Percentage of significant thrust fluctuation (1/3)
Percentage of significant torque fluctuation (1/3)
(m) (s) Ref Sin8 Ref Sin8
0.15 1.581 35.69% 36.16% 80.66% 76.73%
0.25 2.214 66.60% 71.01% 148.77% 143.32%
0.3125 2.372 80.06% 80.04% 174.62% 159.12%
The result in Table 12 has indicated severe force fluctuations in both torque and thrust. In 412
terms of the torque, the fluctuation of the Sin8 turbine was smaller compared to the Ref 413
turbine especially under the 100-year conditions (Hs=0.3125mm, Tp=2.372s), which indicated 414
around 10% less. However for the thrust, Sin8 showed slight higher value under the 1-year 415
and 10-year conditions (Hs=0.15m, Tp=1.581s and Hs=0. 25mm, Tp=2.214s), but similar level 416
5
Response Amplitude Operator (RAO) for turbine
418performance
419During the analysis of the wave effect on the turbine performance it has been prompted to 420
the Author that there has not been any recommendation or discussion how to define the 421
Response Amplitude Operators (RAO) or the Transfer Functions for the performance of a tidal 422
turbine. Yet, these definitions have been thoroughly investigated and used in the ship motion 423
context as such the ship can be regarded as a linear system and input to the system is the 424
ocean waves and output from the system is being the motion responses. However whether 425
the turbine system can still be regarded as a linear system, as shown in Figure 21, to predict 426
the response as torque or thrust in waves is yet to be concluded (Barltrop et al., 2006, de 427
Jesus Henriques et al., 2014, Tatum et al., 2016). In order to quantify the RAO for the tidal 428
turbine system, the following equation was formulated as below Equation 7. 429
[image:26.595.140.455.283.395.2]430
Figure 21 Linear turbine response to the wave action
431 432
𝑅𝐴𝑂(𝑓) =𝑅(𝑓)
𝐴(𝑓)
Equation 7
where RAO(f) is the response amplitude operators regarding to different wave frequencies, f; 433
R(f) is the response amplitude spectrum of the turbine system; A(f) here is the wave amplitude 434
spectrum. Subscript Q and T will be used to specify the torque or the thrust, respectively. 435
5.1 RAO in regular waves 436
In order to investigate the above problem, the Ref turbine is chosen. The RAO analysis for the 437
torque and thrust of this turbine in regular waves is shown in Figure 22. As shown in the figure, 438
the response of the torque and thrust is strongly linear to the wave amplitude, as the curves 439
of RAOQ(f) and RAOT(f) with two different wave amplitudes almost overlap each other.
440
Therefore the response of the tidal turbine’s performance to the wave actions can be 441
443
Figure 22 RAOs of the reference turbine in regular waves with 250RPM
444 445
The comparisons of RAO in thrust and torque for the three turbines are presented in Figure 446
25 and Figure 26, respectively, for two different wave heights. In the top right corners of these 447
figures a closer look for the thrust and torque for 0.1m wave amplitude is also included for 448
the sake of easier comparison. From these figures it can be noticed that the Sin8 turbine 449
displayed the lowest RAOs in both torque and thrust while the Sin2 turbine showed the 450
452
Figure 23 Comparison of thrust RAO in the regular waves with 250RPM
453
[image:28.595.88.511.70.724.2]454
Figure 24 Comparison of torque RAO in regular waves with 250RPM
5.2 RAO in irregular waves 456
According to the principle of superposition, irregular waves can be described as a linear 457
superposition of infinite number of simple, regular harmonic wave components. In this sense, 458
the RAO(f) can also be derived from the response spectrum obtained in the irregular wave 459
test. If the linear assumption applied to the turbine system, the RAO(f) measured in regular 460
wave tests and derived from the irregular wave tests should agree with each other. 461
Therefore, a check on this assumption was conducted and results are shown in Figure 25 462
where all the tests were repeated with the same carriage speed (0.785m/s) and same RPM 463
(150RPM) for the Refs turbine. In these figures, the lines correspond to the RAOs in regular 464
waves while the dots correspond to the RAO derived from the motion response spectra. For 465
the irregular wave tests, three different JONSWAP wave spectra were used. As it can be seen 466
from these figures the RAO(f)s derived from these tests over majority of the data show close 467
correlations which further validate the hypotheses of the principles of superposition and 468
linear response as applied on the tidal turbine. 469
[image:29.595.75.522.314.498.2]470
Figure 25 RAO(f) of thrust (left) and torque(right) derived from regular and irregular wave test with 150RPM
471 472
5.3 Critical speed correction 473
However, a closer look into the details of the test results for the derived RAO(f)s with different 474
towing speeds and hence different RPM have significant difference. As it is shown in Figure 475
26, in spite of the same TSR (4), wave height (0.1m) and encounter frequencies, the RAO(f)s 476
achieved in 1.309m/s and 250RPM are much higher than the result in 0.785m/s and 150RPM. 477
This indicates the effect of free surface (i.e. Fn number) on the results raising the question of 478
what is the RAOs for tidal turbine models under different current speeds, which is commonly 479
481
Figure 26 RAO(f) of torque (top) and thrust(bottom) tested in different towing speeds
482
As it has been commonly acknowledged in the wave theory, by ignoring the effect of wave 483
diffraction, the wave action can be simplified and assumed to be mainly causing the cyclic 484
velocity fluctuation at certain level of water depth. Based on this assumption the thrust (T) 485
and torque (Q) of turbine model can be expressed by the thrust and torque coefficients, 𝐶𝑇
486
and 𝐶𝑄, as follows:
487
𝑇 = 𝐶𝑇∗1
2𝜌𝐴𝑇𝑉2
Equation 8
𝑄 = 𝐶𝑄∗1
2𝜌𝐴𝑇𝑉2𝑅
Equation 9
If the above assumed cyclic velocity fluctuation in the axial direction has an amplitude of ∆𝑉 488
while 𝐶𝑇 is assumed to be remained the same, the thrust would fluctuate with the amplitude
489
of ∆𝑇 as implied in Equation 10. 490
∆𝑇 = 𝐶𝑇∗
1
2𝜌𝐴𝑇[(𝑉 + ∆𝑉)2−𝑉2] Equation 10
Likewise, the above assumption can be made for the torque coefficients as well. Using 491
Equation 8 and Equation 10, the velocity fluctuation can be reversely derived as shown in 492
∆𝑉 = V ∗ (√(∆𝑇
𝑇 + 1) − 1) Equation 11
The predicted results of ∆𝑉 based on Equation 11 for two sets of regular wave test data with 494
two different carriage speeds but at the same wave height are shown in Figure 27. As it can 495
be seen in this figure the simplified correction made for the effect of waves can justify the 496
fact that the main effect of the waves on the turbine performance can be expressed by the 497
contribution in the current speed due to the longitudinal component of the wave particle 498
velocity. This is of course very much dependant on the depth of submergence of the turbine 499
since the effect will be more significant (due to e.g. diffraction etc) and complex as the turbine 500
gets closer to the free surface. 501
[image:31.595.133.466.284.560.2]502
Figure 27 ∆𝑽 against the wave frequency as calculated based on two regular wave test data with two different carriage
503
speeds
504
The above simplified theory has already been applied to calculate the response amplitude 505
caused by the different wave spectrum combined with varied current speeds (Barltrop et al., 506
2006). In fact Barltrop et al. modelled the effect of the orbital wave velocities on the blade 507
forces of a tidal turbine by using a Blade Element Momentum (BEM) theory and achieved 508
close agreement between the predictions and experimental results in the regular waves. 509
However this study has further elaborated the wave action on the tidal turbines. 510
6
Concluding remarks
512Based on the analysed results of the experimental performance tests in waves which were 513
conducted in the KHL with the three model turbines, the following concluding remarks can be 514
reached: 515
1. The Reynolds number range experienced in the towing tank test was significantly 516
lower than the range in the cavitation tunnel tests, which led to a disparity between 517
the magnitudes of the performance results obtained from the two different facilities. 518
However, the models with the leading-edge tubercles appeared to be less sensitive to 519
the change in the Reynolds numbers compared to the reference turbine. This can be 520
attributed to the potential early transition of the turbulent flow on the turbine blades 521
with the tubercles. 522
2. Relative comparison of the open water performance of the three turbines tested in 523
calm water in the KHL has further confirmed the main findings of the cavitation tunnel 524
tests where the benefits of leading-edge tubercles have been found to be improving 525
the performance in the low TSRs without interfering the maximum efficiency. 526
3. The effect of waves on the averaged magnitude of the Cp and Ct/10 coefficients of the 527
three turbines was not as significant as on the fluctuation amplitudes of the same 528
coefficients. Amongst the three turbines, the lowest fluctuation was experienced with 529
the Sin8 turbine while generating the highest power. 530
4. The RAOs for the torque and thrust data based on the regular wave tests displayed a 531
reasonably linear relationship with the wave height under the same current speed. 532
The Sin8 turbine presented the lowest RAOs over the range of frequencies tested in 533
both torque and thrust while the Sin2 turbine displayed the highest. 534
5. A further check on the RAOs derived from the response spectra of the irregular wave 535
tests displayed close correlations with the RAOs which were obtained from the regular 536
wave tests. This has further supported the applicability of the superposition principles 537
of the regular wave RAOs for different frequency range to obtain the responses in 538
6. The fluctuating effect of the waves on the performance of a turbine can be included 540
in a simplified manner with a correction in the current speed through the longitudinal 541
component of the orbital wave velocity. 542
In conclusion, the leading-edge undulated/tubercled tidal turbines have been further 543
investigated in a towing tank under the combination of wave and current actions. It has been 544
confirmed that wave action does not affect the efficiency performance of the turbine but can 545
cause significant force fluctuations which will pose threat to the structures and the generator. 546
Given the benefits of the leading-edge undulated tidal turbines, the initiation of full-scale 547
prototyping has been raised and planned for the future. 548
549
Acknowledgement
550This research is funded by the School of Marine Science and Technology, Newcastle University 551
and the China Scholarship Council. The financial support obtained from both establishments 552
is gratefully acknowledged. The Authors would also like to thank all the team members in the 553
Kelvin Hydrodynamic Lab for their help in testing and sharing their knowledge. 554
555
Reference
556BARLTROP, N., VARYANI, K. S., GRANT, A., CLELLAND, D. & PHAM, X. 2006. Wave-current 557
interactions in marine current turbines. Proceedings of the Institution of Mechanical 558
Engineers, Part M: Journal of Engineering for the Maritime Environment, 220, 195-203. 559
BOLZON, M. D., KELSO, R. M. & ARJOMANDI, M. 2016. Tubercles and Their Applications. 560
Journal of Aerospace Engineering, 29, 04015013. 561
CORSINI, A., DELIBRA, G. & SHEARD, A. G. 2013. On the Role of Leading-Edge Bumps in the 562
Control of Stall Onset in Axial Fan Blades. Journal of Fluids Engineering-Transactions 563
of the Asme, 135, 081104-081104. 564
DE JESUS HENRIQUES, T. A., TEDDS, S. C., BOTSARI, A., NAJAFIAN, G., HEDGES, T. S., SUTCLIFFE, 565
C. J., OWEN, I. & POOLE, R. J. 2014. The effects of wave–current interaction on the 566
performance of a model horizontal axis tidal turbine. International Journal of Marine 567
Energy, 8, 17-35. 568
FISH, F. E. & BATTLE, J. M. 1996. Hydrodynamic design of the humpback whale flipper. Journal 569
of Morphology, 225:51-60. 570
FISH, F. E., WEBER, P. W., MURRAY, M. M. & HOWLE, L. E. 2011. The tubercles on humpback 571
whales' flippers: application of bio-inspired technology. Integr Comp Biol, 51, 203-13. 572
IBRAHIM, I. H. & NEW, T. H. 2015. Tubercle modifications in marine propeller blades. 10th 574
Pacific Symposium on Flow Visualization and Image Processing. Naples, Italy. 575
MIKLOSOVIC, D. S., MURRAY, M. M. & HOWLE, L. E. 2007. Experimental evaluation of 576
sinusoidal leading edges. Journal of Aircraft, 44, 1404-1408. 577
MIKLOSOVIC, D. S., MURRAY, M. M., HOWLE, L. E. & FISH, F. E. 2004. Leading-edge tubercles 578
delay stall on humpback whale (Megaptera novaeangliae) flippers. Physics of Fluids, 579
16, L39-L42. 580
SHI, W. 2017. Biomimetic improvement of hydrodynamic performance of horizontal axis tidal 581
turbines. PhD, Newcastle University. 582
SHI, W., ATLAR, M., NORMAN, R., AKTAS, B. & TURKMEN, S. 2016a. Numerical optimization 583
and experimental validation for a tidal turbine blade with leading-edge tubercles. 584
Renewable Energy, 96, 42-55. 585
SHI, W., ATLAR, M., ROSLI, R., AKTAS, B. & NORMAN, R. 2016b. Cavitation observations and 586
noise measurements of horizontal axis tidal turbines with biomimetic blade leading-587
edge designs. Ocean Engineering, 121, 143-155. 588
SHI, W., ROSLI, R., ATLAR, M., NORMAN, R., WANG, D. & YANG, W. 2016c. Hydrodynamic 589
performance evaluation of a tidal turbine with leading-edge tubercles. Ocean 590
Engineering, 117, 246-253. 591
SHI, W., WANG, D., ATLAR, M. & SEO, K.-C. 2013. Flow separation impacts on the 592
hydrodynamic performance analysis of a marine current turbine using CFD. 593
Proceedings of the Institution of Mechanical Engineers, Part A: Journal of Power and 594
Energy, 227(8), 833–846. 595
STANWAY, M. J. 2008. Hydrodynamic effects of leading-edge tubercles on control surfaces and 596
in flapping foil propulsion. Msc, Massachusetts Institute of Technology. 597
TATUM, S. C., FROST, C. H., ALLMARK, M., O’DOHERTY, D. M., MASON-JONES, A., PRICKETT, 598
P. W., GROSVENOR, R. I., BYRNE, C. B. & O’DOHERTY, T. 2016. Wave–current 599
interaction effects on tidal stream turbine performance and loading characteristics. 600
International Journal of Marine Energy, 14, 161-179. 601
WANG, D., ATLAR, M. & SAMPSON, R. 2007. An experimental investigation on cavitation, 602
noise, and slipstream characteristics of ocean stream turbines. Proceedings of the 603
Institution of Mechanical Engineers Part a-Journal of Power and Energy, 221, 219-231. 604
WEBER, P. W., HOWLE, L. E. & MURRAY, M. M. 2010. Lift, Drag, and Cavitation Onset On 605
Rudders With Leading-edge Tubercles. Marine Technology and Sname News, 47, 27-606
36. 607