FOCUSISSUE OFSELECTED PAPERS FROMIMLB 2016WITHINVITEDPAPERSCELEBRATING25 YEARS OFLITHIUMIONBATTERIES
Synthesis and Ionic Conductivity Studies of In- and Y-Doped
Li
6Hf
2O
7as Solid-State Electrolyte for All-Solid State Li-Ion
Batteries
M. Amores,a,bS. A. Corr,a,zand E. J. Cussenb
aSchool of Chemistry, University of Glasgow, Glasgow G12 8QQ, United Kingdom
bDepartment of Pure and Applied Chemistry, The University of Strathclyde, Glasgow G1 1XL, United Kingdom
The development of all solid-state lithium batteries is reliant on suitable high performance solid state electrolytes. Here, we present the synthesis and ionic conductivity of the In- and Y-doped Li6Hf2O7materials; Li6+xHf2-xMxO7(M=In3+, Y3+).
Microwave-assisted synthesis was used to give phase pure material after heating for 4 hours at 850◦C. The ionic conductivity of the materials is increased with the insertion of interstitial lithium ion within the structure from 0.02 to 0.25 mS cm−1at 174◦C and the activation energy for ionic conduction is lowered from 0.97(4) eV to 0.42(3) eV with respect to the undoped material.
© The Author(s) 2017. Published by ECS. This is an open access article distributed under the terms of the Creative Commons Attribution 4.0 License (CC BY,http://creativecommons.org/licenses/by/4.0/), which permits unrestricted reuse of the work in any medium, provided the original work is properly cited. [DOI:10.1149/2.06011701jes] All rights reserved.
Manuscript submitted October 26, 2016; revised manuscript received January 2, 2017. Published January 21, 2017. This was Paper 1075 presented at the Chicago, Illinois, Meeting of the IMLB, June 19–24, 2016.This paper is part of the Focus Issue of Selected Papers from IMLB 2016 with Invited Papers Celebrating 25 Years of Lithium Ion Batteries.
Conventional lithium-ion batteries provide exceptionally high energy densities, making them the most popular option for mo-bile/portable applications.1Nevertheless, safety issues and limitations on the operating voltages associated with the use of liquid electrolytes as ionic media for Li-ion diffusion between the electrodes, have led to the proposed introduction of all-solid state batteries, where this liquid electrolyte is replaced by a Li-ion solid-state conductor.2–4The use of solid-state electrolytes would allow access to higher operat-ing voltages and could address many safety concerns.2,3 There are several candidate systems as solid-state electrolytes,5with four fam-ilies being the most widely studied: the air stable NASICON-like LiMM(PO4)3 structures,6 lithium containing garnet materials with
ionic conductivity up to 1.3 mS cm−1,7–10La
2/3Li1/3TiO3perovskites
in the same range of conductivities,11,12 and the most recent thio-LISICON Li10GeP2S12materials with conductivities topping the 10
mS cm−1,13–15matching those of liquid electrolytes. However, despite achieving ionic conductivities comparable with those of liquid elec-trolytes, different drawbacks – such as instability at low voltages or large grain-boundary resistances,16–19have hampered their full imple-mentation. Thus, the search for new candidate materials remains a challenge for the realization of next generation of Li-ion batteries.
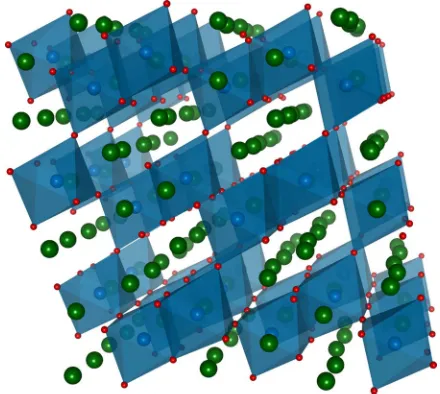
The structure of the Li6Hf2O7 shown in Figure 1contains Li+
ions in 5-fold oxygen coordination in a square pyramid geometry and Hf4+ions octahedrally coordinated by oxide. The lithium ions form pair of chains through the structure. This monoclinic phase can be considered as an anion-deficient NaCl rock salt structure with Li+ and Hf4+ions on the Na+positions and the oxide occupying7/
8of the
anion positions.20,21The presence of these vacant positions and the availability of interstitial positions in the structure suggests it should be possible to tailor the lithium stoichiometry in order to modify the ionic conductivity of the material to generate a solid lithium electrolyte.
Non stoichiometry is a well-studied pathway for increasing lithium conductivity in battery materials. This has been studied in cathode ma-terials such as LixCoO2,22the solid-state electrolyte23LiMgPO4and
the low voltage electrode material LiVO2.24Specifically, the role of
interstitial lithium in lithium-rich anti-perovskite has been found to de-termine the superionic behavior of the material.25Thus, the introduc-tion of interstitial lithium ions in the Li6Hf2O7structure by selective
aliovalent doping is expected to increase the lithium ionic conductivity in the material. This is the approach we have undertaken in this work. The isostructural compound Li6Zr2O7has been reported by
Zoc-chi et al. in 1993.26 Increases in the ionic conductivity of this
ma-zE-mail:[email protected]
terial have been achieved by adding interstitial lithium ions to the structure.27 The opposite mechanism of vacancy creation has been demonstrated by Rao et al.28 Most recently, this material has been synthesized in nanofiber form by use of electrospinning techniques to modify the conductivity.29 The sorption properties of this mate-rial has been examined and showed good performance for CO2 gas
capture30–32extending interest in this material beyond its ability as an ionic conductor.
We report here the microwave-assisted synthesis of the Li6Hf2O7
material, its aliovalent doping with In3+ and Y3+ ions to introduce interstitial lithium ions, the structural characterization of these mate-rials and the influence of this doping on the ionic conductivity of these compounds.
Experimental
Synthetic procedures.—All reagents were used as supplied: LiOH·H2O (98%) from Sigma-Aldrich and HfO2 (99.99%),
[image:1.585.316.536.513.710.2]In2O3(99.997%) and Y2O3(99.9%) from Alfa Aesar.
Figure 1. Crystal structure of the Li6Hf2O7material with C2/c space group of
symmetry. Li+ions are shown in green; O2−anions are shown in red and Hf4+
For the microwave-assisted solid-state synthesis of the In- and Y-doped Li6Hf2O7materials, stoichiometric amounts of reagents were
mixed and ball milled for 20 minutes at 20 Hz with stainless steel milling media. The resulting fine powder was pelleted at 3 tonnes under uniaxial pressure. The pelleted material was heated at 700◦C for 6 hours in a 2.45 GHz CEM Phoenix hybrid microwave furnace for the decomposition of the precursor materials. Subsequently, the material was reground and pelleted for a second heat-treatment carried out in air at 850◦C for 4 hours in the same microwave furnace with a low heating rate of 2◦C min−1to reduce lithium evaporation. For
higher doping levels of x≥0.10 an additional heat-treatment of 850◦C for 4 hours was used to increase sample purity.
Structural characterization.—The purity and crystal structures of these samples was assessed using powder X-ray diffraction. A PANalytical X’Pert PRO Diffractometer was used for this purpose using Cu-Kαradiation in the 2θrange 15–60◦and a step size of 0.016◦. These data were analyzed by Rietveld refinement with the Generalized Structure Analysis System (GSAS),33along with the graphical user interface EXPGUI.34
Scanning electron microscopy and energy-dispersive X-ray spectroscopy.—Particle size and morphology were examined using scanning electron microscopy (SEM) images acquired with a Phillips XL30 ESEM microscope equipped with an Oxford Instruments En-ergy 250 enEn-ergy dispersive spectrometer. Samples were ground and a tiny amount of the fine powder was deposited over a carbon-taped sample holder and gold-coated prior to analysis. Copper tape was em-ployed as an EDX calibration standard and the voltage of the incident beam was 20 keV.
Electrochemical impedance spectroscopy.—Transport measure-ments were performed on a Solartron 1260 Impedance Analyzer using anac rmsvoltage of 200 mV in the frequency range of 1–106Hz and
a temperature range between RT and 424◦C in 50◦C intervals. The as-synthetized powders were cold-pressed under uniaxial pressure at 3 tons and the resultant pellets were heated for 4 hours at 850◦C, obtaining 1–2 mm thick pellets with a diameter of 10 mm. Platinum electrodes were connected using a suspension of ca. 1μm platinum particles on opposing faces of the pellet.
Results and Discussion
Synthesis and structural characterization.—In order to create Li non-stoichiometry on the material, the substitution of Hf4+ ion
with trivalent ions was undertaken, with the anticipation that charge balance would be maintained by the incorporation of additional Li+ into the structure. Of the various trivalent ions in the periodic table, In3+and Y3+were the most suitable ions to dope the Li
6Hf2O7due
to their relatively close ionic radius to Hf4+(In3+=0.80 Å, Y3+= 0.90 Å and Hf4+=0.71 Å)40together with the redox stability of the ions, required for any solid-state electrolyte for lithium-ion battery applications.
Compositions from the series’ Li6+xHf2-xInxO7 and
Li6+xHf2-xYxO7 were synthesized by a novel microwave-assisted
solid-state route we have developed previously for the synthesis of other solid-state electrolyte materials for lithium ion batteries.8 The use of microwave radiation in solid-state synthesis has been demonstrated as an energy efficient synthetic route which enables the use of lower temperatures and shorter times compared with conventional solid-state synthetic routes.35Our synthesis is facilitated by the presence of starting materials, such as the LiOH precursor,36 that strongly couple with microwaves and with materials with high dielectric constants such as the HfO2that can effectively couple with
microwave radiations at high temperatures, in a similar way to the ZrO2precursor.37–39
Undoped Li6Hf2O7 and doped compounds up tox=0.05 were
obtained as single phase samples at a temperature of 850◦C. This
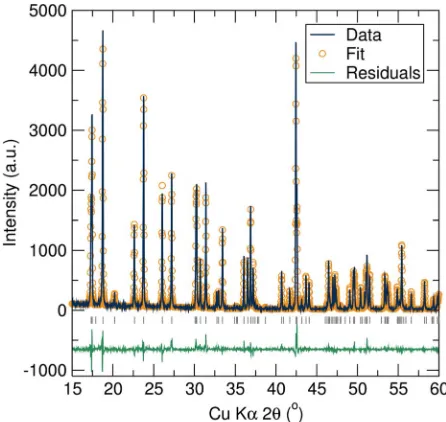
re-Figure 2. Rietveld refinement against X-ray diffraction data collected from the undoped Li6Hf2O7material. The monoclinic structure gives a good
agree-ment with the data. Rwp=12.75% and Rp=9.41%.
quired only four hours for the synthesis compared with several days required by conventional methods previously reported.20Due to the dominance of the diffraction profile by the Hf4+cations and the low symmetry of the structure the atomic coordinates and anion occupan-cies were fixed at the published values. The minimal scattering from Li+meant it was not possible to identify the location of the additional Li+ in the structure. Rietveld refinement of the lattice parameters and profile coefficients shows that this simple approach gives a good agreement between the experimental data and a calculated model for the C2/c space group (Fig.2). The cell parameters obtained from the Rietveld refinements resulted in a=10.4157(2) Å b=5.9678(1) Å and c=10.1589 (2) Å with aβangle of 100.385(1)◦leading to a cell volume of 621.13(2) Å3for the undoped material.
For higher dopant levels up to Li6.15Hf1.85In0.15O7 and
Li6.10Hf1.90Y0.10O7an additional four hours of heating at 850◦C was
needed in order to achieve single phase materials. The solubility limit for the In3+doping was identified at concentrations higher than 0.15, when the secondary phase LiInO2 starts to appear and further
heat-ing leaded to decomposition of the target material. In the case of the Y3+ doping the solubility limit is reached just above x(Y)=0.10,
with appearance of additional peaks at this composition. These peaks could not be indexed by a reduction in space group symmetry, nor do they arise from any of the starting materials or obvious binary or ternary oxides that may result in this system. The lower solubility of this cation in the structure is presumably due to the larger deviation from the radius of Li+exhibited by Y3+compared to Hf4+.
Inspection of the diffraction patterns shown in Figure3 shows no gross changes in the Bragg scattering suggesting the structure is largely unchanged. It should be clearly understood that due to the negligible X-ray scattering arising from Li+ in the presence of the dominant scatterer Hf4+these data give no insight into the placement of the additional lithium in the structure. It may be assumed that Li+ exists at interstitial sites, but this remains conjecture at this stage.
There are no dramatic changes in the structures derived from Ri-etveld analyses, with the most significant being a decrease in the monoclinic distortion with Y3+doping as manifested in theβlattice
parameter shown in Figure4. In the case of the In3+doping, there
were no significant changes in the structure. Again, these results are as anticipated after consideration of the ionic radii of In3+, 0.80 Å, and Hf4+, 0.71 Å, and comparison with the radius of Li+0.76.40
EDX analyses of Li6.15Hf1.85In0.15O7and Li6.10Hf1.90Y0.10O7
[image:2.585.313.536.66.277.2]Figure 3. Diffraction patterns collected from the (a) Li6+xHf2-xInxO7and (b) Li6+xHf2-xYxO7. The peaks arising from impurity phases at the highest dopant
levels are indicated.
which are in good agreement with the values of 0.09 and 0.04 that are anticipated from the targeted stoichiometries.
A powdered sample of Li6Hf2O7shows agglomerates of
micropar-ticles between 10 and 50 microns with no specific morphology as shown in Figure5. A fractured pellet for the Li6.15Hf1.85In0.15O7
mate-Figure 4. Monoclinic distortion (β-angle) variation following the substitution of Hf4+ions with Y3+. A progressive decrease is observed due to the bigger size of the Y3+ions compared to Hf4+.
Figure 5. SEM image of (a) the as-synthesized Li6Hf2O7and (b) the pelleted
Li6.15Hf1.85In0.15O7material prepared for EIS analyses.
rial shows large grains with good connection between them. Despite that, the density of this material was only≈78% of the theoretical density. Further sintering at higher temperatures in order to achieve higher densities resulted in decomposition of the material, possibly due to lithium evaporation.
An elemental compositional map was generated from a cracked pellet of the material that showed the highest conductivity, Li6.10Hf1.90Y0.10O7. Figure6shows that this map indicated a uniform
distribution of Hf, Y and O across the pellet without any apparent segregation or inhomogeneity.
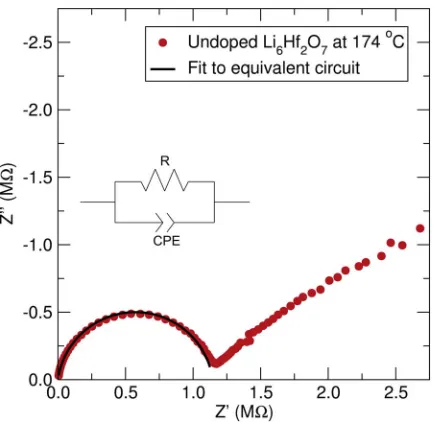
[image:3.585.40.283.362.586.2]Ionic conductivity behavior.—The ionic transport properties of the undoped and doped materials were analyzed by means of impedance analysis and a typical Nyquist plot for the undoped material at 174◦C is shown in Figure7. A clear semicircle is observed at higher quencies due to intra-grain ionic conductivity. The linear lower fre-quency response is typical of the blocking of Li+ due to the use of platinum electrodes, indicating the ionic nature of the impedance. In order to obtain the value for the resistance of the material, these data were fitted using an equivalent circuit of a resistor, due to the resistance to ionic conduction, with a parallel constant phase element due to double layer polarization. The capacitance result-ing from the fit is in the order of 10−12 F, indicating the observed
[image:3.585.317.535.544.709.2] [image:3.585.38.281.634.729.2]Figure 7. Nyquist plot of the impedance data for Li6Hf2O7at 174◦C (red
dots) and the fit derived from the proposed electrical circuit (solid black line) of a parallel arrangement of resistor (R) and constant phase element (CPE).
resistance is mainly due to bulk conductivity,41and the conductivity is 1.95×10⁻²mS cm−1.
In order to obtain further information about the ionic conduction phenomena in these materials, the activation energies of all the phase
pure compositions were determined by variable temperature conduc-tivity measurements. Arrhenius analysis of the data from the undoped material is shown in Figure8. This indicates that the activation energy for ionic diffusion in Li6Hf2O7, 0.97(4) eV, which lies between the
values reported for the isostructural Li6Zr2O7 by Goodenough and
co-workers27 of 0.84 eV and the 1.25 eV obtained by Rao et al.28 Since there is more than one variable parameter within each study (e.g., synthetic conditions, density, set-up employed on the measure-ments, etc.), it is difficult to draw direct comparisons based on these values alone. Also, the activation barrier presented here represents the total conductivity which is highly dependent on the sample mi-crostructure. A detailed study between both isostructural families of materials would be required in order to provide a better understanding regarding the role of the Hf and Zr atoms in the ionic conductivity of these materials.
For the In doped material, the ionic conduction at 174◦C is pro-gressively enhanced with the insertion of the In3+dopant, until it is
increased by one order of magnitude at 174◦C for the x(In)=0.15. The activation energy for ionic conductivity is decreased by a 28% compared to the undoped parent material. In all the cases the evolu-tion of ionic conductivity with temperature agrees accurately with an Arrhenius behavior as shown in Figure8.
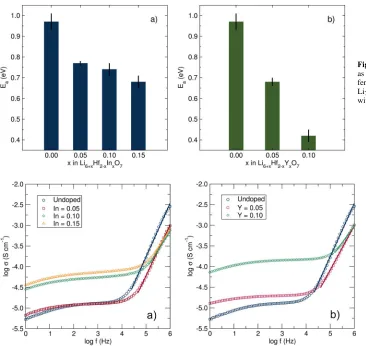
[image:4.585.35.526.393.753.2]The introduction of Y3+also increased the ionic conductivity pro-portionally to Y3+doping stoichiometry as shown in Figure9, again giving an order of magnitude higher for the x(Y)=0.10 composition at 174◦C. Due to the increased ionic conductivity, for the Y-doped material, reliable data could be acquired at room temperature. The activation energy is significantly altered by this doping reaching a value as low as 0.42(3) eV for the x(Y)=0.10 composition as shown in Figure9. The transport properties of all of these compounds are collected in TableIand Figure10.
Figure 8. Nyquist plot of the impedance spectra of the In-doped family at 174◦C (a) and Arrhenius plot of the conductivity mea-sured over the 124 to 424◦C temperature range (b).
Figure 9. Nyquist plot of (a) the impedance of the Li6+xHf2-xYxO7compounds at 174◦C
Table I. Ionic conductivity and activation energy data for Li6+xHf2-xInxO7and Li6+xHf2-xYxO7.
Compound
Ionic Conductivity at
174◦C (mS cm−1) Activation Energy(eV)
Li6.00Hf2.00O7 1.95×10⁻² 0.97(4)
Li6.05Hf1.95In0.05O7 2.17×10⁻² 0.77(1)
Li6.10Hf1.90In0.10O7 9.88×10⁻² 0.74(3)
Li6.15Hf1.85In0.15O7 1.33×10⁻¹ 0.68(3)
Li6.05Hf1.95Y0.05O7 3.28×10⁻² 0.68(2)
Li6.10Hf1.90Y0.10O7 2.46×10⁻¹ 0.42(3)
In the absence of structural information on the location of the additional Li+inserted into the material it is only possible to speculate on the origin of this decrease in activation energy. If interstitial Li+is introduced then a step change in activation energy would be expected due to the introduction of a new pathway for Li+ migration. The more gradual trend observed here suggests that increasing values of
xmay be causing incremental increases in electrostatic repulsion and destabilising Li+and so reducing the barrier to ion motion.
The relationship of the conductivity with the frequency is shown in Figure11and displays two clear behaviors as the frequency is varied. At low to intermediate frequencies the conductivity is approximately constant due to the dominance of the jump relaxation of Li ions by
dcconductivity, leading to a plateau-like region on the graph. This region displays a slight curvature at very low frequencies due to the polarization arising from the increasing resistance to lithium diffusion at the Li-blocking Pt electrodes when decreasing the frequency of the
acfield. The second region at higher frequencies indicates a rapid increase in charge transport that can be attributed to the forward and
Table II. Values of the frequency exponent n for the Li6+xHf2-xInxO7and Li6+xHf2-xYxO7materials.
Compound nexponent value
Li6.00Hf2.00O7 1.29(1)
Li6.05Hf1.95In0.05O7 1.23(1)
Li6.10Hf1.90In0.10O7 0.93(2)
Li6.15Hf1.85In0.15O7 0.94(1)
Li6.05Hf1.95Y0.05O7 1.07(2)
Li6.10Hf1.90Y0.10O7 0.80(2)
backward movements of the ions under the influence of the rapidac
field.42–44
This behavior is in agreement with the Jonscher universal power law45(Eq.1) presenting both of the components, theσ
dc
correspond-ing to the plateau region and the linear region correspondcorrespond-ing to the fn – multiplied by a proportionality constant A. The value for conduc-tivity in the plateau region is increased as the doping concentration increases, indicating the positive impact on the ionic conductivity of the dopant ions.
σ(f)=σdc+Afn [1]
[image:5.585.36.402.407.753.2]The frequency exponentnhas been calculated from fits of the fre-quency dependent range. The variation of thenexponent with respect to the doping (TableII) is clear, where a decrease in thenexponent with increasing amount of the dopant is observed indicating a lower contribution of the forward-backward jumps in favor of macroscopic ionic diffusion. These values for thenexponent are close to unity, sim-ilar to the values reported for other crystalline lithium ion conductor materials, such as the Li-NASICON structures.46
Figure 10. Activation energy for ionic diffusion as calculated from Arrhenius fitting for the dif-ferent levels of In (a) and Y doping (b) of the Li7Hf6O7material. A clear decrease is observed
with increasing amount of dopant.
Figure 11. Ionic conductivity of the (a) In-and (b) Y-doped Li6Hf2O7materials as a
Conclusions
We have demonstrated the successful synthesis and characteriza-tion of Li6Hf2O7by an energy-efficient microwave-assisted synthetic
approach. An aliovalant doping strategy has been employed using Y3+ and In3+to increase the number of lithium per formula unit, and so improve the ionic conductivity of the material. Powder X-ray diffrac-tion has been used to follow the dopant inserdiffrac-tion within the crystal structure. In this manner, it was found that the upper solubility limits of the dopants isx(In)=0.15 for Li6+xHf2-xInxO7andx(Y)=0.10 for
Li6+xHf2-xYxO7. The ionic conductivity of the phase pure materials
has been studied by means of impedance spectroscopy, showing a decrease of the energy barrier for ionic conductivity from 0.97 eV for the undoped material to 0.62 eV for the 0.15 In-doped material and a value of 0.42 eV for the 0.10 Y-doped compound. This low value com-pares favorably to other promising solid-state electrolyte materials.47 This demonstrates the potential of disorder in relatively simple crys-tal structures to generate new materials for solid-state electrolytes applications.
Acknowledgments
The authors gratefully acknowledge technical support from Michael Beglan. The authors also thank the EPSRC (EP/K029290/1 and EP/N001982/1) for funding, the University of Glasgow and Strath-clyde University for support and the use of its facilities, and the School of Chemistry (UofG) for PhD studentship funding.
References
1. J. M. Tarascon and M. Armand,Nature,414(6861), 359 (2001).
2. X. Y. Yao, B. X. Huang, J. Y. Yin, G. Peng, Z. Huang, C. Gao, D. Liu, and X. X. Xu,
Chin. Phys. B,25(1), 018802 (2016). 3. K. Takada,Acta Mater.,61(3), 759 (2013).
4. J. Janek and W. G. Zeier,Nat. Energy,1(9), 16141 (2016). 5. P. Knauth,Solid State Ionics,180(14–16), 911 (2009).
6. N. Anantharamulu, K. Koteswara Rao, G. Rambabu, B. Vijaya Kumar, V. Radha, and M. Vithal,J. Mater. Sci.,46(9), 2821 (2011).
7. C. Bernuy-Lopez, W. Manalastas, J. M. Lopez del Amo, A. Aguadero, F. Aguesse, and J. A. Kilner,Chem. Mater.,26(12), 3610 (2014).
8. M. Amores, T. E. Ashton, P. J. Baker, E. J. Cussen, and S. A. Corr,J. Mater. Chem. A,4(5), 1729 (2016).
9. R. Inada, S. Yasuda, M. Tojo, K. Tsuritani, T. Tojo, and Y. Sakurai,Front. Energy Res.,4(28), (2016).
10. V. Thangadurai, S. Narayanan, and D. Pinzaru,Chem. Soc. Rev.,43(13), 4714 (2014). 11. X. Lin, H. Wang, H. Du, X. Xiong, B. Qu, Z. Guo, and D. Chu,ACS Appl. Mater.
Interfaces,8(2), 1486 (2016).
12. C. Ma, Y. Q. Cheng, K. Chen, J. C. Li, B. G. Sumpter, C. W. Nan, K. L. More, N. J. Dudney, and M. F. Chi,Adv. Energy Mater.,6(11), 1600053 (2016).
13. Y. Kato, S. Hori, T. Saito, K. Suzuki, M. Hirayama, A. Mitsui, M. Yonemura, H. Iba, and R. Kanno,Nat. Energy,1, 16030 (2016).
14. R. Kanno, T. Hata, Y. Kawamoto, and M. Irie,Solid State Ionics,130(1–2), 97 (2000).
15. N. Kamaya, K. Homma, Y. Yamakawa, M. Hirayama, R. Kanno, M. Yonemura, T. Kamiyama, Y. Kato, S. Hama, K. Kawamoto, and A. Mitsui,Nat. Mater.,10(9), 682 (2011).
16. W. D. Richards, L. J. Miara, Y. Wang, J. C. Kim, and G. Ceder,Chem. Mater.,28(1), 266 (2016).
17. S. Wenzel, S. Randau, T. Leichtweiss, D. A. Weber, J. Sann, W. G. Zeier, and J. Janek,
Chem. Mater.,28(7), 2400 (2016).
18. Y. S. Jung, D. Y. Oh, Y. J. Nam, and K. H. Park,Isr. J. Chem.,55(5), 472 (2015). 19. A. C. Luntz, J. Voss, and K. Reuter,J. Phys. Chem. Lett.,6(22), 4599 (2015). 20. R. Czekalla and W. Jeitschko,Z. Anorg. Allg. Chem.,619(12), 2038 (1993). 21. I. Abrahams, P. Lightfoot, and P. G. Bruce,J. Solid State Chem.,104(2), 397 (1993). 22. A. Van der Ven and G. Ceder,J. Power Sources,97–98, 529 (2001).
23. L. Enciso-Maldonado, M. S. Dyer, M. D. Jones, M. Li, J. L. Payne, M. J. Pitcher, M. K. Omir, J. B. Claridge, F. Blanc, and M. J. Rosseinsky,Chem. Mater.,27(6), 2074 (2015).
24. A. R. Armstrong, C. Lyness, P. M. Panchmatia, M. S. Islam, and P. G. Bruce,Nat. Mater.,10(3), 223 (2011).
25. R. Mouta, E. M. Diniz, and C. W. A. Paschoal, J. Mater. Chem. A,4(5), 1586 (2016).
26. M. Zocchi, I. N. Sora, L. E. Depero, and R. S. Roth,J. Solid State Chem.,104(2), 391 (1993).
27. Y. Liao, P. Singh, K.-S. Park, W. Li, and J. B. Goodenough,Electrochim. Acta,102, 446 (2013).
28. R. P. Rao, M. V. Reddy, S. Adams, and B. V. R. Chowdari,Mater. Sci. Eng., B,177(1), 100 (2012).
29. Y. L. Liu and X. F. Hua,Int. J. Appl. Ceram. Technol.,13(3), 579 (2016). 30. Y. Duan and J. Lekse,PCCP,17(35), 22543 (2015).
31. X.-S. Yin, S.-P. Li, Q.-H. Zhang, and J.-G. Yu,J. Am. Ceram. Soc.,93(9), 2837 (2010).
32. H. Pfeiffer and P. Bosch,Chem. Mater.,17(7), 1704 (2005).
33. A. C. Larson and R. B. Von Dreele,Los Alamos National Laboratory Report LAUR
86, (1994).
34. B. H. Toby,J. Appl. Crystallogr.,34, 210 (2001).
35. H. J. Kitchen, S. R. Vallance, J. L. Kennedy, N. Tapia-Ruiz, L. Carassiti, A. Harrison, A. G. Whittaker, T. D. Drysdale, S. W. Kingman, and D. H. Gregory,Chem. Rev.,
114(2), 1170 (2014).
36. W. G. Hennig, W. A. G. Voss, J. M. Dubowik, J. W. Piche, R. Griffiths, R. F. Kovar, and H. K. Kua, Google Patents, 1991.
37. J. Robertson,Eur. Phys. J. Appl. Phys.,28(3), 265 (2004).
38. J. Lasri, P. D. Ramesh, and L. Sch¨achter,J. Am. Ceram. Soc.,83(6), 1465 (2000). 39. J. De Roo, K. De Keukeleere, J. Feys, P. Lommens, Z. Hens, and I. Van Driessche,
J. Nanopart. Res.,15(7), 1 (2013). 40. R. Shannon,Acta Cryst.,A32(5), 751 (1976).
41. J. T. S. Irvine, D. C. Sinclair, and A. R. West,Adv. Mater.,2(3), 132 (1990). 42. K. Funke,Solid State Ionics,94(1), 27 (1997).
43. J. C. Dyre,J. Appl. Phys.,64(5), 2456 (1988). 44. K. Funke,Prog. Solid State Chem.,22(2), 111 (1993). 45. A. K. Jonscher,Nature,267(5613), 673 (1977).