PAC World Conference 2019, Topic 5: Wide area monitoring, protection and control (WAMPAC)
A New Platform for Validating Real-Time, Large-Scale WAMPAC Systems
Steven Blair, Nathan Matheson, Richard Munro, Campbell Booth University of Strathclyde, Glasgow, UK
Abstract
A platform for emulating 64 Phasor Measurement Units (PMUs), with data from a real-time simulation, has been developed. An RTDS simulator has been used to provide IEC 61850-9-2 Sampled Value data, representing three-phase voltage and current measurements from up to 64 power system locations, and the platform efficiently processes the data using cost-effective ARM-based devices, which output synchrophasor data according to the IEEE C37.118.2 protocol. The platform provides flexibility to configure the PMU class and reporting rate at run-time. The paper analyses the measured report latency of the PMUs under a variety of configurations. This development provides a cost-effective system for demonstrating wide-area visualisation, control, and protection schemes.
1
Introduction
Power systems are increasingly reliant on synchrophasor-based methods for monitoring, protection, and control [1]. Testing of such schemes is of critical importance before they can be accepted and deployed.
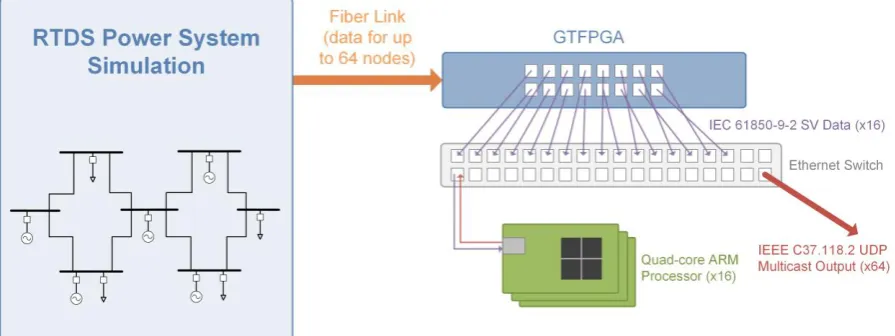
This paper describes a new platform for validating wide-area monitoring, protection, and control (WAMPAC) systems in real-time. The platform is an extension to an RTDS power system simulator, and uses the “GTFPGA” unit to supply IEC 61850-9-2 Sampled Value (SV) data to multiple software Phasor Measurement Unit (PMU) implementations executing on cost-effective ARM processors. The platform this therefore able to supply synchrophasor data from 64 real-time PMUs, which can be used to implement a variety of WAMPAC applications. This paper describes the design of the platform and provides analysis of its performance.
2
Overview of Platform
Figure 1: Block diagram of large-scale PMU platform
3
Detailed Design
3.1 High-Fidelity PMU Algorithm
The PMU algorithm executed within each ARM processor core uses an adaptive filter window approach [2] and has been selected for to its high-quality measurement performance. This platform therefore provides a convenient and cost-effective method for emulating a large number of high-fidelity PMUs that are driven by power system simulation data. The component can readily be added to existing RTDS simulations to enable WAMPAC functions. Although an RTDS can also generate multiple PMU data streams using GTNET cards, this approach is limited in the choice of PMU algorithm and the synchrophasor dataset used (although using GTNET cards does have clear advantages such as greater convenience of integration within an RTDS simulation, guaranteed real-time performance, and support for other protocols).
3.2 Hardware Design
3.2.1 Overview
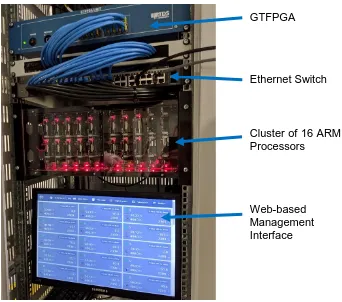
Figure 2: Prototype hardware arrangement
All of the components have been rack-mounted, and an off-the-shelf mount has been purchased to power and physically hold the ARM processors. Three different combinations of ARM hardware and operating system have been tested, which is summarised in Table 1. The RTDS rack is synchronised to absolute time using a GTSYNC card and therefore all the PMUs in the proposed platform are also synchronised appropriately by accessing the timestamps encoded in the SV data.
Hardware Raspberry Pi 3 B+ Raspberry Pi 3 B+ Odroid C2
Operating System Raspbian Stretch Lite DietPi DietPi
CPU Quad-core Cortex-A53 Quad-core Cortex-A53 Quad-core Cortex-A53
Maximum CPU clock 1.4 GHz 1.4 GHz 1.5 GHz
Memory 1 GB 1 GB 2 GB
Ethernet Gigabit, but implemented over
half-duplex USB interface
Gigabit, but implemented over
half-duplex USB interface
Gigabit
Table 1: Summary of PMU hardware tested
3.2.2 Ethernet Network
An important part of the design is that each SV data stream is assigned a unique Virtual Local Area Network (VLAN) identifier to efficiently separate network traffic. The Ethernet switch is configured such that each SV data stream is only sent to the correct Raspberry Pi (or other ARM device) for processing. This ensures that each ARM device does not waste processing time receiving irrelevant data which will
GTFPGA
Ethernet Switch
Cluster of 16 ARM
Processors
[image:3.595.73.525.472.623.2]3.3 Software Design
3.3.1 Sampled Value Data Generation
The RTDS simulation is configured for each of the 16 GTFPGA Ethernet output ports to deliver SV data at 4800 samples per second. It is possible to configure up to 24 voltage or current variables within each dataset; this allows four sets of three-phase voltage and three-phase current values. There are two Application Service Data Units (ASDUs) per frame – meaning that two sets of voltage and current samples are contained within each frame – and therefore 2400 frames are generated per second, for each port. Other combinations of voltage samples, current samples, or sampling rate could be specified, depending on the requirements for a particular experiment.
3.3.2 PMU Implementation
The PMU software uses the open source “rapid61850” software library [3], [4] to decode SV frames. The decoded voltage and current samples, and the associated timestamp, are passed to the PMU algorithm. The algorithm is implemented as a C++ class (which has been automatically generated from a Simulink model) which can be instantiated multiple times to have separate parallel PMUs. The algorithm operates incrementally on each set of waveform inputs, and generates synchrophasor reports when required.
To take advantage of the quad-core capability of the ARM platform, the OpenMP interface is used to conveniently parallelise the code. An OpenMP parallel “for loop” is used to automatically perform the relatively time-consuming PMU algorithm processing for each of the four PMUs on separate CPU cores. Note that each CPU core computes phasors for both voltage and current.
After processing the PMU algorithm, IEEE C37.118.2 packets are generated using multicast UDP. By default, a unique multicast IP address is used based on the ARM device’s configured IP address. The system could also be configured to use unicast UDP or TCP, if required. As noted in Section 3.2.2, each PMU outputs data on a specific VLAN so that the output ports on the Ethernet switch can be controlled (otherwise the data would be sent on all ports, including to other PMUs, which is not desired).
4
Monitoring and Management
4.1 Automated Raspberry Pi Cluster Configuration
A Python program has been developed to automatically configure all the Raspberry Pis (or other ARM devices) used within the cluster. This is important because the configuration process is complex, and there is a relatively large number of devices involved. This means that even minor changes to the PMU software can be conveniently redeployed to all the Raspberry Pi devices.
It is accomplished by a combination of automated Secure Shell (SSH) and Secure Copy Protocol (SCP) calls (similar to the method in [5]). This includes the following features:
• Configuring of network interfaces, including VLAN settings.
• Copying pre-compiled binary files for required software libraries and installing these on each device.
• Copying all the custom software for implementing the PMUs, and compiling and running the program.
• Setting the PMU program to execute automatically when the device boots. • The ability to restart all Raspberry Pi devices.
4.2 Web-Based Interface
Figure 3: Web interface for monitoring and managing PMU status
5
Real-Time Performance Measurement
5.1 Reporting Latency Measurement Method
The method described in [7], with software available at [8], has been used to very accurately characterise the reporting latency of the WAMPAC platform. This is important because real-time protection and control applications may be sensitive to undue latency. Furthermore, the IEEE C37.118.1a standard [9] for synchrophasors has requirements for maximum reporting latency: 2
𝐹𝑠 for P class, and 7
[image:5.595.154.443.481.679.2]can accurately calculate PMU reporting latency from the difference between the synchrophasor timestamp and the frame arrival time.
5.2 Results and Analysis
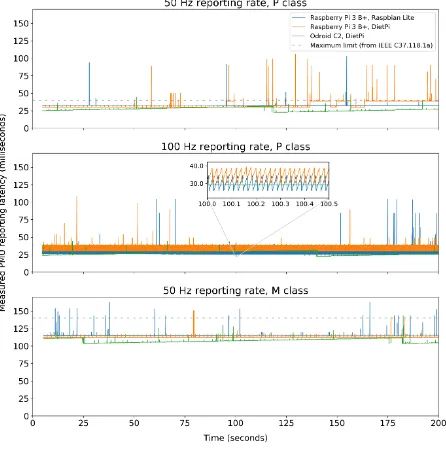
The results for a selection of reporting rates, PMU classes, and PMU hardware platforms are given in Figure 5. There are a number of interesting observations in the results:
• All three PMU hardware platforms present some variation in the reporting latency, as would be expected from Linux-based devices.
• In each test, there are occasions where the reporting latency does exceed the limits set in IEEE C37.118.1a (although only marginally for the Odroid C2 implementation). This limitation would need to be acknowledged for any control or protection testing using this platform. However, further profiling may identify performance bottlenecks and opportunities to improve the response time.
• For the configuration with the P class PMU and 100 Hz reporting rate, the reporting latency alternates between two values (see the inset plot). This is because two reports are delivered at approximately the same point in time, suggesting that there is buffering occurring within the Raspberry Pi; this does not occur for the Odroid C2. This may be due to the fact that the Raspberry Pi Ethernet interface is internally connected via half-duplex USB, whereas the Odroid C2 uses a direct connection to its Ethernet interface.
• It is also evident that the Odroid C2 implementation has a variation in reporting latency over time. This is possibly due to a timer present on the Odroid C2 platform which is used for process scheduling, but which is not synchronised to the same clock that governs the PMU data generation. The time period for this variation is approximately 160 seconds, which could equate to a 24-bit timer with 10 µs resolution, but requires further investigation. However, this does demonstrate the need to monitor reporting latency over a relatively long period of time to capture such unexpected behaviour.
Figure 5: Reporting latency measurements
6
Conclusions
This paper has explained the design, in detail, of a large-scale WAMPAC platform. It has been shown how the platform is designed to efficiently direct SV and IEEE C37.118.2 traffic to only the correct devices and how the processor allocation on the ARM processor is organised efficiently. This development provides a new and flexible way for emulating 64 high-fidelity PMUs for validating novel visualisation, control, and data analytics methods.
in IEEE International Conference on Smart Grid Synchronized Measurements and Analytics (SGSMA), 2019.
[2] A. J. Roscoe, I. F. Abdulhadi, and G. M. Burt, “P and M Class Phasor Measurement Unit Algorithms Using Adaptive Cascaded Filters,” IEEE Trans. Power Deliv., vol. 28, no. 3, pp. 1447–1459, Jul. 2013.
[3] S. M. Blair, “rapid61850,” 2012. [Online]. Available: https://github.com/stevenblair/rapid61850. [4] S. M. Blair, F. Coffele, C. D. Booth, and G. M. Burt, “An Open Platform for Rapid-Prototyping
Protection and Control Schemes with IEC 61850,” IEEE Trans. Power Deliv., vol. 28, no. 2, pp. 1103–1110, 2013.
[5] S. M. Blair, C. D. Booth, B. De Valck, D. Verhulst, and K.-Y. Wong, “Modeling and Analysis of Asymmetrical Latency in Packet-Based Networks for Current Differential Protection Application,” IEEE Trans. Power Deliv., vol. 33, no. 3, pp. 1185–1193, Jun. 2018.
[6] S. M. Blair and C. D. Booth, “A Practical and Open Source Implementation of IEC 61850-7-2 for IED Monitoring Applications,” IEEE Trans. Smart Grid, vol. PP, no. 99, pp. 1–1, 2015.
[7] S. M. Blair, M. H. Syed, A. J. Roscoe, G. M. Burt, and J.-P. Braun, “Measurement and Analysis of PMU Reporting Latency for Smart Grid Protection and Control Applications,” IEEE Access, vol. 7, pp. 48689–48698, 2019.
[8] S. M. Blair, “Real-time measurement of PMU reporting latency,” 2017. [Online]. Available: https://doi.org/10.5281/zenodo.400934.