City, University of London Institutional Repository
Citation
: Moss, A. (2017). REIT Research Compendium. London UK: Consilia Capital.
This is the published version of the paper.
This version of the publication may differ from the final published
version.
Permanent repository link:
http://openaccess.city.ac.uk/18455/
Link to published version
:
Copyright and reuse:
City Research Online aims to make research
outputs of City, University of London available to a wider audience.
Copyright and Moral Rights remain with the author(s) and/or copyright
holders. URLs from City Research Online may be freely distributed and
linked to.
City Research Online:
http://openaccess.city.ac.uk/
[email protected]
Research Compendium 2016
CONTENTS
Page
Introduction
2
Executive Summary: Key Findings
3
The Role of REITs in Pension Funds:
7
How do they contribute to risk-adjusted performance?
Listed Infrastructure:
15
Is it a Separate Asset Class?
REIT ETFs:
How do they impact REIT pricing and performance?
23
REIT Strategies:
Can single sector strategies outperform?
28
Appendix:
32
Changes to our funds database
January 2017
2
Consilia Capital www.consiliacapital.com
Research Compendium for 2016
Introduction
Each of our Real Estate and Infrastructure Securities Funds Monthly publications features a research article. Typically these will come from one of three sources:
1) Academic papers presented at conferences or published in Journals 2) Reports produced by independent / commercial organisations 3) The Consilia Capital proprietary database.
Our aim in highlighting these papers is to showcase the latest information and thinking around the general topic of asset management as it relates to real estate, infrastructure and real asset funds, specifically those which incorporate a listed content in their portfolios. Last year we increased the number of infrastructure funds in our database to reflect the growing demand in this area, and the increasing interest in “real asset” funds which offer secure income streams, capital preservation, and some form of inflation protection. As a result we featured more papers related to this topic than previously.
A number of clients have asked that we package the research element of the Monthlies into a separate document, which can be used as a standalone reference piece. We have therefore produced this document which highlights the key papers featured in 2016, and groups them into topic areas, so that they can be easily read and referenced.
If this format proves popular we will update at regular intervals, as well as incorporate (and update) the key research that remains relevant in our Monthlies from 2013, 2014 and 2015.
We have grouped the research into four broad areas, and in each area have tried to answer straightforward questions, namely;
1. The role of REITs in Pension Funds: How do they contribute to risk-adjusted performance? 2. Listed Infrastructure: Is it a separate Asset Class?
3. REIT ETFs: How do they impact REIT pricing and performance?
4. REIT Strategies: How do single sector strategies affect performance? Is there a vintage effect for Real Estate Securities Funds?
An executive summary (ps 3-5) provides the key findings and concise answers to these questions. Following that we provide a fuller summary of each paper.
3
Consilia Capital www.consiliacapital.com
Research Compendium for 2016
Executive Summary: Key Findings
1)
The role of REITs in Pension Funds: How do they contribute to
risk-adjusted performance?
a.
Report for the Norwegian Pension Fund Global (ps.7-10 )
This Norwegian Ministry of Finance paper was commissioned to open the debate on the best way for GPFG to invest in real estate, and possibly infrastructure, going forward. The paper includes an assessment of risk and return. Their key conclusions regarding listed real estate are as follows:
In the period 1994-2015 investors have been fairly compensated for holding listed real estate (i.e. returns have justified inclusion in multi-asset portfolios)
Correlations have increased (i.e. diversification reduced) with stocks and bonds over the period, meaning that a greater return is required.
Listed real estate has on average outperformed private real estate by 3% per annum during this period (1994-2015).
Over all three periods studied, listed real estate outperformed private real estate, which outperformed stocks, which outperformed bonds.
In the model they use, the authors provide an expected return of 11.3% p.a. for listed real estate which comprises the following six elements: 1) 2.6% time value of money, 2) stock market risk exposure 5.33% 3) bond market risk exposure 1.55% 4) small stock exposure 0.11% 5) value stock exposure 2.34% and 6) momentum stock exposure (-0.58%)
b.
Contribution of REITs to Pension Fund Performance (CEM Benchmarking)
(ps 11-14 )
NAREIT commissioned CEM Benchmarking to undertake a study into investment allocations and
realized investment performance across asset classes using a proprietary dataset, covering over 200 US public and private sector pensions with over $3 trillion in combined assets under management, over a 17-year period.
One of the unique benefits of the dataset is that it provided the actual realized performance net
of investment costs of the assets chosen by plan managers and trustees. Their key conclusions regarding listed real estate are as follows:
Listed equity REITs had the highest average net return over the period, averaging 12.0%. Private equity had the highest average gross return, estimated as 13.5%, but had the second highest average net return of 11.4% because the impact of expenses.
4
Consilia Capital www.consiliacapital.com
Research Compendium for 2016
2)
Listed Infrastructure: Is it a separate asset Class?
a.
Listed Infrastructure as an asset class (EDHEC Infrastructure Institute) (ps.
15-22 )
Although it is clear that there is significant interest in listed infrastructure as a sector there is also some resistance to the asset class. For example, despite the recommendation of the detailed Expert Report to the Norwegian Government Pension Fund on Real Estate and Infrastructure the implementation decision was to have no dedicated allocation to infrastructure and to increase the maximum allocation to real estate. As part of this ongoing debate we feature a recently published paper from the EDHEC Infrastructure Institute. Their conclusions are both interesting, and frankly, surprising. The find that:
There is no robust evidence of a ”listed infrastructure asset class” that was not already covered by a combination of capital market instruments and alternatives, or by a factor-based asset allocation;
The majority of (infrastructure) test portfolios that improve the mean-variance efficient frontier before the GFC fail to repeat this feat post-GFC. There is no evidence of persistent diversification benefits;
Building baskets of stocks on the basis of their SIC code and sector-derived income fails to generate a convincing exposure to a new asset class.
3)
REIT ETFs: How do they impact REIT pricing and performance?
)
Listed real estate has seen a dramatic expansion (predominantly in the US) as the desire for low cost exposure to an income producing asset class has continued. They have grown to such significance that there have been questions as to their influence on underlying REIT pricing
.
a.
Inverse and Leveraged ETFs (Bond et al University of Cincinnati) (ps23-24)
Overall, their evidence suggests that LETF-induced trading causes price overshooting and volatility late in the day for smaller, volatile, real estate sector stocks and this overshooting tends to be reversed in the first hour of the next day.
On days in which real estate sector volatility is particularly high the magnitude of the impact on 3:00 to 4:00 p.m. returns in a typical stock is 234 basis points and can be as high as 327 basis points
b.
ETF Fund Flows and Performance (Consilia Capital) (ps 25-27)
We looked at our database of just over 100 Real Estate ETFs and examined the relationship between flows and performance over 2016, specifically at times of strong investor sentiment due to declining bond yields and then the subsequent retreat. Our aim was to determine whether there was a clear relationship between investor sentiment, ETF flows, and performance.
5
Consilia Capital www.consiliacapital.com
Research Compendium for 2016
4)
REIT Strategies:
One of the questions often asked is whether there is sufficient differentiation between single sector and diversified REITs to enable a consistent investment strategy to be developed.
a.
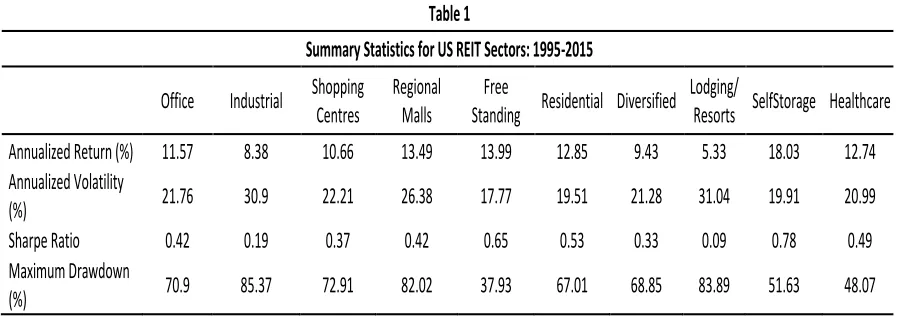
Using Single sector REITs in Fund Management (Moss et al) ps 28-30
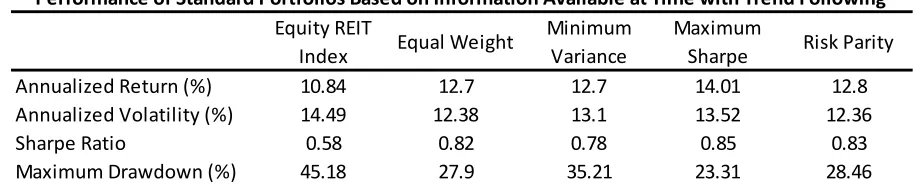
In this paper we have investigated whether combinations of REIT sectors can be created that can outperform the benchmark. We have considered four strategies of Equal Weight, Minimum Variance, Maximum Sharpe and Risk Parity. The Minimum Variance portfolio showed some outperformance compared to the Equal Weight and Risk Parity portfolios, whilst the Maximum Sharpe portfolio was the clear laggard. Three of the four strategies were shown to outperform the benchmark index on a risk-adjusted basis.
One observation from the results was that the maximum drawdowns of the strategies tended to be rather high, indeed as was the benchmark. We therefore investigated whether the application of a trend following filter could be used to improve portfolio performance. It was observed that generally there was little change in the portfolio returns but volatility typically fell by over a third from its previous level and maximum
drawdowns were, on average, less than half of the previous values. The risk-adjusted performance improved dramatically as a result. We conclude that the two step process of forming combinations of REIT sectors with the subsequent addition of a trend following overlay is beneficial relative to a passive benchmark investment.
b.
Vintage Effect for Real Estate Securities Funds (Consilia Capital) (ps 31-32)
There has been a lot of research undertaken on the impact of size, and vintage, on returns for unlisted real estate funds but, as far as we are aware, little on real estate securities funds. Clearly much of the rationale for return divergence according to vintage is due to the finite life of most unlisted funds and, in terms of size, the difference in quality of assets available to funds of different sizes. Theoretically, neither of these issues exist for listed real estate securities, given that they are perpetual life, and that shares are homogenous. Nonetheless, we are interested in discovering whether there have been any perceptible patterns over the cycle, favouring either large or small funds, or funds launched at different stages of the cycle.
Given that in some years only 1 or 2 funds were launched, whilst in others the sample size comprises more than 20, care should be taken when interpreting the results. Similarly, as mentioned, there is no intuitive reason for any pattern of performance to emerge from fund vintage. However, a couple of trends are noticeable from the data in Figure 10, which shows YTD, 3 year and 5 year returns by inception vintage, namely:
Funds launched pre 2000 have better 3 and 5 year track records
Funds launched in 2011 when the market had stabilized have outperformed
Equity REIT
Index
Equal Weight
Minimum
Variance
Maximum
Sharpe
Risk Parity
Annualized Return (%)
10.84
12.7
12.7
14.01
12.8
Annualized Volatility (%)
14.49
12.38
13.1
13.52
12.36
Sharpe Ratio
0.58
0.82
0.78
0.85
0.83
[image:6.595.67.526.393.485.2]Maximum Drawdown (%)
45.18
27.9
35.21
23.31
28.46
Table 3
6
Consilia Capital www.consiliacapital.com
Research Compendium for 2016
Authors
1)
The role of REITs in Pension Funds :
a.
Commentary on the Report for the Norwegian Pension Fund Global
Report Authors
Stijn Van Nieuwerburgh NYU
Richard Stanton U.C. Berkeley
Leo de Bever Former CEO, Alberta Investment Management Corporation
b.
Contribution of REITs to Pension Fund Performance (CEM Benchmarking)
Report Authors
Alexander D. Beath, PhD
Chris Flynn, CFA, both of CEM Benchmarking Inc.
2)
Listed Infrastructure:
a.
Listed Infrastructure Funds in the Consilia Capital database
Author
Alex Moss, Consilia Capital
b.
Listed Infrastructure as an asset class (EDHEC Infrastructure Institute)
Report Authors
Frédéric Blanc-Brude Director of the EDHEC Infrastructure Institute–Singapore who represents EDHEC Business School on the Advisory Board of the Global Infrastructure Facility of the World Bank.
Tim Whittaker Associate Research Director at EDHEC Infrastructure Institute-Singapore and Head of Data Collection.
Simon Wilde Ph.D. candidate at the University of Bath, UK and a Senior Managing Director at Macquarie Capital London.
3)
REIT ETFs :
a.
Inverse and Leveraged ETFs
PaperAuthors
Qing Bai, Shaun Bond, Brian Hatch, all of University of Cincinnati
b.
ETF Fund Flows and Performance
Author
Alex Moss, Consilia Capital
4)
REIT Strategies:
a.
Using Single sector REITs in Fund Management
PaperAuthors
Alex Moss, Andrew Clare, Stephen Thomas, James Seaton all of Cass Business School
b.
Vintage Effect for Real Estate Securities Funds
Author
7
Consilia Capital www.consiliacapital.com
Research Compendium for 2016
1)
The role of REITs in Pension Funds
a)
Commentary on the Expert Report to the
Norwegian Government Pension Fund
A review of real estate and infrastructure investments by the Norwegian Government Pension Fund Global (GPFG)
Authors:
Stijn Van Nieuwerburgh NYU Richard Stanton U.C. Berkeley
Leo de Bever Former CEO, Alberta Investment Management Corporation
This Norwegian Ministry of Finance paper was commissioned to open the debate on the best way for GPFG to invest in real estate, and possibly infrastructure, going forward. The paper includes an assessment of risk and return and a consideration of how Norges Bank's investments should be regulated and monitored by the Ministry of Finance. In this article we look at some of the key findings and recommendations, as well as providing some commentary as to how these findings relate to practitioners in listed real estate.
Conclusions from the Ministry of Finance’s expert group
We show below the key findings and recommendations of the 192 page report, which we have grouped by topic, together with further comment and analysis deemed relevant.
1)
Listed vs Unlisted
Report Findings:
Academic evidence has established that listed and unlisted real estate investments have the same return characteristics over the long run.
There is no evidence for superior performance or reduced risk of unlisted real estate investments, or of the diversification benefits of adding unlisted to listed real estate investments.
Unlisted is considered a sector too large to ignore.
The volatility of unlisted is similar to listed after adjusting for smoothing and extending the time horizon.
The average investor has 75-85% of its real estate investments in unlisted investments and therefore 15-25% in listed.
Expected returns: there is academic evidence demonstrating the expected returns are higher on listed (+ 3% pa benefit).
Volatility – By using a time horizon of 40 months estimated volatilities are 19.2% for NCREIF vs 25.1% for REITs.
Correlation: between listed and unlisted correlation increases as time horizon expands and they can therefore be treated as close substitutes over a medium to long-term investment period.
8
Consilia Capital www.consiliacapital.com
Research Compendium for 2016
Report Recommendation
:
Continue to allow for both listed and unlisted as part of a blended approach to the real estate allocation.Commen
t: We believe that this firmly establishes listed real estate as a separate asset class. While diversification benefits may not be significant we have previously outline the performance benefits of combining listed and unlisted in various papers on blended real estate allocations.We would, however, point out the evidence is clear that the correlation of listed real estate equities with real estate increases and conversely the correlation decreases when compared to general equities, as the
investment holding period increases. See Chart below.
Source: EPRA
2)
Performance of global listed real estate:
Report Findings:
In the period 1994-2015 investors have been fairly compensated.
Correlations have increased (i.e. diversification reduced) with stocks and bonds, meaning that a greater return is required.
Listed real estate has on average outperformed private real estate by 3% per annum during this period.
Over all three periods studied, listed real estate outperformed private real estate, which outperformed stocks, which outperformed bonds.
The combined fluctuations in returns on stocks and bonds explain 62% of the variation in global real estate returns. This suggests there are diversification benefits from adding real estate as 1/3rd of the returns is uncorrelated.
For the US the uncorrelated element is 62%.
Expected returns: In the model they use, the authors provide an expected return of 11.3% p.a. for listed real estate which comprises the following six elements:
9
Consilia Capital www.consiliacapital.com
Research Compendium for 2016
Report Recommendation:
No need to increase exposure to real estate from current target level of 5% and maximum level of 10%.Comment
:
The evidence is clear that listed real estate has generated sufficient levels of return across the short, medium and long term to be considered a separate asset class, and justifies a separate weighting as part of a real estate allocation.3)
Current valuations of real estate assets:
Report Findings:
Valuations are currently elevated relative to historic pricing
Report Recommendation
: Thorough review process is advised on new assets.Comment
: Although a number of developed direct real estate markets are trading at close to high historic levels, it is important to remember that relative to bond yields there is still a historically high premium4)
Appropriate Benchmark:
Report Findings:
The report introduces the Opportunity Cost Model (“OCM”) as an appropriate benchmark.
The belief is that the IPD index is unsuitable for benchmarking real estate performance as it is appraisal based, and there is no need for a separate real estate benchmark.
Further real estate investments (outside of those included in stock and bond benchmarks) are only justified if their expected returns exceed those of the appropriate combinations of stocks and bonds.
Rather than filling a target allocation to real estate, the OCM shifts the focus from asset-class labels to the underlying risk exposure.
The report provides specific recommendations on how to address the challenge of applying this to real estate.
Report Recommendation
s: GPFG should use the Opportunity Cost Model for its real estate andinfrastructure holdings. Rather than filling a target allocation the OCM shifts the focus from asset-class labels to underlying risk exposure. OCM should replace the IPD index. Tracking error should not be used to measure active risk in real estate and infrastructure. Rather, use the OCM with maximum weights.
10
Consilia Capital www.consiliacapital.com
Research Compendium for 2016
5)
Weighting
Report Findings
Under mean-variance optimisation and because an equity allocation has a REIT exposure any separate allocation to real estate is treated as an over-allocation (the GICs reclassification will help clarify this ‘doubling-up’)
In the period 1994-2015 an unconstrained mean-variance efficient portfolio comprised 79.5% bonds, 18% stocks and 2.5% real estate which would have produced annualised average return of 6.1% with volatility of 6% and a Sharpe ratio of 0.586.
Using the constraint of a 35% bonds weighting (the same weighting as in the GPFG portfolio) the optimum portfolio is 35% bonds 37% global stocks and 28% real estate.
Once maximum constraints on the bond position are imposed real estate takes a prominent place in the portfolio weighting.
Real estate can be added to the portfolio without increasing volatility and sacrificing return.
The GPFG portfolio currently has a fixed target of 5% to real estate of which 2.7% is allocated, and aiming to add 1% per year over the mid-2015 to mid-2017 period.
Report Recommendation
:
There should be a maximum weight set at 10% for real estate and 10% for infrastructure. This is not a recommended weight, particularly in the current environment, and the flexibility to increase should only be used if return expectations warrant it.Comment
: A weighting range of 5-15% is consistent with global real estate allocations (source Norges Bank “Diversification Potential of Real estate”). The authors estimate that real estate represents about 6% of the “world market portfolio “with listed real estate comprising 15% of the real estate universe. At present REITs make up at most a small fraction (12-13%) of total real estate investment by pension funds worldwide.6)
Tracking error
Report Recommendation
: The authors believe that GPFG should not use tracking error to measure the active risk in its real estate investments and favour the use of the OCM with maximum weights.Comment
: Given the comments regarding the use of a specific (appraisal based) benchmarkfor real estate, and the preference for a market portfolio “OCM” model, it means that tracking error is no longer a preferred risk and performance metric.
7)
Costs/Transparency
Report Recommendations
:
GPFG should report detailed costs for managing real estate portfolios (i.e. net cash flows).11
Consilia Capital www.consiliacapital.com
Research Compendium for 2016
1)
The role of REITs in Pension Funds
b)
Contribution of REITs to Pension Fund
Performance
There has been a lot of attention focussed on both the marginal contribution of REITs to a mixed asset portfolio as well as the risk adjusted return relative to other asset classes. We have featured papers previously which have looked at the long term evidence, and this month we look at a significant new study which has recently been released, relating to US Pension Fund schemes.
The study
NAREIT commissioned CEM Benchmarking to undertake a study into investment allocations and
realized investment performance across asset classes using a proprietary dataset, covering over 200 US public and private sector pensions with over $3 trillion in combined assets under management, over a 17-year period.
One of the unique benefits of the dataset is that it provided the actual realized performance net of investment costs of the assets chosen by plan managers and trustees.
Authors
Alexander D. Beath, PhD
Chris Flynn, CFA, both of CEM Benchmarking Inc.
Methodology
The study compares gross and net average annual total returns as well as net compound returns across 12 asset classes with appropriate adjustments for reporting lags associated with illiquid asset classes (e.g. Unlisted real estate and private equity).
Data
The authors have used data over the period 1998-2014 and split the multi-asset portfolios into four baskets, namely Stock, Fixed Income, Real assets and Other, with each basket split as follows:
Stock: Large-cap U.S. stock (e.g., large-cap equities appearing in the S&P 500)
Stock: Small-cap U.S. stock (e.g., Russell 2000 small-cap equities + mid cap equities)
Stock: Non U.S. stock (e.g., non US equities such as EAFE and emerging market equities)
Fixed income: Broad U.S. fixed income (e.g., investment grade U.S. corporate bonds)
Fixed income: Long duration U.S. bonds (e.g., strategies dedicated to long duration bonds)
Fixed income: Other U.S. fixed income (e.g., non-investment grade bonds, mortgages, cash)
Fixed Income: Non U.S. fixed income (e.g., non US bonds)
Real Assets: Listed equity REITs (publicly traded real estate)
Real Assets: Private real estate (e.g., direct real estate holdings, real estate limited partnerships)
Real Assets: Other (e.g., commodities, infrastructure, natural resources)
Other: Hedge funds / TAA (e.g., hedge funds and tactical asset allocation teams)
12
Consilia Capital www.consiliacapital.com
Research Compendium for 2016
Results
Asset Returns
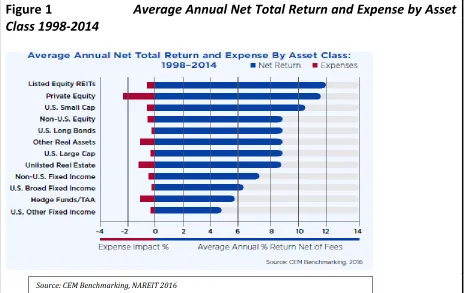
Figure 1 summarizes the arithmetic average annual net returns and average annual investment costs (both in percentage points) for the 12 asset classes covered in the study.
Listed equity REITs had the highest average net return over the period, averaging 12.0%. Private equity had the highest average gross return, estimated as 13.5%, but had the second highest average net return of 11.4% because the impact of expenses.
[image:13.595.67.533.318.611.2]The two worst performing asset classes were hedge funds / tactical asset allocation (TAA) strategies and U.S. other fixed income. U.S. other fixed income however includes cash. If cash is excluded from U.S. other fixed income as an aggregate asset class, then hedge funds/TAA would have been the worst performing asset class with a 17-year arithmetic average annual net return of 5.5 percent.
Figure 1
Average Annual Net Total Return and Expense by Asset
Class 1998-2014
Asset Allocations
The most material decrease in asset allocation was the decrease in allocation to U.S. large cap stocks. In 1998 over 42 percent of the holdings of U.S. DB pension funds were dedicated to U.S. large cap stocks. By 2014 this had fallen to less than 19 percent. The most material increase in asset allocation was the increase in allocation to U.S. long bonds. In 1998 the allocation to U.S. long bonds was less than 2 percent whereas today it is over 16 percent. This increase was confined to corporate sector pension funds.
Although they had the highest arithmetic average annual net return of 12.0 percent over the period, listed Equity REITs were the least used asset class covered in the study. Allocations to listed equity REITs averaged just 0.6 percent of total assets. Unlisted real estate by contrast had a 3.5 percent allocation on average while having had an arithmetic average annual net return of 8.6 percent
13
Consilia Capital www.consiliacapital.com
Research Compendium for 2016
Total Fund Returns
Large corporate sector plans (> $10 billion in AUM) outperformed due to a timely increase in allocation to long duration fixed income just before the financial crisis of 2008.
Small public sector plans (< $2 billion in AUM) underperformed because of persistent underperformance in hedge funds, unlisted real estate, and private equity. The underperformance is due, in part, to the use of expensive fund-of-funds.
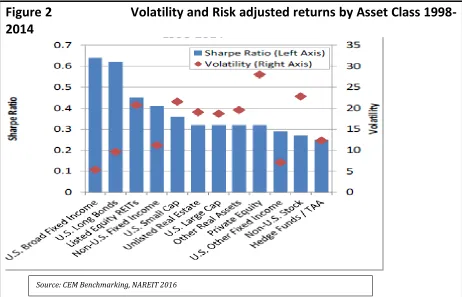
Volatility and Risk Adjusted Returns
The study also compared volatilities and risk adjusted returns using the Sharpe ratio across asset classes. The data are summarized in Figure 2. Key points to note are:
Two fixed income aggregate asset classes had the highest Sharpe ratios reflecting their extremely low volatilities, albeit with modest returns.
Non-U.S. stocks and hedge funds / TAA had the lowest Sharpe ratios reflecting high volatility and poor returns respectively.
After adjusting for reporting lags, private equity was the most volatile aggregate asset class by far at 28.0 percent. The large volatility reflects both the large standard deviation of average returns (market risk) as well as the large dispersion of returns between funds (idiosyncratic risk).
After adjusting for reporting lags, the study found that listed equity REITs and unlisted real estate had comparable volatilities. Listed equity REITs and unlisted real estate had the 4th and 5th most volatile net
[image:14.595.67.529.376.673.2]returns with measure volatilities of 20.7 percent and 19.6 percent respectively
Figure 2 Volatility and Risk adjusted returns by Asset Class
1998-2014
Correlations
14
Consilia Capital www.consiliacapital.com
Research Compendium for 2016
The broadest group of highly correlated aggregate asset classes were equity asset classes together with hedge funds / TAA; this includes U.S. large cap stock, U.S. small cap stock, non-U.S. stocks, hedge funds, TAA, and private equity. The high correlation of listed equities to private equity only emerged after accounting for reporting lags. Correlations in this group ranged from 0.79 to 0.93.
Listed equity REITs and unlisted real estate were highly correlated as well, once reporting lags in unlisted real estate were accounted for. The correlation between the two asset classes is 0.91, among the highest of all. The high correlation is not surprising given both asset classes invest in fundamentally the same assets.
Both listed equity REITs and unlisted Real Estate are not highly correlated to any other aggregate asset classes.
Long duration U.S. bonds are anti-correlated to stocks and private equity, but positively correlated to U.S. broad fixed income.
Since REITs and unlisted real estate returns had high correlations with each other but relatively low correlations with listed equity return, they provide the well-known diversification benefits associated with the real estate asset class.
Reporting lags for illiquid assets
Reporting lag is the time between when an underlying asset changes value and when that change in value is reported to the pension fund or investor. Illiquid assets like unlisted real estate and private equity have reporting lags.
The unique CEM dataset allowed adjustment for illiquid asset reporting lag at the individual fund level. Typically this type of adjustment is made using a single assumption applied to all investment returns in an illiquid asset class.
In addition to improving the accuracy of the returns, volatilities and correlations, adjusting for reporting lag at the fund portfolio level allows the observation of the distribution of reporting lags across funds The distribution of reporting lags associated with private equity is fairly tightly clustered around 3 to 5 months. However, the distribution of valuation reporting lags for unlisted real estate shows no such clustering and has a bimodal distribution with peaks at 6-8 months and 14–16 months
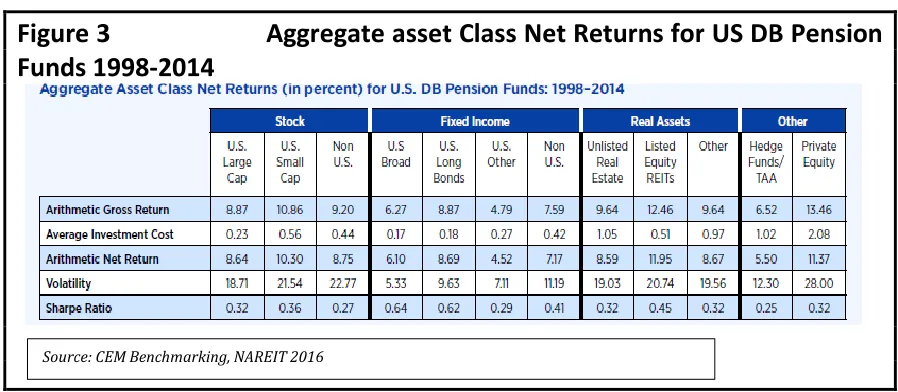
Summary Results
[image:15.595.82.531.494.690.2].
Figure 3 Aggregate asset Class Net Returns for US DB Pension
Funds 1998-2014
15
Consilia Capital www.consiliacapital.com
Research Compendium for 2016
2)
Listed Infrastructure
a)
Listed Infrastructure Funds in the Consilia Capital
database – A Brief Overview
With an increasing number of institutional investors consolidating their real estate and infrastructure departments, there is clearly “end investor” interest in allocating to both (and a combination of ) the asset classes. We have increased the number of infrastructure funds in our database this month as part of an increased ongoing commitment to this area. . Following on from last month’s feature on the Norges Report on real estate and infrastructure we believe that the number of listed infrastructure funds is likely to increase, mirroring the continued appetite for unlisted infrastructure funds. We also believe that real estate and infrastructure funds are predominantly complementary rather than substitutable, and that increased number of academic studies will focus on the benefits of combining the two asset classes. At this stage we have not included “Real Asset” Funds in our initial analysis as we are trying to highlight specific similarities and differences between real estate and infrastructure funds.
Size
As a first step we provide a guide to the funds that we currently have in our database. As always, this is a work in progress, and will be refreshed and updated on a regular basis.
The cut-off point we have determined for size classification is >US$500m for Large, >$US100m <US$500m for medium and <US$100m for small. How does this compare to real estate funds?
The table below suggests that it is currently around 12% of the size as measured by Aum and 27% by number of the listed real estate funds sector.
At this stage it is worth noting that our real estate funds database has taken a considerable period of time, and interaction with managers, to refine. Therefore the composition of our database for infrastructure funds will definitely change over time. The purpose of this month’s brief overview is to provide a decent starting point for further analysis.
Volatility
Our next step is to look at volatility. The table below shows the average, maximum and minimum per size band.
Mandate Number AUM US $m Max AUM US$m
Infrastructure large 16 24,423 4,717
Infrastructure medium 38 8,936 464
Infrastructure small 110 2,872 98
TOTAL 164 36,231
Mandate Number AUM US $m Max AUM US$m
US Real estate 146 174,394 26,990
European Real estate 82 16,656 1,421
Global REIT 69 23,835 11,008
Global Real Estate 203 62,089 4,454
Asian Real estate 48 4,653 2,553
Japan Real Estate 56 26,789 3,762
16
Consilia Capital www.consiliacapital.com
Research Compendium for 2016
How does this compare to real estate funds?
At first glance there does not appear to be a significant difference in the volatility of returns, reflecting a similar equity market contribution to volatility.
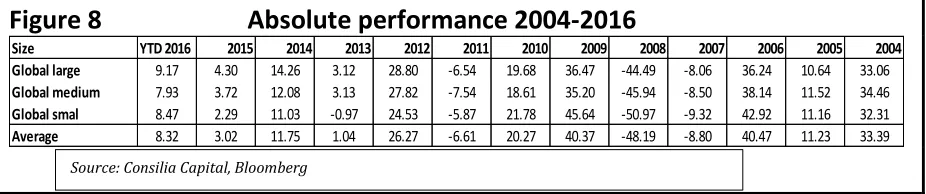
Returns from the Peak and Trough
Intuitively we would expect that, on average, Infrastructure Funds have performed better than real estate funds from the previous Peak (mid 2007) and worse since the trough (March 2009) .
As can be seen , even after the pullback of the last few months real estate securities funds have performed exceptionally well since the trough, outpacing Infrastructure , although a number of real estate funds mandates (particularly Europe) are still in negative territory compared to peak levels.
Initial Conclusions
Although significantly smaller, and less developed as a sector than real estate, infrastructure funds appear to have noticeably complementary characteristics, and our next study will focus on the benefits of combining the two in a mixed asset portfolio.
Mandate Volatility % Max % Min %
Infrastructure large 14.95 19.46 10.97
Infrastructure medium 17.44 37.10 7.15
Infrastructure small 17.33 37.95 2.56
Mandate Volatility % Max % Min %
US Real estate 17.07 50.67 2.17
European Real estate 17.96 24.76 6.17
Global REIT 17.41 25.95 9.30
Global Real Estate 14.92 32.47 1.65
Asian Real estate 17.91 56.21 4.58
Japan Real Estate 22.66 36.54 18.37
Mandate Return from Trough % Return from Peak %
Infrastructure Index 184.73 65.73
Infrastructure large 196.03 55.27
Infrastructure medium 142.30 24.39
Infrastructure small 102.22 20.53
Average 156.32 41.48
Mandate Return from Trough % Return from Peak %
US Real estate 359.07 15.10
European Real estate 162.91 -21.63
Global REIT 221.56 -5.16
Global Real Estate 235.04 -8.67
Asian Real estate 151.86 -1.84
Japan Real Estate 182.23 37.31
Global Index 258.76 4.33
Global REIT Index 243.78 -13.97
17
Consilia Capital www.consiliacapital.com
Research Compendium for 2016
2) Listed Infrastructure
b) Listed Infrastructure as an Asset Class
For the last few months we have focused on research relating to the listed real estate as a separate asset class ahead of the GICS classification of real estate as a separate sector (the 11th) starting 1st September. This month we turn our attention to listed infrastructure. We have published previously on the benefits of combining listed and unlisted infrastructure exposure (2014), and it is clear that there is significant interest in the sector, with a wide variety of listed infrastructure funds available (see our February 2016 Monthly). Against this positive news it is interesting to note that despite the recommendation of the detailed Expert Report to the Norwegian Government Pension Fund on Real Estate and Infrastructure (key findings are in our January 2016 Monthly) the implementation decision was to have no dedicated allocation to infrastructure and to increase the maximum allocation to real estate. There does, therefore, appear to be some debate as to the exact role of (listed) infrastructure in portfolio construction. As part of this ongoing debate this month we feature a
recently published paper from the EDHEC Infrastructure Institute. We have produced a summary of the findings here. For detailed findings, and in particular risk and return evidence, please see the full paper which can be found at the EDHEC Infrastructure Institute website:
http://edhec.infrastructure.institute/?page_id=1987
Searching for a Listed Infrastructure Asset Class
Mean- variance spanning tests of 22 listed infrastructure proxies
Research Paper by the EDHEC Infrastructure Institute June 2016
Authors:
Frédéric Blanc-Brude Director of the EDHEC Infrastructure Institute–Singapore who represents EDHEC Business School on the Advisory Board of the Global Infrastructure Facility of the World Bank.
Tim Whittaker Associate Research Director at EDHEC Infrastructure Institute-Singapore and Head of Data Collection.
Simon Wilde Ph.D. candidate at the University of Bath, UK and a Senior Managing Director at Macquarie Capital London.
Introduction and Background
In this paper, the authors ask the question:Does focusing on listed infrastructure stocks create diversification benefits previously unavailable to large investors already active in public markets?
This question arises from what they call the”infrastructure investment narrative” (Blanc-Brude, 2013), a set of investment beliefs commonly held by investors about the investment characteristics of infrastructure assets. In this narrative, the “infrastructure asset class” is less exposed to the business cycle because of the low price-elasticity of infrastructure services. Furthermore, the value of these investments is expected to be mostly determined by income streams extending far into the future, and should thus be less impacted by current events.
18
Consilia Capital www.consiliacapital.com
Research Compendium for 2016
Empirically, there are at least three reasons why this view requires further examination:
1. Most existing research on infrastructure has used public equity markets to infer findings for the whole infrastructure investment universe, but the authors believe robust and conclusive evidence is not forthcoming in existing papers;
2. Index providers have created dedicated indices focusing on this theme and a number of active managers propose to invest in ”listed infrastructure” arguing that it does indeed constitute a unique Asset class;
3. Listed infrastructure stocks are often used by investors to proxy investments in privately held (unlisted) infrastructure equity, but the adequacy of such proxies remains untested.
The existence of a distinctive listed infrastructure effect in investors’ portfolio would support these views. In the negative, if this effect cannot be found, there is little to expect from listed infrastructure equity from an asset allocation (risk/reward optimisation) perspective and maybe even less to learn from public markets about the expected performance of unlisted infrastructure investments.
Methodology
The authors test the impact of adding 22 different proxies of “listed infrastructure” to the portfolio of a well-diversified investor using mean-variance spanning tests. They focus on three definitions of “listed
infrastructure” as an asset selection scheme:
1. A ”naïve”, rule-based filtering of stocks based on industrial sector classifications and percentage income generated from pre-defined infrastructure sectors (nine proxies);
2. Existing listed infrastructure indices designed and maintained by index providers (twelve proxies);
3. A basket of stocks offering a pure exposure to several hundred underlying projects that correspond to a well-known form of infrastructure investment defined – in contrast with the two previous cases – in terms of long-term public-private contracts, not industrial sectors (one proxy).
Employing the mean-variance spanning tests originally described by Huberman and Kandel (1987) and Kan and Zhou (2012), they test the diversification benefits of these proxies of the listed infrastructure effect.
Data
The data used and the criteria applied to construct these proxies for listed infrastructure and the market reference portfolio was as follows:
1) Listed infrastructure companies.
19
Consilia Capital www.consiliacapital.com
Research Compendium for 2016
GIC code by Worldscope. This is a crude measure as it relies on the continuous updating of the revenue codes by Worldscope, as well as assuming that GIC or SIC codes represent infrastructure activities.
Setting a minimum infrastructure sector revenue threshold to 75% and 90%, yielded 650 and 554 stocks, respectively.
U.S. dollar price and total returns were sourced from Datastream using the methodology described in Ince and Porter (2006). The firms thus identified comprised at most 12%, 7% and 6.5% of the MSCI World market value as at 31 December 2014, for the 50%, 75% and 90% infrastructure revenue thresholds, respectively.
2) As hoc listed infrastructure indices
The basic requirements to be included in listed infrastructure indices created by index providers are not very different from the naïve selection scheme described above.
They include: 1) being part of a broader index universe (usually that of the infrastructure universe of the index provider); and, 2. a minimum amount of revenue derived from infrastructure activities.
However, minimum revenue requirements and the definition of infrastructure activities are set differently by each index provider, adding what could amount to “active views”, to a rule-based scheme.
The authors tested two groups of listed infrastructure indices: a set of global indices and one designed to represent the U.S. market only.
Global indices provide a direct comparison with the naïve approach described above, while a U.S.-only perspective allows more controls and granularity when designing a reference portfolio of asset classes or factors to test the mean-variance spanning of listed infrastructure indices.
Global Infrastructure Indices
They included seven global infrastructures indices and four U.S. infrastructure indices:
1) Dow Jones Brookfield Global Infrastructure Index 2) FTSE Macquarie Global Infrastructure Index; 3) FTSE Global Core Infrastructure;
4) MSCI World Infrastructure Index; 5) MSCI ACWI Infrastructure Capped; 6) UBS Global Infrastructure and Utilities; 7) UBS Global 50=50 Infrastructure and Utilities.
U.S. infrastructure indices
The U.S. infrastructure indices included in this study are: 1) FTSE Macquarie USA Infrastructure Index; 2) MSCI US Infrastructure Index;
3) MSCI USA Infrastructure 20/35 Capped Index; and, 4) Alerian MLP Infrastructure Index.
3) Listed baskets of contracted infrastructure projects
The PFI portfolio consisted of
1. HSBC Infrastructure Company Ltd (HICL) 2. John Laing Infrastructure Fund Ltd (JLIF) 3. GCP Infrastructure Ltd (GCP)
4. International Partnerships Ltd (INPP)
20
Consilia Capital www.consiliacapital.com
Research Compendium for 2016
These firms are solely occupied with buying and holding the equity and quasi-equity of PFI (private finance initiative) project companies in existence in the U.K. and that of similar firms mostly involved in delivering so-called availability-payment infrastructure projects, by which the public sector pays a pre-agreed income to the project firm on a regular basis in exchange for the construction/development, maintenance and operations of a given infrastructure project given a pre-agreed output specification and for several decades.
These PFI project companies in question do not enter into any other activities during their lifetime, and solely deliver the contracted infrastructure and associated services while repaying their creditors and investors. As such, they give access to a “pure” infrastructure project cash flow, representative of the underlying nature of the PFI business model.
The firms in the PFI portfolio can be considered useful proxies of a portfolio of PFI equity investments. While the project companies are typically highly leveraged, the firms in the PFI portfolio do not make a significant use of leverage. Hence, as a group, the authors believe they can be considered to be representative of a listed basket of PFI equity stakes.
Evidence suggest that the PFI portfolio possesses different characteristics to the other listed infrastructure portfolios examined. Its Sharpe ratio was high but its maximum drawdown is much lower than the market reference. Indeed, the maximum drawdown for the PFI portfolio was also much lower than the FTSE Macquarie Europe infrastructure index, another listed infrastructure index focused solely on European markets. The combination of high risk-adjusted performance with low drawdown risk is particularly striking in the total return case. (See full paper for detailed findings).
4) Reference Assets
The authors use two types of reference allocations to test the impact of adding listed infrastructure to an investor’s universe: 1) an asset class-based allocation and 2) a factor-based allocation.
Global asset class-based reference portfolio
A “well diversified investor” in the traditional albeit imprecise meaning of the term can be expected to hold a number of different asset classes, including:
Global Fixed Interest proxied by JP Morgan Global Aggregate Bond Index;
Commodities proxied by The S&P Goldman Sachs Commodity Index;
Real Estate proxied by MSCI World Real Estate Index;
Hedge Funds proxied by Dow Jones Credit Suisse Hedge Fund Index; and,
OECD and Emerging Market Equities proxied by MSCI World and MSCI Emerging Market Indices, respectively.
Global factor-based reference portfolio
Consistent with prior research, the factors in this study are constructed from stock and bond market indices. They follow Bender et al. (2010), Ilmanen and Kizer (2012) and Bird et al. (2013) to build Market, Size, Value, Term and Default factors.
The Market factor is the excess return of the MSCI U.S. and MSCI Europe indices.
The Size factor (SMB) is calculated by taking the difference between the simple average of MSCI Small Value and Growth indices and the simple average of MSCI Large Value and Growth Indices.
The Value factor (HML) is constructed by obtaining the difference between simple average of MSCI Small, Mid and Large Value indices and simple average of MSCI Small, Mid and Large Growth Indices.
The Term factor is estimated by taking the difference between the returns of the U.S. Government 10 year index and S&P U.S. Treasury Bill 0-3 Index.
21
Consilia Capital www.consiliacapital.com
Research Compendium for 2016
Findings
Stylised findings include:
1. The 22 tests of listed infrastructure reveal little to no robust evidence of a ”listed infrastructure asset class” that was not already spanned by a combination of capital market instruments and alternatives, or by a factor-based asset allocation;
2. The majority of test portfolios that improve the mean-variance efficient frontier before the GFC fail to repeat this feat post-GFC. There is no evidence of persistent diversification benefits;
3. Of the 22 test portfolios used, only four manage to improve on a typical asset allocation defined either by traditional asset class or by factor exposure after the GFC and only one is not already spanned both pre- and post-GFC;
4. Building baskets of stocks on the basis of their SIC code and sector-derived income fails to generate a convincing exposure to a new asset class.
5. Thus, the authors believe benchmarking unlisted infrastructure investments with thematic (industry-based) stock indices is unlikely to be very helpful from a pure asset allocation perspective i.e. the latter do not exhibit a risk/return trade-off or betas that large investors did not have access to already.
Overall, they do not find persistent evidence to support the claims that listed infrastructure is an asset class. In other words, any “listed infrastructure” effect was already spanned by a combination of capital market instruments over the past 15 years in Global, US and UK markets.
They believe defining infrastructure investments as a series of industrial sectors and/or tangible assets might be fundamentally misleading. They find that such asset selection schemes do not create diversification benefits, whether reference portfolios are structured by traditional asset classes or factor exposures.
They conclude that what is typically referred to as listed infrastructure, defined by SIC code and industrial sector, is not an asset class or a unique combination of market factors, but instead cannot be persistently distinguished from existing exposures in investors’ portfolios, and that expecting the emergence of a new or unique “infrastructure asset class” by focusing on public equities selected on the basis of industrial sectors is unlikely to be very useful for investors
Thus, they claim that asset owners and managers who use the common “listed infrastructure” proxies to benchmark private infrastructure investments are either misrepresenting (probably over-estimating) the beta of private infrastructure, and usually have to include various “add-ons” to such approaches, making them completely ad hoc and unscientific.
Defining Infrastructure Differently
Their tests also tentatively suggest a more promising avenue to “find infrastructure” in the public equity space: focusing on underlying contractual or governance structures that tend to maximise dividend payout and pay dividends with great regularity, such as the public-private partnerships (PPPs) or master limited partnerships (MLPs) models. They find that the mean-variance frontier of a reference investor can be improved using these vehicles.
22
Consilia Capital www.consiliacapital.com
Research Compendium for 2016
depends on how”infrastructure” is defined and understood as an asset selection scheme. Under the third definition of infrastructure, which focuses on the relationship-specific and contractual nature of the
infrastructure business, they find that listed infrastructure may help identify exposures that have at least the potential to persistently improve portfolio diversification on a total return basis. This effect is driven by the regularity and the size of dividend payouts compared to other corporations, infrastructure or not.
What determines this ability to deliver regular and high dividend payouts is the contractual and governance structure of the underlying businesses, not their belonging to a given industrial sector. Bundles of PPP project companies or MLPs behave differently than regular corporations i.e. their ability to retain and control the free cash flow of the firm is limited and they tend to make large equity payouts. In the case of PPP firms, as Blanc-Brude et al. (2016) show, they also pay dividends with much greater probability than other firms. They believe that going beyond sector exposures and focusing on the underlying business model of the firm is more likely to reveal a unique combination of underlying risk factors. However, it must be noted that the relatively low aggregate market capitalisation of listed entities offering a ”clean” exposure to infrastructure ”business models” as opposed to ”infrastructure corporates” may limit the ability of investors to enjoy these potential benefits unless the far larger unlisted infrastructure fund universe has similar characteristics.
References
Bender, J., R. Briand, F. Nielsen, and D. Stefek (2010, January). Portfolio of Risk Premia: A New Approach to Diversification. The Journal of Portfolio Management 36(2), 17–25. .
Bird, R., H. Liem, and S. Thorp (2013, April). The Tortoise and the Hare: Risk Premium versus Alternative Asset Portfolios. Journal of Portfolio Management 39(3), 112–122.
Blanc-Brude, F. (2013). Towards efficient benchmarks for infrastructure equity investments.
EDHEC-Risk Institute Publications, 88.
Blanc-Brude, F., M. Hasan, and T. Whittaker (2016, March). Revenue and dividend payout in privately held infrastructure investments. EDHEC Infrastructure Institute Publications March.
Huberman, G. and S. Kandel (1987). Mean-Variance Spanning. The Journal of Finance 42(4), 873–888.
Ilmanen, A. and J. Kizer (2012, April). The Death of Diversification Has Been Greatly Exaggerated. The Journal of Portfolio Management 38(3), 15–27.
Ince, O. S. and R. B. Porter (2006, December). Individual Equity Return Data From Thomson Datastream: Handle with Care. Journal of Financial Research 29(4), 463– 479.
Kan, R. and G. Zhou (2012). Tests of Mean-Variance Spanning. Annals of Economics and Finance 13, 139–187.
23
Consilia Capital www.consiliacapital.com
Research Compendium for 2016
3)
REIT ETFS
a)
The Impact of Leveraged and Inverse ETFs on
Underlying Real Estate Returns
Authors: Qing Bai, Shaun Bond, and Brian Hatch, University of Cincinnati
Published in: Journal of Real Estate Economics 2015, Vol 43 pp 37-66
Abstract
Leveraged and inverse ETFs (LETFs) were introduced in 2006. By 2008 there was concern that the requirement of LETFs to rebalance near the close might have a significant impact on the prices of the stocks in the
underlying indexes. The authors examine the impact of trading activity induced by six real estate-related LETFs on the late-day price dynamics of 63 real estate sector stocks. Through a comparison of sample and control stocks and through a regression model of LETF rebalancing, they find that these LETFs significantly impact the prices of component stocks, increase their volatility and contribute to price momentum.
Rationale for the Relationship
Beginning in 2006, Exchange Traded Fund (ETF) managers began to market funds, leveraged and inverse ETFs (LETFs), that seek to return a multiple of the daily performance of the underlying index. The popularity of LETFs surged in late 2008 and continued to grow post GFC. During the financial crisis of 2007 to 2009, equity markets experienced a huge spike in volatility. Many market participants came to the conclusion that the growth in LETF assets and increased market volatility were related. Because LETFs seek to return a multiple of the index return on a daily basis, the managers must lever their positions and manage their exposure on a daily basis. This daily rebalancing may be in the form of trading the target index component stocks or trading in futures or swaps. Although many market participants and pundits fretted over the impact of LETF rebalancing-related trades on market volatility the Credit Suisse Portfolio and Derivatives Strategy Group issued market commentary on October 13, 2011, in which they cite two factors to contradict the notion that LETFs cause late-day volatility: (1) they estimate that rebalancing volume is too small to have a large impact (2% of dollar volume in the last 30 minutes of the day) and (2) in October and November 2008 (two very volatile months), “the market reversed the intraday trend in the last-hour 40% of the time. The opposite direction to the leveraged ETF trades.” Others such as Morningstar and Index Universe provide evidence that supports these claims.
The Mechanics of a Leveraged ETF and the rebalancing activity
LETFs differ from traditional index ETFs in that they attempt to obtain a multiple of the daily return of an underlying index. Typically, leveraged funds seek to match returns of 2×, 3×, −1×, −2× or −3× the daily return of the specified underlying index. To achieve this leveraged result, funds hold the underlying index constituents, cash, futures and swaps. ProShares, one of the largest providers of LETFs, provides an example of their construction of a 2× S&P 500 LETF.6 In this example, they invest 85% of their assets in the S&P 500 stocks and hold the remainder in cash. They also purchase S&P 500 futures to increase the S&P 500 exposure to 110% and finally enter into long equity index swaps to achieve the target exposure of 200%. Perusal of the
daily holdings on June 14, 2013 shows real estate index swaps with ten counterparties, cash and investment in all stocks in DJUSRE. In order to match the promised leveraged return, funds must rebalance daily.
24
Consilia Capital www.consiliacapital.com
Research Compendium for 2016
before the end of day t in order to have the appropriate leverage/exposure at the start of day t + 1 in order to deliver their target return. Dave Nadig of IndexUniverse says that “the funds themselves aren’t buying or selling anything. All of the levered and inverse funds in the U.S. get their exposure through total return swaps. . . . someone in this chain of counterparties will be . . . hedging out their risk by putting trades into the actual securities in the market” (Nadig 2011). Based on conversations with market participants, Nadig asserts that “it’s clear they all begin their swap coverage negotiations at different times following 3:00 p.m.” Anecdotal evidence in the financial press indicates that other market participants are aware of the rebalance
requirements of such funds and attempt to exploit this opportunity by trading ahead of the LETFs. It is this combination of front running/predatory trading and LETF rebalancing that is alleged to impart excessive late-day volatility on component prices.
Is Real Estate Different?
While the Credit Suisse report discounts the possibility that LETFs cause market-wide volatility, it does concede that LETF rebalancing may impact smaller sectors and cites anecdotal evidence from the financials, energy and real estate sectors. Management of the component stock firms would allege that these trading tactics lead to inefficient pricing of their shares as much of the order flow is not based on company fundamentals, but on the needs of an LETF to rebalance their exposure at day-end. This is particularly the case for LETFs
written on the real estate sector such as the ProShares Ultra Real Estate long and short ETFs, which are written to track the Dow Jones U.S. Real Estate Index (DJUSRE). The Wall Street Journal (WSJ hereafter) documents that in nearly 60% of the trading days in late 2008 the DJ Equity All REIT Index changed by more than 5%, compared to only 28% of such days for the S&P 500. Many Real Estate Investment Trust (REIT) managers assert that this higher level of real estate sector volatility can be attributed to LETF-related trading.
Key Findings
Using component stocks from DJUSRE, which is the target of multiple LETFs, the authors find that relative to a set of control stocks, component stocks experience increased volatility, increased trading activity and
increased continuation of returns/momentum—all consistent with claims about the impact of LETF rebalancing activity on component stock returns. In particular, this is the first evidence of significantly increased late-day momentum associated with LETF rebalancing demand. When they use a regression to control for other factors that might impact late-day price movements, they find a positive relationship between their proxy for LETF rebalancing and late-day returns in the component stocks—the greater the rebalancing buying (selling) activity the larger (smaller) the returns in the component stock. Not surprisingly, they also find that the magnitude of absolute rebalancing demand is directly related to component
25
Consilia Capital www.consiliacapital.com
Research Compendium for 2016
3) REIT ETFS
b)
Real Estate ETF Fund Flows
This month we take a look at ETF fund flows for US and Global mandates over specific parts of 2016. In particular we are looking at the two most significant periods of sustained and identifiable performance; the final phase of the bond market rally from 11th February to 31st July (Figure 4) which had obvious positive implications for the sector, and then the subsequent decline from end July onwards (Figure 5) as bond yields repriced negatively. The reason for dividing the year in this way is to try and determine the quantum of flows relating to clear market sentiment and understand the relationship between flows and performance.
[image:26.595.66.527.301.536.2]First then the happier days of 1H, and we can see that the US which is the largest listed real estate ETF market had net inflows of US $5.59bn representing 14% of AuM whilst Global ETFs had a net inflow of US$470m representing 3.5%.
Figure 4
Real Estate ETF Flows 11th February to 31
stJuly 2016
It is also noticeable, looking at the table, how insignificant in terms of size and number of funds the other regions are compared to the US and Global mandates. Japan is the third largest geographic mandate and Europe the fourth. Not-withstanding the small size of the sample it is worth mentioning that during this positive of period of performance all regions, with the exception of Europe(including UK) benefitted from net inflows. Despite European ETFs having small outlows, Europe ex UK and indeed UK had positive inflows.
Turning now to the second half of the year as shown in Figure 5 we observe that even though there was a significant decline in the market valuations and indeed investor sentiment there was still a small (+3.2%) net inflow over the period to US Real Estate ETFs. Clearly these figures do have to be taken with some caution as they are shown net (i.e. inflows less outflows), and subject to change on a daily basis. Nonetheless we were surprised that there were positive net flows in the US during this period.
.
Globally, however, it was a different story, and more in line with what we were expecting, with net outflows, albeit only representing 2.6% of AuM. Europe again suffered outflows.
Flow (BLN) AUM (BLN) % of AUM No of Funds
Total 7.44 63.47 11.72% 101
By region
U.S. 5.59 39.82 14.03% 28
Japan 0.81 3.40 23.83% 10
Global 0.47 13.45 3.52% 25
European Reg. ex UK 0.28 1.65 17.03% 3
Canada 0.07 1.15 6.31% 4
Australia 0.07 0.87 7.82% 5
Foreign 0.05 0.19 27.54% 2
South Africa 0.05 0.02 187.16% 3
Switzerland 0.04 0.37 9.77% 2
U.K. 0.01 1.04 1.40% 2
Emerging Market 0.01 0.02 41.34% 3
North American Region 0.01 0.01 113.64% 1
New Zealand 0.00 0.03 7.87% 1
Latin American Region 0.00 0.00 0.00% 1
Mexico 0.00 0.00 0.00% 1
Greater China 0.00 0.01 -4.94% 1
European Region -0.02 1.44 -1.20% 9
26
Consilia Capital www.consiliacapital.com
[image:27.595.65.529.98.360.2]Research Compendium for 2016
Figure 5
Real Estate ETF Flows 31
stJuly to 30
thNovember 2016
Having seen the aggregate flows for each mandate we decided to look at individual ETF flows throughout the full period (Figures 6 and 7), one in the US and one with an International ( Global ex US) mandate. In Figure 6 we show the daily flows (left hand scale and shown as a bar chart) compared to the price (line graph, right hand scale). This broadly confirms the aggregate story that we showed in Figures 4 and 5 for the US, that although price performance deteriorated in the second half, there were no significant net outflows over the period, although it can be seen that the outflows were greater and inflows smaller, than in the first period.
.
Figure 6 Fund Flows and Price Change for US Real Estate ETF - Vanguard
(VNX US) YTD 2016
Flow (BLN) AUM (BLN) % of AUM No of Funds
Total 2.25 86.62 2.60% 101
By region
U.S. 1.79 56.63 3.17% 28
Japan 0.83 4.88 16.94% 10
Canada 0.11 1.58 6.87% 4
U.K. 0.06 0.97 5.84% 2
Foreign 0.03 0.30 9.51% 2
Emerging Market 0.03 0.03 94.84% 3
South Africa 0.02 0.04 51.09% 3
Switzerland 0.02 0.44 4.28% 2
Australia 0.02 1.21 1.54% 5
North American Region 0.01 0.02 52.10% 1
Mexico 0.01 0.00 263.47% 1
New Zealand 0.00 0.04 3.57% 1
Latin American Region 0.00 0.00 0.00% 1
Greater China 0.00 0.01 0.00% 1
European Region -0.08 1.59 -5.20% 9
European Reg. ex UK -0.14 2.27 -6.00% 3
Global -0.44 16.62 -2.64% 25
60 65 70 75 80 85 90 95
-400 -300 -200 -100 0 100 200 300 400 500
Price (US$) Flow (US$m)
Source: Consilia Capital, Bloomberg
[image:27.595.82.530.462.736.2]