The role of social media data in operations and production management Hing Kai Chan1, Ewelina Lacka2, Rachel W. Y. Yee3, Ming K. Lim4
1 Nottingham University Business School China, University of Nottingham Ningbo China, Ningbo 315100, China
2 Business School, University of Strathclyde, 16 Richmond Street, Glasgow G1 1XQ, UK 3Institute of Textiles and Clothing, Hong Kong Polytechnic University,
Hung Hom, Kowloon, Hong Kong
4 Derby Business School, University of Derby, Kedleston Road, Derby, DE22 1GB, UK
Abstract
Social media data contain rich information in posts or comments written by customers. If those data can be extracted and analysed properly, companies can fully utilise this rich source of information. They can then convert the data to useful information or knowledge, which can help to formulate their business strategy. This cannot only facilitate marketing research in view of customer behaviour, but can also aid other management disciplines. Operations management (OM) research and practice with the objective to make decisions on product and process design is a fine example. Nevertheless, this line of thought is under-researched. In this connection, this paper explores the role of social media data in OM research. A structured approach is proposed, which involves the analysis of social media comments and a statistical cluster analysis to identify the interrelationships amongst important factors. A real-life example is employed to demonstrate the concept.
The role of social media data in operations and production management
1. Introduction
Operations management (OM) has a long history (e.g. from the construction of ancient buildings thousand years ago, to military operations in the last couple of hundred of years), but modern OM research has its root in scientific management approach such as Taylorism (Mortenson, Doherty, and Robinson 2015) and its history since then is slightly longer than a century (Piercy 2012). Along this line of thought, traditional OM research is highly dominated by mathematical/ analytical-driven approaches, which later on, after the Second World War, evolved to operations research-based approaches (Fortun and Schweber 1993). Despite this highly mathematical-driven approaches in the last century there are many studies using different, non-mathematical, research approaches in OM discipline. Those studies incorporate other factors such as organisation behaviour in OM research studies. These studies include, but of course are not limited to, qualitative research techniques focusing on empirical data collection from interviews (Voss, Tsikriktsis, and Frohlich 2002), quantitative approaches such as using questionnaire survey to collect empirical data confirming new research models (Frohlich 2002), and so on. A more recent trend is the data-driven approach and hence, how to handle unstructured data are an emerging theme (Mortenson, Doherty, and Robinson 2015). Social media data are an example of such unstructured data.
Increasing popularity of Facebook, Twitter and other social media platforms has led to the availability of huge amount of valuable information. As a consequence, those social media platforms have generated a good source of data which are available openly to the public, and of course to researchers. In short, social media websites of companies are the platforms for customers to exchange their comments, probably with the organisations’ interests (Xiang and Gretzel 2010). The information is particularly useful for analysing consumer behaviour (Mostafa 2013; Turri, Smith, and Kemp 2013), which can then help formulate business strategy (Ngai, Xiu, and Chau 2009). Nevertheless, how to make good use of the information is a challenge. Furthermore, application of the social media data for OM research has not been well attended. This can be verified by a simple simultaneous search of two keywords ‘social media’ and ‘operations management’ in Google Scholar. Having said that, social media is useful in many OM-related disciplines. This will be discussed in more detail in Section 2.
plug-in provides a channel to download associated social media data for further analysis by the software NVivo.
The rest of this paper is organised as follows. Section 2 reviews the background of mining social media data and the associated studies in relation to operations management. It is found that this area is under studied. Section 3 reveals the research method of this paper, including how to access social media data, and the procedures to analyse the data. Section 4 then summarises the results from the content analysis and cluster analysis. It also presents the findings. Section 5 concludes this paper.
2. Related studies on Utilising Social Media Data
Social media has existed in various forms even before the introduction of the Internet, and hence are not new. However, currently the term ‘social media’ is mostly referred to the online applications that allow users exchanging their comments. Facebook and Twitter are typical examples of such social media platforms, although the latter may be specifically referred to as microblog (Kwak et al. 2010). This is linked to the development of Web 2.0 (Wirtz, Piehler, and Ullrich 2013), in which ‘content and applications are no longer created and published by individuals, but instead are continuously modified by all users in a participatory and collaborative fashion’ (Kaplan and Haenlein 2010). In this research, the term ‘social media’ is referred to such online applications. Usage of such applications has been soaring dramatically at an unbelievably explosive rate, which also means that quoting how many people who have registered with Facebook, for example, is quite meaningless as the number will become dated very quickly.
With the above backdrop, social media data, which are openly available to the public and are free of charge, can be good source of information for both industrial practitioners and researchers. Not surprisingly those data have been already utilised in the marketing domain in the last few years. For example, social media data have changed the promotion mix in marketing communication (Mangold and Faulds 2009), simply because consumer-to-consumer communication is easier with the help of social media websites. Travellers are convenient to make use of social media websites to search for travelling information online, which reduces the reliance on travel agencies and hence, the impact of the associated marketing activities (Xiang and Gretzel 2010). This is equally applicable to other domains such as the health care sector (Thackeray et al. 2008), public relations (Eyrich, Padman and Sweetser 2008) Wang (2015) demonstrated that social media is one of the features that affect the positioning of smartphone via a case study. Despite the potential benefits of utilising social media data, companies still fail to extract the full capabilities of such websites (Culnan, McHugh, and Zubillaga 2010).
Like other data, usage of social media data is not free of criticisms. Marketers find it difficult to quantify the return of investment in social media websites; moreover the associated analysis is also difficult, if not impossible, to assess, especially if traditional approaches are employed (Hoffman and Fodor 2010). Another challenge is the subjectivity of the data. Social media websites are essentially the platforms to exchange word-of-mouth information electronically (Litvin, Goldsmith, and Pan 2008; Jansen et al. 2009; Shih, Lai, and Cheng 2013). This, on the one hand, can positively affect online consumption decision (Cheung, Lee, and Rabjohn 2008), but on the other hand, this may add additional uncertainty regarding the credibility and persuasiveness of the information being used (Cheung et al. 2009; Zhang, Craciun, and Shin 2010). Therefore, research extracting high quality information from social media data are very popular especially in the computer science domain (e.g. Agichtein et al. 2008; Gilbert and Karahalios 2009; Asur and Huberman 2010). The scholars of this strand of research aim to develop intelligent data mining approaches in so doing. For example, Asur and Huberman (2010) developed an approach to better forecast future events based on Twitter data. These algorithms are of significant academic value, but may not be user-friendly enough in real-life applications due to their complexity.
In this connection, this research aims to address three gaps identified above. First, the application of this research is on a typical OM issue, namely, product development based on the high level OM measurements from social media websites. Second, the proposed qualitative content and statistical cluster analysis are employed to reveal the factors and their interrelationship from the social media data. This can help quantifying the qualitative data for further applications. Finally, the proposed approach can also help alleviate the subjectivity of the social media data through the statistical analysis. This is because the approach looks into high level aggregate data, rather than individual customers’ comments separately. Of course, this cannot completely remove such subjectivity, but can definitely help to reduce the associated negative impact. The proposed approach is practical yet statistically robust enough for real-life applications. Details are presented in Section 3.
3. Research Method
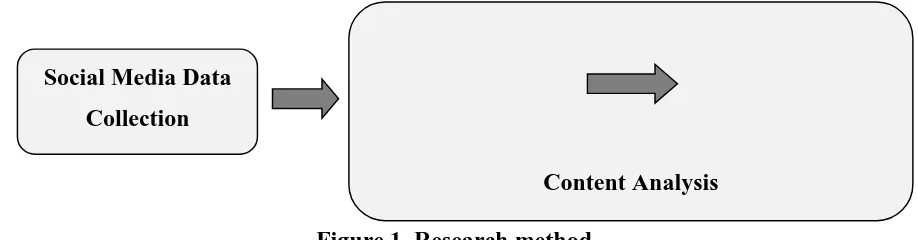
[image:5.612.79.538.442.562.2]For the purpose of this research data from Facebook, one of the most popular social media platforms, was used in order to demonstrate the procedures for utilisation of social media data in OM research. To retain focus on product development as the subject of this research, it was decided to employ Samsung’s mobile Facebook page in relation to the launch of the Samsung smartphone, Samsung Galaxy S4 in late April 2013. That was the latest model when the research was conducted. As it was mentioned in the introduction to this paper, the data were collected with the help of NCapture, a plug-in for NVivo 10. Four months of data (10 June–10 September 2013) in the form of consumers’ comments were downloaded for analysis. The content analysis was carried out using conceptual analysis and then relational analysis with the help of statistical cluster analysis, as visualised in the flow diagram below (Figure 1). A detailed discussion of data collection process and procedure for data analysis is provided next.
Figure 1. Research method
Many research studies associated with social media research linked to the social media metrics, not the data themselves. For example, Ralston et al. (2014) made use of such metrics of tweeters (e.g. number of messages per day, number of followers, etc.) to analyse the use of social media by surgical colleges. Rui, Liu, and Whinston (2013) tried to classify tweets by dividing tweets into intention tweets and sentiment tweets. In those students; however, the ‘content’ of the social media data have not been explored. Perhaps the first attempt to explore the value of social media content was made by Denecke and Nejdl (2009). The researchers aimed to evaluate how valuable medical social media data is. To reach this objective they carried out content analysis of health-related information provided
Social Media Data Collection
Conceptual Analysis
Relational Analysis
on social media sites (e.g. blogs and Wikis). Based on the analysis Denecke and Nejdl (2009) distinguish between informative and affective comments and classified social media sites in accordance to content posted. The present study aims to make a step further. Specifically in this study content, analysis is employed to convert social media data into quantifiable factors and then retrieve the relationship between those factors. Following the proposed approach it would be possible to make use of social media data for further applications (e.g. new product development) and thus reveal a true value of social media data
3.1 Data collection
Data for this study was accessed from the Samsung mobile Facebook page.1 It consisted of recently posted comments by Facebook users on Samsung mobile Facebook page, selected and captured as a data-set using NCapture for NVivo 10. This data includes consumers’ comments from 10 June to 10 September 2013. Overall 128,371 comments were downloaded. The researchers then searched for comments including ‘4’. Finally, posts were skimmed for comments related to Samsung Galaxy S4. Only comments posted in English language were considered for analysis, comments posted in any other language but English were ignored.
3.2 Content analysis
For the purpose of this research two general categories of content analysis were employed: conceptual analysis and relational analysis. The conceptual analysis was used to establish the existence and frequency of concepts/codes in the data. The relational analysis building on conceptual analysis aided examination of the relationships amongst concepts/codes in the data. The approach of conducting conceptual analysis and relational analysis is discussed in Section 3.2.1.
3.2.1. Conceptual analysis
The conceptual analysis involves quantifying the occurrence in the data-set of concept/codes chosen for examination, which can be both implicit and explicit in nature. As data used for the purpose of this research comes from a social media website where users freely post their comments, the data gathered seems to be implicit and hence it is subject to limitations previously discussed in Section 2.
Having clearly defined concepts/codes, the coding process was carried out. The coding was based on selective reduction of comments into meaningful units which then were coded according to previously defined concepts/codes. Overall 1800 items were selected for final analysis (see Table 2). This step is essential text mining process, which ‘attempts to identify patterns in the text and predict outcomes’ (Buddhakulsomsiri et al. 2006).
Concept/ Code Item Label Comment
Speed
Delivering the product to the consumer as soon as possible
S1 Questions regarding product introduction date
Dependability Doing things on time as
promised D1
Questions regarding the delivery update of update
Developing
trustworthiness D2
Comments regarding consumers’ willingness/ unwillingness to purchase the product
Using effective
equipment D3 -
Developing effective
communication D4
All kinds of questions asked by consumers and help requests
Flexibility
Being able to change operations to fulfil new requirements
F1
Comments suggesting introduction of the product and its features
Being able to introduce new products or modify existing products
F2
Comments suggesting improvement of the product and its features
Quality Meeting expectations Q1
Consumers’ statements outlining their satisfaction/ dissatisfaction with the product related to consumers’ expectations
Fulfilling requirements Q2
Comments regarding product’s features and problems encountered due to faulty features
Maintaining effective
communication Q3 -
Doing things right Q4
Comments concerning satisfaction/ dissatisfaction (e.g. I like S4)
Cost
Doing things
economically at low price
C1
Lead time Production time L1 Questions regarding product update
Table 1. Definition of concepts/ codes
Concept/ Code- Item Label No of
References Speed- Delivering the product to the consumer as soon as
possible S1 93
Dependability- Doing things on time as promised D1 25
Dependability- Developing trustworthiness D2 148
Dependability- Using effective equipment D3 0
Dependability- Developing effective communication D4 456 Flexibility- Being able to change operations to fulfil new
requirements F1 13
Flexibility- Being able to introduce new products or modify
existing products F2 106
Quality- Meeting expectations Q1 139
Quality- Fulfilling requirements Q2 366
Quality- Maintaining effective communication Q3 0
Quality- Doing things right Q4 287
Cost- Doing things economically at low price C1 127
[image:8.612.90.527.70.411.2]Lead time- Production time L1 40
Table 2. Number of clusters 3.2.2. Relational analysis
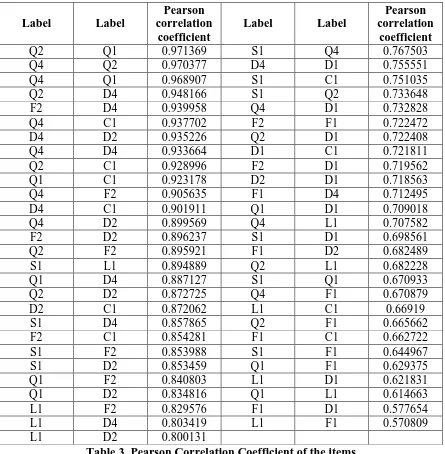
As mentioned before building on conceptual analysis, the relational analysis was conducted to examine relationships amongst concepts/codes. In order to statistically examine these relationships, the cluster analysis was conducted and Pearson correlation coefficient test was run. The results of cluster analysis and Pearson correlation coefficient test are discussed next.
Pearson correlation coefficient is a typical Euclidean distance-based measurement for similarity test. Apart from this index, there are other alternative tests that can be employed to measure relationship between concepts/codes. For example, cosine-based similarity (Silva et al. 2013; Xia, Zhang, and Li 2015) or adjusted cosine similarity (BarragánsMartínez et al. 2010; Birtolo and Ronca 2013), to list a few. Pearson correlation coefficient is adopted in this study because it is a built-in function in NVivo 10, software used for cluster analysis. The test is sufficient for demonstration purpose, but future research is encouraged to compare the results obtained from different similarity measures.
4. Results and Discussions
social media data are simply too big to be handled the management still requires the strategic understanding of the analysis. Therefore, cluster analysis is in its nature a statistical classification tool that can help researchers to classify a large data-set into a number of subsets, which are sometimes referred to as objects (Ketchen and Shook 1996). It is very useful, for instance, for marketing research to analyse a data-set without prior assumptions of the relationships of the factors of concern (Punj and Stewart 1983). Equally important is the reduction process of the number of factors of our concern (Hair et al. 2010). This is analogous to factor analysis. Above-mentioned benefits will be showcased in this section.
Following the procedures outlined in Section 3, clusters of important OM criteria (as shown in Table 2) in relation to the consumers’ comments on the chosen product can be formed. Figure 2 depicts the dendrogram of the analysis. Dendrogram is a tree-like graphical representation to display the results generated from cluster analysis (Hair et al. 2010). This is sometimes called ‘classification tree’. In the dendrogram, similar items, factors or in this case concepts/codes are ‘clustered’ together in terms of the similarity against other factors, and vice versa so that different items are ‘separated’ by distance. In other words, highly correlated factors are grouped together as a hierarchy of clusters that can facilitate the later decision-making process. This is out of the scope of this paper, but will be addressed briefly
later in this section.
Figure 2. Dendrogram of the cluster analysis
Label Label
Pearson correlation
coefficient
Label Label
Pearson correlation
coefficient
Q2 Q1 0.971369 S1 Q4 0.767503
Q4 Q2 0.970377 D4 D1 0.755551
Q4 Q1 0.968907 S1 C1 0.751035
Q2 D4 0.948166 S1 Q2 0.733648
F2 D4 0.939958 Q4 D1 0.732828
Q4 C1 0.937702 F2 F1 0.722472
D4 D2 0.935226 Q2 D1 0.722408
Q4 D4 0.933664 D1 C1 0.721811
Q2 C1 0.928996 F2 D1 0.719562
Q1 C1 0.923178 D2 D1 0.718563
Q4 F2 0.905635 F1 D4 0.712495
D4 C1 0.901911 Q1 D1 0.709018
Q4 D2 0.899569 Q4 L1 0.707582
F2 D2 0.896237 S1 D1 0.698561
Q2 F2 0.895921 F1 D2 0.682489
S1 L1 0.894889 Q2 L1 0.682228
Q1 D4 0.887127 S1 Q1 0.670933
Q2 D2 0.872725 Q4 F1 0.670879
D2 C1 0.872062 L1 C1 0.66919
S1 D4 0.857865 Q2 F1 0.665662
F2 C1 0.854281 F1 C1 0.662722
S1 F2 0.853988 S1 F1 0.644967
S1 D2 0.853459 Q1 F1 0.629375
Q1 F2 0.840803 L1 D1 0.621831
Q1 D2 0.834816 Q1 L1 0.614663
L1 F2 0.829576 F1 D1 0.577654
L1 D4 0.803419 L1 F1 0.570809
[image:10.612.85.530.70.524.2]L1 D2 0.800131
Table 3. Pearson Correlation Coefficient of the items
coefficient is 0.939958, which is even higher than the L1–S1 pair. This finding is worth investigating and may lead to a new theoretical development and contributions, hopefully.
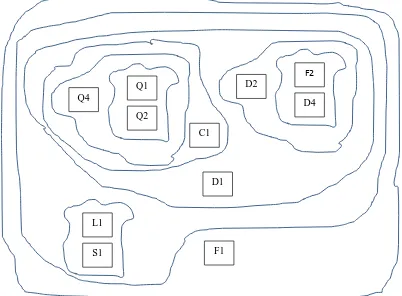
[image:11.612.104.506.236.532.2]Some interesting findings can also be extracted at a higher level. For example, one may wonder if the six dimensions are homogenous measures. From Figure 2 and Table 3, it is safe to conclude that the items under the dimensions can correlate to the items under other dimensions. Quality is one of such dimensions. Above examples demonstrate how the cluster analysis provides preliminary evidence to help researchers identify potential hypotheses (i.e. relationships amongst the factors). Figure 3 is another way to present the dendrogram that can show the nested nature of the clusters as discussed here. The next step is highly dependent on the application domain.
Figure 3. Nested cluster diagram
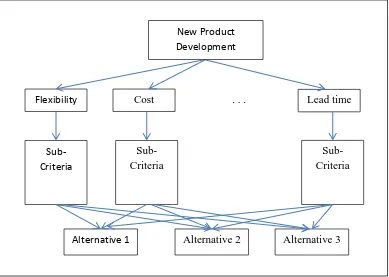
One direct application of the result from this cluster analysis is to help develop decision-making models for operations managers. In this research, the factors are related to new product development. One commonly used framework is the analytic hierarchy process (AHP), which was developed by Saaty (1990). AHP help decision-makers to identify the best alternatives following a hierarchical model, which consists of a number of criteria and sub-criteria for comparisons (Chan and Wang 2013). Taking the mobile phone design in this research as an example, the most direct approach to construct the hierarchy is to put the dimensions at a higher level followed by the items. This is illustrated in Figure 4.
F2
D4 D2
Q1
Q2 Q4
D1
L1
S1 F1
Figure 4. A typical hierarchy for AHP
This construction; however, is often criticised because of the theoretical development of the model. In other words, many researchers would consider the criteria and sub-criteria in Figure 4 as criteria defined arbitrarily. Thus, while comparing Figures 3 and 2, the implication of this research is self-explanatory. For example, Q1, Q2, Q4 and D1 can form one group to replace the quality dimension, D2, D4 and F2 can form another group to replace the Dependability dimension, etc. Hence, a different model can be constructed based on the social media data which are originated from end customers. In addition, the relative importance of conducting the pairwise comparison can be adjusted by the social media statistics. Referring to Table 2, the frequency of occurrence of Q1 and Q2 is 139 and 366, respectively. Obviously Q2 is considered more important than Q1 from consumers’ point of view and the rating can be evaluated using a normalised scale. This helps to address another weakness of the AHP, which relies on expert judgement in the pairwise comparison. This is already a direct extension of this research.
Although this paper makes use of Facebook comments to demonstrate the proposed method, the method itself is not restricted to this type of social media data only. There is literally no limitation on the input data while using the proposed method and hence data from different types of social media platform can be fed into this approach for the analysis. Of course, some types of data may need preprocessing such as formatting or screening due to the diversified nature of social media data. In the future, OM research can collect data from this new channel together with the traditional channels (for example, expert judgement, interviews with production people and so on). The main and possible eventual objective of any business is to satisfy customers, and such social media data will be helpful to incorporate customers’ voice into business strategy. Furthermore, social media data, in
Flexibility Cost . . . Lead time
New Product Development
Sub-Criteria
Sub-Criteria
Sub-Criteria
contrast to other types of secondary data, can be available readily from the Internet. This convenience could be an additional advantage to OM research. This research also demonstrates how social media data can be included in traditional main stream empirical research.
5. Conclusions
This research demonstrates a practical approach to utilise social media data and the focus is put on the OM perspective. The proposed procedures help quantify the qualitative social media data into clusters with similar characteristics for later applications. This is supported by a real-life example, namely, comments related to the model S4 posted on the Samsung mobile Facebook website. The research is multidisciplinary in nature and defines a multimethodological approach to blend social media research and OM research. Although, the main focus of this paper is put on factors related to product development, this research may be evolved to other areas.
The main contribution of this paper is to outline the approach to extract social media for later analysis. As mentioned above, this involves the quantification of social media data. This outcome can then be utilised in many applications, to name a few, empirical questionnaire survey, design of decision-making systems and so on. Nevertheless, the authors take a snapshot view on the data (to be precise, four months of data) for the purpose of this research project. This is a limitation of this research since the social media websites are kept updating and the corresponding data-set keeps growing. To address this, a real-time data crawling support system coupled with the corresponding decision-making tools is required in order to monitor the dynamic comments on a real-time basis.
Another future direction of this research is to blend cluster analysis in this research with fuzzy theory to build decision-making models. Timm et al. (2004) suggested that clusters in the cluster analysis should be formed in a fuzzy manner; otherwise the data must be assigned exactly to one group (i.e. a yes or no question), which sometimes is not realistic. The subjectivity of consumers’ comments adds an extra impreciseness onto the results. This research makes use of the statistical tool to analyse the similarities of the factors, which are drawn from the comments in order to reduce the impact of such subjectivity. Finally, fuzzy theory is a straightforward extension to this research. Fuzzy AHP (Chan et al. 2013) is one example how idea discussed in Section 4 can be developed further. This also helps to address any possible limitations of using social media data, such as its subjectivity.
Reference
Agichtein, E., Castillo, C., Donato, D., Gionis, A., and Mishne, G. (2008). Finding high-quality content in social media. In Proceedings of the International Conference on
Ahlgren, P., Jarneving, B., and Rousseau, R. (2003). Requirements for a cocitation similarity measure, with special reference to Pearson's correlation coefficient. Journal
of the American Society for Information Science and Technology, 54(6), 550-560.
Atkinson, A. B., and Brandolini, A. (2001). Promise and pitfalls in the use of" secondary" data-sets: Income inequality in OECD countries as a case study. Journal of Economic
Literature, 39(3), 771-799.
Asur, S., and Huberman, B. A. (2010). Predicting the future with social media. In Proceedings of the IEEE/WIC/ACM International Conference on Web Intelligence
and Intelligent Agent Technology (WI-IAT), Vol. 1, pp. 492-499.
Barragáns-Martínez, A. B., Costa-Montenegro, E., Burguillo, J. C., Rey-López, M., Mikic-Fonte, F. A., and Peleteiro, A. (2010). A hybrid content-based and item-based collaborative filtering approach to recommend TV programs enhanced with singular value decomposition. Information Sciences, 180(22), 4290-4311.
Birtolo, C., and Ronca, D. (2013). Advances in Clustering Collaborative Filtering by means of Fuzzy C-means and trust. Expert Systems with Applications, 40(17), 6997-7009. Bouguettaya, A., Yu, Q., Liu, X., Zhou, X., and Song, A. (2015). Efficient agglomerative
hierarchical clustering. Expert Systems with Applications, 42(5), 2785-2797.
Buddhakulsomsiria, J., Siradeghyana, Y., Zakarian, A., and Li, X. (2006). Association rule-generation algorithm for mining automotive warranty data. International Journal of
Production Research, 44(14), 2749-2770.
Chan, H. K., and Wang, X. (2013). Fuzzy Hierarchical Model for Risk Assessment:
Principles, Concepts, and Practical Applications. London: Springer.
Chan, H. K., Wang, X., White, G., and Yip, N. (2013). An Extended Fuzzy AHP approach for the evaluation of green product designs. IEEE Transactions on Engineering
Management, 60(2), 327-339.
Cheung, C. F., and Li, F. L. (2012). A quantitative correlation coefficient mining method for business intelligence in small and medium enterprises of trading business. Expert
Systems with Applications, 39(7), 6279-6291.
Cheung, C. M., Lee, M. K., and Rabjohn, N. (2008). The impact of electronic word-of-mouth: The adoption of online opinions in online customer communities. Internet
Research, 18(3), 229-247.
Cheung, M. Y., Luo, C., Sia, C. L., and Chen, H. (2009). Credibility of electronic word-of-mouth: Informational and normative determinants of on-line consumer recommendations. International Journal of Electronic Commerce, 13(4), 9-38. Cowton, C. J. (1998). The use of secondary data in business ethics research. Journal of
Business Ethics, 17(4), 423-434.
Culnan, M. J., McHugh, P. J., and Zubillaga, J. I. (2010). How large US companies can use Twitter and other social media to gain business value. MIS Quarterly Executive, 9(4), 243-259.
Denecke K., and Nejdl W., (2009). How valuable is medical socoal media data? Content analysis of the medical web. Information Science 179, 1870- 1880
Eltantawy, N., and Wiest, J. B. (2011). Social media in the Egyptian revolution: Reconsidering resource mobilization theory. International Journal of Communication, 5, 1207-1224.
Fortun, M., & Schweber, S. S. (1993). Scientists and the legacy of World War II: The case of operations research (OR). Social Studies of Science, 23(4), 595-642.
Frohlich, M. T. (2002). Techniques for improving response rates in OM survey research.
Journal of Operations Management, 20(1), 53-62.
Gilbert, E., and Karahalios, K. (2009). Predicting tie strength with social media. In
Proceedings of the SIGCHI Conference on Human Factors in Computing Systems, pp.
211-220.
Hair, J. F., Black, W. C., Bahin, B. J., and Anderson, R. E. (2010). Multivariate data
analysis: A global perspective. London: Pearson Education.
Hoffman, D. L., and Fodor, M. (2010). Can you measure the ROI of your social media marketing. MIT Sloan Management Review, 52(1), 41-49.
Hu, Y., Du, J., Zhang, X., Hao, X., Ngai, E. W. T., Fan, M., and Liu, M. (2013). An integrative framework for intelligent software project risk planning. Decision Support
Systems, 55(4), 927-937.
Jansen, B. J., Zhang, M., Sobel, K., and Chowdury, A. (2009). Twitter power: Tweets as electronic word of mouth. Journal of the American Society for Information Science
and Technology, 60(11), 2169-2188.
Kaplan, A. M., and Haenlein, M. (2010). Users of the world, unite! The challenges and opportunities of social media. Business Horizons, 53(1), 59–68.
Ketchen, D. J., and Shook, C. L. (1996). The application of cluster analysis in strategic management research: an analysis and critique. Strategic Management Journal, 17(6), 441-458.
Kwak, H., Lee, C., Park, H., and Moon, S. (2010). What is Twitter, a social network or a news media? In Proceedings of the 19th International Conference on World Wide Web, pp. 591-600.
Litvin, S. W., Goldsmith, R. E., and Pan, B. (2008). Electronic word-of-mouth in hospitality and tourism management. Tourism Management, 29(3), 458-468.
Lodorfos, G., & Boateng, A. (2006). The role of culture in the merger and acquisition process: Evidence from the European chemical industry. Management Decision, 44(10), 1405-1421.
Mangold, W. G., and Faulds, D. J. (2009). Social media: The new hybrid element of the promotion mix. Business Horizons, 52(4), 357-365.
Mortenson, M. J., Doherty, N. F., and Robinson, S. (2015). Operational research from Taylorism to Terabytes: A research agenda for the analytics age. European Journal of Operational Research, 241(3), 583-595.
Mostafa, M. M. (2013). More than words: Social networks’ text mining for consumer brand sentiments. Expert Systems with Applications, 40(10), 4241-4251.
Noone, B. M., McGuire, K. A., and Rohlfs, K. V. (2011). Social media meets hotel revenue management: Opportunities, issues and unanswered questions. Journal of Revenue
and Pricing Management, 10(4), 293-305.
Ngai, E.W.T., Xiu, L., and Chau, D.C.K. (2009). Application of data mining techniques in customer relationship management: A literature review and classification. Expert
Systems with Applications, 36(2), 2592-2602.
Punj, G., and Stewart, D. W. (1983). Cluster analysis in marketing research: review and suggestions for application. Journal of Marketing Research, 20(2), 134-148.
Ralston, M. R., O'Neill, S. Wigmore, S. J., and Harrison, E. M. (2014). An exploration of the use of social media by surgical colleges. International Journal of Surgery, 12(12), 1420-1427.
Rui, H., Liu, Y., and Whinston, A. (2013). Whose and what chatter matters? The effect of tweets on movie sales. Decision Support Systems, 55(4), 863-870.
Saaty, T. L. (1990). How to make a decision: the analytic hierarchy process. European
Journal of Operational Research, 48(1), 9-26.
Shih, H. –P., Lai, K. –H., and Cheng, T. C. E. (2013). Informational and Relational Influences on Electronic Word of Mouth: An Empirical Study of an Online Consumer Discussion Forum. International Journal of Electronic Commerce, 17(4), 137-166. Silva, T., Guo, Z., Ma, J., Jiang, H., and Chen, H. (2013). A social network-empowered
research analytics framework for project selection. Decision Support Systems, 55(4), 957-968.
Sørensen, H. T., Sabroe, S., and Olsen, J. (1996). A framework for evaluation of secondary data sources for epidemiological research. International Journal of Epidemiology, 25(2), 435-442.
Thackeray, R., Neiger, B. L., Hanson, C. L., and McKenzie, J. F. (2008). Enhancing promotional strategies within social marketing programs: use of Web 2.0 social media.
Health Promotion Practice, 9(4), 338-343.
Thomas, S. L., and Heck, R. H. (2001). Analysis of large-scale secondary data in higher education research: Potential perils associated with complex sampling designs.
Research in higher education, 42(5), 517-540.
Timm, H., Borgelt, C., Döring, C., and Kruse, R. (2004). An extension to possibilistic fuzzy cluster analysis. Fuzzy Sets and Systems, 147(1), 3-16.
Turri, A. M., Smith, K. H., & Kemp, E. (2013). Developing affective brand commitment through social media. Journal of Electronic Commerce Research, 14(3), 201-214. Voss, C., Tsikriktsis, N., & Frohlich, M. (2002). Case research in operations management.
International Journal of Operations & Production Management, 22(2), 195-219.
Wang, C.-H. (2015). A market-oriented approach to accomplish product positioning and product recommendation for smart phones and wearable devices. International
Journal of Production Research, 53(8), 2542-2553.
Wirtz, B. W., Piehler, R., and Ullrich, S. (2013). Determinants of social media website attractiveness. Journal of Electronic Commerce Research, 14(1), 11-33.
Xia, P., Zhang, L., and Li, F. (2015). Learning similarity with cosine similarity ensemble.
Information Sciences, 307, 39-52.
Xiang, Z., and Gretzel, U. (2010). Role of social media in online travel information search.
Tourism Management, 31(2), 179-188.
Yates, D., and Paquette, S. (2011). Emergency knowledge management and social media technologies: A case study of the 2010 Haitian earthquake. International Journal of
Information Management, 31(1), 6-13.
Zhang, W. Y., S. Zhang, S., Chen, Y. G., and Pan, X. W. (2013). Combining social network and collaborative filtering for personalised manufacturing service recommendation.