NOTES AND COMMENTS
Multi-country loss rates of honey bee colonies during winter 2016/2017 from the
COLOSS survey
Robert Brodschneidera*,1 , Alison Grayb,† , Noureddine Adjlanec, Alexis Ballisd, Valters Brusbardise, Jean-Daniel Charrie`ref , Robert Chlebog , Mary F Coffeyh, Bjørn Dahlei, Dirk C de Graafj , Marica Maja Drazˇic´k, Garth Evansl, Mariia Fedoriakm , Ivan Forsythen , Alesˇ Gregorco, Urszula Grze˛dap, Amots Hetzroniq , Lassi Kaukor , Preben Kristiansens , Maritta Martikkalar , Raquel Martı´n-Herna´ndezt , Carlos Aurelio Medina-Floresu , Franco Mutinelliv , Aivar Raudmetsw, Vladimir A Ryzhikovx, Noa Simon-Delsoy , Jevrosima Stevanovicz, Aleksandar Uzunovaa, Flemming Vejsnæsbb, Saskia Wo¨hlcc, Marion Zammit-Mangiondd and Jirˇı´ Danihlı´kee
a
Institute of Biology, University of Graz, Graz, Austria;bDepartment of Mathematics and Statistics, University of Strathclyde, Glasgow, UK; c
Department of Biology, Universite´ M’hamed Bougara, Boumerde, Algeria;dService Elevage, Chambre d’Agriculture d’Alsace, Strasbourg, France; e
Latvian Beekeepers Association, Jelgava, Latvia;fAgroscope, Swiss Bee Research Center, Bern, Switzerland.;gDepartment of Poultry Science and Small Farm Animals, Slovak University of Agriculture, Nitra, Slovakia;hDepartment of Life Sciences, University of Limerick, Limerick, Ireland;iNorwegian Beekeepers Association, Kløfta, Norway;jHoneybee Valley, Ghent University, Ghent, Belgium;kCroatian Agricultural Agency, Zagreb, Croatia;lWelsh Beekeepers Association, Northop, UK;mDepartment of Ecology and Biomonitoring, Yuriy Fedkovych Chernivtsi National University, Chernivtsi, Ukraine;nThe Agri-Food and Biosciences Institute, Belfast, UK;oAgricultural Institute of Slovenia, Slovenia & Mississippi State University, Poplarville, USA;pFaculty of Veterinary Medicine, Department of Pathology and Veterinary Diagnostics, Warsaw University of Life Sciences, Warsaw, Poland;qThe Volcani Center, Agricultural Research Organisation, Rishon LeZion, Israel;rFinnish Beekeepers Association, Helsinki, Finland;sSwedish Beekeepers Association, Ska¨nninge, Sweden;tCentro de Investigacio´n Apı´cola y Agroambiental de Marchamalo (IRIAF), Marchamalo, Spain;uFaculty of Veterinary Medicine and Animal Science, University of Zacatecas, Zacatecas, Mexico;vIstituto Zooprofilattico Sperimentale delle Venezie, Legnaro (Padova), Italy;wEstonian Beekeepers Association, Tallinn, Estonia;xInstitute for Nature Management, National Academy of Sciences, Minsk, Belarus;yBeekeeping Research and Information Centre, Louvain la Neuve, Belgium; z
Faculty of Veterinary Medicine, Department of Biology, University of Belgrade, Belgrade, Serbia;aaFaculty of Agricultural Sciences and Food, Ss. Cyril and Methodius University, Skopje, Macedonia;bbDanish Beekeepers Association, Sorø, Denmark;ccDLR Fachzentrum fu¨r Bienen und Imkerei, Mayen, Germany;ddDepartment of Physiology & Biochemistry, University of Malta, Msida, Malta;eeDepartment of Biochemistry, Palacky´ University Olomouc, Olomouc, Czech Republic
(Received 22 September 2017; accepted 5 March 2018)
In this short note we present comparable loss rates of honey bee colonies during winter 2016/2017 from 27 European countries plus Algeria, Israel and Mexico, obtained with the COLOSS questionnaire. The 14,813 beekeepers providing valid loss data collectively wintered 425,762 colonies, and reported 21,887 (5.1%, 95% confidence interval 5.0–5.3%) colonies with unsolvable queen problems and 60,227 (14.1%, 95% CI 13.8–14.4%) dead colonies after winter. Addition-ally we asked for colonies lost due to natural disaster, which made up another 6,903 colonies (1.6%, 95% CI 1.5–1.7%). This results in an overall loss rate of 20.9% (95% CI 20.6–21.3%) of honey bee colonies during winter 2016/2017, with marked differences among countries. The overall analysis showed that small operations suffered higher losses than lar-ger ones (p< 0.001). Overall migratory beekeeping had no significant effect on the risk of winter loss, though there was an effect in several countries. A table is presented giving detailed results from 30 countries. A map is also included, showing relative risk of colony winter loss at regional level.
Tasas de pe´rdida de colonias de abejas melı´feras en varios paı´ses durante el invierno 2016/17, segu´n el estudio de COLOSS
En esta breve nota presentamos tasas de pe´rdida comparables de colonias de abejas melı´feras durante el invierno 2016/17 de 27 paı´ses europeos ma´s Argelia, Israel y Me´xico, obtenidas con el cuestionario COLOSS. Los 14.813 apicultores que proporcionaron datos va´lidos de pe´rdidas en conjunto hibernaron 425.762 colonias, y reportaron 21.887 colonias (5.1%, intervalo de confianza del 95% 5.0–5.3%) con problemas irresolubles de reinas y 60.227 colonias (14.1%, IC del 95% 13.8– 14.4%) muertas despue´s del invierno. Adema´s, se solicitaron las pe´rdidas de colonias debido a desastres naturales, que constituyeron otras 6.903 colonias (1.6%; IC del 95%: 1.5 a 1.7%). Esto da como resultado una tasa global de pe´rdida del 20,9% (IC del 95%: 20.6 a 21.3%) de las colonias de abejas melı´feras durante el invierno 2016/17, con marcadas diferencias entre los paı´ses. El ana´lisis general mostro´ que las operaciones pequen˜as sufrieron pe´rdidas ma´s altas que las grandes (p<0.001). La apicultura migratoria en general no tuvo un efecto significativo en el riesgo de pe´rdida invernal, aunque hubo un efecto en varios paı´ses. Se presenta una tabla con resultados detallados de 30 paı´ses. Tambie´n se incluye un mapa que muestra el riesgo relativo de pe´rdida de colonias de invierno al nivel regional.
*Corresponding author. E-mail:Robert.Brodschneider@uni-graz.at
1Conceived the idea for the paper and wrote a first draft.
†Did data processing and editing, all statistical analysis for the results in the table and text, produced the relative risks map, and con-tributed to the text of the article.
©2018 The Author(s). Published by Informa UK Limited, trading as Taylor & Francis Group.
This is an Open Access article distributed under the terms of the Creative Commons Attribution-NonCommercial-NoDerivatives License (http://creativecommons.org/li censes/by-nc-nd/4.0/), which permits non-commercial re-use, distribution, and reproduction in any medium, provided the original work is properly cited, and is not altered, transformed, or built upon in any way.
Journal of Apicultural Research, 2018
Keywords:Apis mellifera; overwinter; mortality; colony losses; monitoring; beekeeping; survey; citizen science
The non-profit honey bee research association COLOSS has established the monitoring of winter losses of man-aged honey bee colonies in many European and some additional countries. As well as thorough modelling of risk factors (van der Zee et al., 2012, 2014), we have started a series of rapid publications of loss rates (Brod-schneider et al., 2016). Making use of standardized methods for surveys on colony losses, our investigation, based on a large number of responses giving self-re-ported data from beekeepers, provides a quick, but well accepted, measure of honey bee colony loss rates (van der Zee et al., 2013). Moreover these surveys, which have now been running for a number of years in some of the countries, provide information on trends in honey bee winter colony losses both in time and space.
In the most recent COLOSS survey starting in March 2017, we asked beekeepers for the number of colonies wintered, and how many of these colonies after winter: (a) were alive but had unsolvable queen prob-lems (like a missing queen, laying workers, or a drone egg laying queen); (b) were dead or reduced to a few hundred bees; and (c) were lost through natural disas-ter. To calculate the overall proportion of colonies lost, for this article, the sum of a + b + c was calculated and the result was divided by the number of colonies going into winter. Beekeepers were allowed to answer anony-mously. Data files were checked for consistency of loss data (i.e. number of colonies at the start of winter should not be missing and should be greater than zero, number of colonies lost due to each of a, b and c should not be missing and should be greater than or equal to zero, and the sum a + b + c should not be greater than the number of colonies at the start of win-ter). Responses with insufficient or illogical answers were excluded. For most participating countries this amounted to a relatively small number of responses. However, in the case of Germany, which provided by far the highest number of responses, this year an excep-tionally large proportion of the loss data returned by the beekeepers was incomplete. Results for Germany are therefore presented twice, one set of results derived from a limited data-set that contains all requested information required for calculating a + b + c, and a second set derived from the full data-set by treat-ing misstreat-ing values in a or b or c as zero, so as to include also incomplete responses. The true values of the loss rates for Germany are expected to lie between those given for these two cases. By the end of June 2017, 30 countries contributed data to our study. These data were collected centrally, processed and used for calculation of loss rates for this short note.
Altogether, we received over 25,000 responses. Of these, 14,813 beekeepers provided complete and
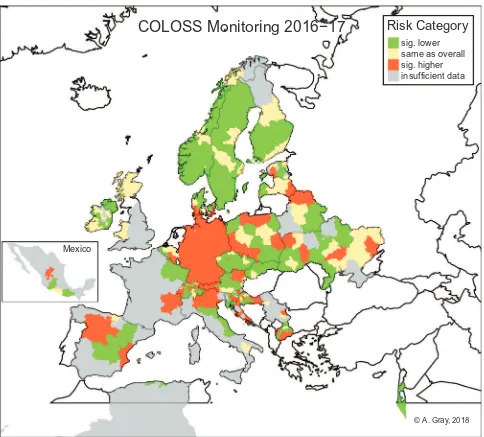
consis-tent loss data. These 14,813 beekeepers collectively wintered 425,762 colonies and reported 21,887 colonies with unsolvable queen problems, 60,227 dead colonies and 6,903 colonies lost due to natural disaster during winter. This gives an overall loss rate of 20.9% (95% confidence interval 20.6–21.3%) during winter 2016/ 2017, with marked differences among countries (Table 1). The highest winter loss rate was found in Germany, irrespective of whether the limited or full data-set from Germany is used for calculation. High overall losses were also reported from Spain, Mexico, Malta and Serbia. At the other end of the spectrum, loss rates were lowest in Norway, Northern Ireland and Algeria. Figure 1 shows the lower risk across most of North-Western and Northern Europe, with higher risk areas across the whole of Germany, parts of Spain and France, the north of Italy and certain regions of most other countries.
For comparison, over winter 2015/2016 the highest loss rates were in Ireland, Northern Ireland, Wales and Spain, and the lowest were in the Czech Republic and central Europe generally, so the pattern differs between years. The large increase in overall loss rate of honey bee colonies during winter 2016/2017 compared to the previous winter (12.0%, Brodschneider et al., 2016) should be considered with caution, as the group of par-ticipating countries differs slightly between the two years. More conclusive is the comparison of loss rates of the 26 countries from which we have results for the last two wintering periods. This shows that twelve countries had, based on 95% confidence intervals, signifi-cantly higher losses than in 2015/2016, eleven remained stable and three experienced lower losses.
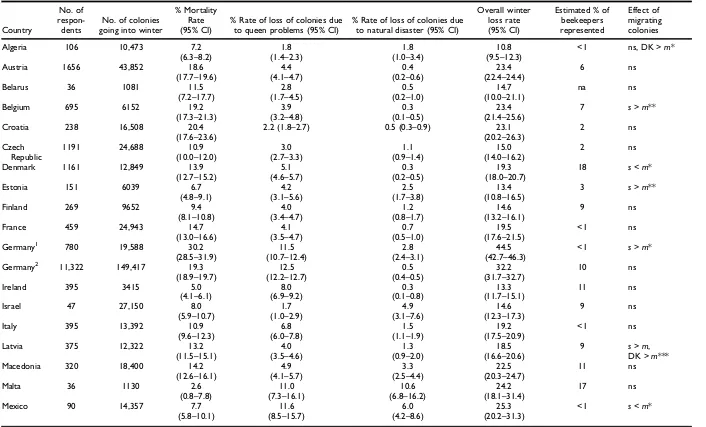
Table 1. Number of respondents with valid loss data, corresponding number of colonies going into winter, mortality rate (including 95% confidence interval, CI), loss rate of colonies due to queen problems, loss of colonies due to natural disaster, overall loss rate, response rate per country (expressed as percentage of responses per estimated number of beekeepers), and effect of migratory beekeeping. Mortality and loss rates were calculated as colonies lost as a percentage of colonies wintered, CIs were calculated using the quasi-binomial generalized linear modelling (GzLM) approach in van der Zee et al. (2013), and effect of migratory beekeeping was tested using a single factor quasi-binomial GzLM to model probability of loss.
Country
No. of
respon-dents
No. of colonies going into winter
% Mortality Rate (95% CI)
% Rate of loss of colonies due to queen problems (95% CI)
% Rate of loss of colonies due to natural disaster (95% CI)
Overall winter loss rate (95% CI)
Estimated % of beekeepers represented
Effect of migrating colonies
Algeria 106 10,473 7.2 1.8 1.8 10.8 <1 ns, DK >m*
(6.3–8.2) (1.4–2.3) (1.0–3.4) (9.5–12.3)
Austria 1656 43,852 18.6 4.4 0.4 23.4 6 ns
(17.7–19.6) (4.1–4.7) (0.2–0.6) (22.4–24.4)
Belarus 36 1081 11.5 2.8 0.5 14.7 na ns
(7.2–17.7) (1.7–4.5) (0.2–1.0) (10.0–21.1)
Belgium 695 6152 19.2 3.9 0.3 23.4 7 s>m**
(17.3–21.3) (3.2–4.8) (0.1–0.5) (21.4–25.6)
Croatia 238 16,508 20.4 2.2 (1.8–2.7) 0.5 (0.3–0.9) 23.1 2 ns
(17.6–23.6) (20.2–26.3)
Czech Republic
1191 24,688 10.9 3.0 1.1 15.0 2 ns
(10.0–12.0) (2.7–3.3) (0.9–1.4) (14.0–16.2)
Denmark 1161 12,849 13.9 5.1 0.3 19.3 18 s<m*
(12.7–15.2) (4.6–5.7) (0.2–0.5) (18.0–20.7)
Estonia 151 6039 6.7 4.2 2.5 13.4 3 s>m**
(4.8–9.1) (3.1–5.6) (1.7–3.8) (10.8–16.5)
Finland 269 9652 9.4 4.0 1.2 14.6 9 ns
(8.1–10.8) (3.4–4.7) (0.8–1.7) (13.2–16.1)
France 459 24,943 14.7 4.1 0.7 19.5 <1 ns
(13.0–16.6) (3.5–4.7) (0.5–1.0) (17.6–21.5)
Germany1 780 19,588 30.2 11.5 2.8 44.5 <1 s>m*
(28.5–31.9) (10.7–12.4) (2.4–3.1) (42.7–46.3)
Germany2 11,322 149,417 19.3 12.5 0.5 32.2 10 ns
(18.9–19.7) (12.2–12.7) (0.4–0.5) (31.7–32.7)
Ireland 395 3415 5.0 8.0 0.3 13.3 11 ns
(4.1–6.1) (6.9–9.2) (0.1–0.8) (11.7–15.1)
Israel 47 27,150 8.0 1.7 4.9 14.6 9 ns
(5.9–10.7) (1.0–2.9) (3.1–7.6) (12.3–17.3)
Italy 395 13,392 10.9 6.8 1.5 19.2 <1 ns
(9.6–12.3) (6.0–7.8) (1.1–1.9) (17.5–20.9)
Latvia 375 12,322 13.2 4.0 1.3 18.5 9 s>m,
DK >m*** (11.5–15.1) (3.5–4.6) (0.9–2.0) (16.6–20.6)
Macedonia 320 18,400 14.2 4.9 3.3 22.5 11 ns
(12.6–16.1) (4.1–5.7) (2.5–4.4) (20.3–24.7)
Malta 36 1130 2.6 11.0 10.6 24.2 17 ns
(0.8–7.8) (7.3–16.1) (6.8–16.2) (18.1–31.4)
Mexico 90 14,357 7.7 11.6 6.0 25.3 <1 s<m*
(5.8–10.1) (8.5–15.7) (4.2–8.6) (20.2–31.3)
(Continued)
454
R.
Brodschneid
er
et
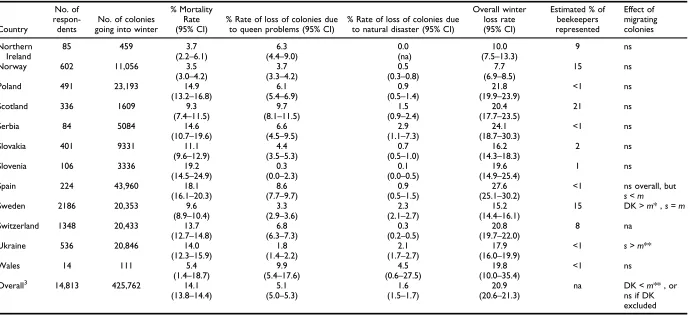
Table 1. (Continued).
Country
No. of
respon-dents
No. of colonies going into winter
% Mortality Rate (95% CI)
% Rate of loss of colonies due to queen problems (95% CI)
% Rate of loss of colonies due to natural disaster (95% CI)
Overall winter loss rate (95% CI)
Estimated % of beekeepers represented
Effect of migrating colonies
Northern Ireland
85 459 3.7 6.3 0.0 10.0 9 ns
(2.2–6.1) (4.4–9.0) (na) (7.5–13.3)
Norway 602 11,056 3.5 3.7 0.5 7.7 15 ns
(3.0–4.2) (3.3–4.2) (0.3–0.8) (6.9–8.5)
Poland 491 23,193 14.9 6.1 0.9 21.8 <1 ns
(13.2–16.8) (5.4–6.9) (0.5–1.4) (19.9–23.9)
Scotland 336 1609 9.3 9.7 1.5 20.4 21 ns
(7.4–11.5) (8.1–11.5) (0.9–2.4) (17.7–23.5)
Serbia 84 5084 14.6 6.6 2.9 24.1 <1 ns
(10.7–19.6) (4.5–9.5) (1.1–7.3) (18.7–30.3)
Slovakia 401 9331 11.1 4.4 0.7 16.2 2 ns
(9.6–12.9) (3.5–5.3) (0.5–1.0) (14.3–18.3)
Slovenia 106 3336 19.2 0.3 0.1 19.6 1 ns
(14.5–24.9) (0.0–2.3) (0.0–0.5) (14.9–25.4)
Spain 224 43,960 18.1 8.6 0.9 27.6 <1 ns overall, but
s<m
(16.1–20.3) (7.7–9.7) (0.5–1.5) (25.1–30.2)
Sweden 2186 20,353 9.6 3.3 2.3 15.2 15 DK >m* ,s=m
(8.9–10.4) (2.9–3.6) (2.1–2.7) (14.4–16.1)
Switzerland 1348 20,433 13.7 6.8 0.3 20.8 8 na
(12.7–14.8) (6.3–7.3) (0.2–0.5) (19.7–22.0)
Ukraine 536 20,846 14.0 1.8 2.1 17.9 <1 s>m**
(12.3–15.9) (1.4–2.2) (1.7–2.7) (16.0–19.9)
Wales 14 111 5.4 9.9 4.5 19.8 <1 ns
(1.4–18.7) (5.4–17.6) (0.6–27.5) (10.0–35.4)
Overall3 14,813 425,762 14.1 5.1 1.6 20.9 na DK <m** , or
ns if DK excluded (13.8–14.4) (5.0–5.3) (1.5–1.7) (20.6–21.3)
Notes: Significance codes forp-values: ns = non-significant (p> 0.05); na: data not available, DK = Don’t Know;s= stationary,m= migratory. *0.01 <p≤ 0.05.
**0.001 <p≤0.01. ***p<= 0.001.
1Result for Germany using only the beekeepers with complete loss data. 2Result for Germany replacing missing numbers lost by 0.
3Overall result using the smaller data-set for Germany, for consistency with the treatment of other countries.
Wi
nter
2016/
17
honey
bee
colony
loss
rates
from
the
COLO
SS
survey
contributing to colony losses (Kulhanek et al., 2017; Seitz et al.,2016).
Although the losses due to natural disaster are important for individual operations or even for the honey bee population in a given region, colonies lost by natural disaster do not admit an epidemiological analysis of biological causes for colony losses and may therefore be left out or treated separately in further risk analysis. Winter losses related to queen problems varied between 0.3% in Slovenia and more than 10% in Ger-many. The overall loss rate due to queen problems was 5.1%, which was slightly higher than that recorded in the previous winter (4.4%, Brodschneider et al.,2016).
Operation size has been identified as a risk factor for winter losses before (e.g. Seitz et al., 2016). We were able to verify our findings from last year, that bee-keeping operations with 50 or fewer colonies experi-ence higher total winter losses in the overall analysis (p< 0.001; Brodschneider et al., 2016). This year we focused on another often discussed risk factor for col-ony losses, migratory beekeeping. The proportion of beekeepers migrating bee colonies varied greatly from 3% of those answering this question in the Czech Republic to 50% in Mexico. The results indicate a signifi-cant effect only in a minority of countries (Table 1), and the direction of the effect of migration on the risk of
COLOSS Monitoring 2016−17
© A. Gray, 2018
Risk Category
sig. lower same as overall sig. higher insufficient data
[image:5.595.55.539.75.512.2]Mexico
Figure 1. Color-coded map showing relative risk of overwinter colony loss at regional level for participating countries.
Notes: Regions with a relative risk of loss (loss rate relative to the loss rate over all regions) that is significantly higher/lower than 1 are shown in red/green respectively. Regions with a relative risk not significantly different from 1 are shown in yellow. Where no data were available or data were available from fewer than 6 beekeepers in a region, this was treated as insufficient for reliable cal-culation and the region is shown in grey. The smaller limited data-set satisfying the data checks was used for Germany, for consis-tency with other countries.
winter loss varies. In many countries some beekeepers replied “don’t know” to whether or not they migrated. Overall the “don’t knows” had lower losses than those migrating, though in 3 countries (see Table 1) they had higher losses. Omitting “don’t know”, overall there was no effect of migration. Our results are broadly in accor-dance with reports from the USA, where migratory beekeeping was not found to increase colony loss rates (Kulhanek et al.,2017; Seitz et al.,2016).
Achieving representativeness of the beekeeper popula-tion is an important issue in estimapopula-tion of loss rates (van der Zee et al.,2013). One strategy, which we also followed in this study, is to aim for as many answers from beekeep-ers as possible, but the response rate (estimate of bee-keepers represented, Table 1) reveals high differences between countries. Whereas in 14 countries between 6% and 21% of the respective beekeeper population partici-pated in our study, in other countries only a low number of responses, sometimes from certain regions only, was available this year. Although based on few answers only, here we present winter loss rates for the first time from Belarus, Malta, Mexico and Serbia. Routine surveys on col-ony losses are widely accepted by beekeepers and authori-ties in many countries, and the network is planning to further expand with respect to the number of countries participating and especially to try to improve the response rates in countries with few answers this year, to further facilitate understanding of honey bee health.
Acknowledgements
The colony loss monitoring group which carried out this study is a core project of the COLOSS (Prevention of honey bee COlony LOSSes) Association, which aims to explain and pre-vent massive honey bee colony losses. COLOSS was estab-lished through the COST (European Cooperation in Science and Technology) Action FA0803 and is now supported by the Ricola Foundation - Nature & Culture. COLOSS supports reg-ular workshops facilitating research discussions and collabora-tion between group members. The authors very much thank all the beekeepers who gave their time to complete the COLOSS questionnaire providing the data for this work, and the additional COLOSS partners who contributed to data col-lection or data processing.
Funding
The authors are also grateful to various national funding sources for their support of some of the monitoring surveys [including, in the Republic of Serbia, MPNTR-RS, through grant number III46002]. The authors acknowledge the financial sup-port by the University of Graz for open access publication.
ORCID
Robert Brodschneider http://orcid.org/0000-0002-2535-0280
Alison Gray http://orcid.org/0000-0002-6273-0637
Jean-Daniel Charrie`re http://orcid.org/0000-0003-3732-4917
Robert Chlebo http://orcid.org/0000-0001-8715-0578
Dirk C de Graaf http://orcid.org/0000-0001-8817-0781
Mariia Fedoriak http://orcid.org/0000-0002-6200-1012
Ivan Forsythe http://orcid.org/0000-0002-8642-102X
Amots Hetzroni http://orcid.org/0000-0003-1007-6845
Lassi Kauko http://orcid.org/0000-0001-7836-6553
Preben Kristiansen http://orcid.org/0000-0001-6718-2214
Maritta Martikkala http://orcid.org/0000-0001-5761-8627
Raquel Martı´n-Herna´ndez http://orcid.org/0000-0002-1730-9368
Carlos Aurelio Medina-Flores http://orcid.org/0000-0002-9330-565X
Franco Mutinelli http://orcid.org/0000-0003-2903-9390
Noa Simon-Delso http://orcid.org/0000-0003-1729-890X
Marion Zammit-Mangion http://orcid.org/0000-0003-2940-0780
References
Brodschneider, R., Gray, A., van der Zee, R., Adjlane, N., Brus-bardis, V., Charrie`re, J.-D., … Woehl, S. (2016). Preliminary analysis of loss rates of honey bee colonies during winter 2015/ 16 from the COLOSS survey.Journal of Apicultural Research, 55
(5), 375–378. doi:10.1080/00218839.2016.1260240
Kulhanek, K., Steinhauer, N., Rennich, K., Caron, D.M., Sagili, R.R., Pettis, J.S., … vanEngelsdorp, D. (2017). A national survey of managed honey bee 2015–2016 annual colony losses in the USA. Journal of Apicultural Research, 56(4), 328–340. doi:10.1080/00218839.2017.1344496
Seitz, N., Traynor, K.S., Steinhauer, N., Rennich, K., Wilson, M.E., Ellis, J.D., … vanEngelsdorp, D. (2016). A national survey of managed honey bee 2014–2015 annual colony losses in the USA. Journal of Apicultural Research, 54(4), 292–304. doi:10.1080/00218839.2016.1153294
van der Zee, R., Brodschneider, R., Brusbardis, V., Charrie`re, J.-D., Chlebo, R., Coffey, M.F., … Gray, A. (2014). Results of international standardized beekeeper surveys of colony losses for winter 2012-2013: Analysis of winter loss rates and mixed effects modelling of risk factors for winter loss.Journal of Api-cultural Research, 53(1), 19–34. doi:10.3896/IBRA.1.53.1.02
van der Zee, R., Gray, A., Holzmann, C., Pisa, L., Brodschnei-der, R., Chlebo, R., Wilkins, S. (2013) Standard survey methods for estimating colony losses and explanatory risk factors inApis mellifera. In V. Dietemann, J.D. Ellis, P. Neu-mann (Eds)The COLOSS BEEBOOK, Volume I: Standard meth-ods for Apis mellifera research. Journal of Apicultural Research
(Vol. 52). doi:10.3896/IBRA.1.52.4.18
van der Zee, R., Pisa, L., Andonov, S., Brodschneider, R., Char-rie`re, J.D., Chlebo, R., … Wilkins, S. (2012). Managed honey bee colony losses in Canada, China, Europe, Israel and Turkey, for the winters of 2008–2009 and 2009–2010.
Journal of Apicultural Research, 51(1), 100–114. doi:10.3896/ IBRA.1.51.1.12
Winter 2016/17 honey bee colony loss rates from the COLOSS survey 457