International Journal of Innovative Technology and Exploring Engineering (IJITEE) ISSN: 2278-3075, Volume-8 Issue-10, August 2019
Abstract: In current scenario of various electrical profiles like load profile, energy met profile, peak demand, etc. are very complex and therefore affected proper power system planning. Electrical forecasting is an important part in proper power system planning. Classical models, i.e., time series models and other conventional models are restricted for linear and stationary electrical profiles. Consequently, these models are not suitable for accurate electrical forecasting. In this paper, artificial neural network (ANN) based forecasting models are proposed to forecast hydro generation, energy met and peak demand. Auto-regressive (AR), moving average (MA), Auto-regressive Moving average (ARMA) and auto-regressive integrated moving average (ARIMA) are also developed to show the effectiveness of ANN based models over time series models. Additionally, best selection of hidden neurons in ANN is also shown here.
Keywords: Artificial neural network, mean absolute percentage error, power system planning.
I. INTRODUCTION
Electricity does not only help in making human’s life luxuries, but it fulfills as a basic need of human’s life. Thus, it is backbone of a country in terms of economic and technological development. Furthermore, it can be considered as a boon as we cannot feel our existence without it. From technical side of view, its scarcity or abundance, both are non-economical for electricity industries [1]. Electrical engineers continuously attempt to maintain proper balance between demand and generation of the electricity. For the same they need to sketch a proper electrical operational planning. Electrical forecasting is an important tool in this task [2]. In recent decades, our dependency is heavily increased on electricity, resulting in a more complex load profile in comparison to the profiles a decade before. Therefore, it is the demand of time that more sophisticated and accurate forecasting models need to be developed to help the utility corporation in their operation and management of the quality and continuous supply to their customers despite recent complex and non-linear electricity profiles. A non-accurate forecasting may results in system
Revised Manuscript Received on August 10, 2019
* Correspondence Author
Anamika Singh*, Department of Electrical Engineering, Sam Higginbottom University of Agriculture, Technology And Sciences, Prayagraj, India.
Manish Kumar Srivastava, Department of Electrical Engineering, Sam Higginbottom University of Agriculture, Technology And Sciences, Prayagraj, India.
Navneet Kumar Singh, Department of Electrical Engineering, Motilal Nehru National Institute of Technology, Prayagraj, India.
breakdown, malfunctioning, client discontentedness economic and reputation loss, etc. Time series models [3] has been very popular and being used at many places now a days as conventional forecasting models.
Keyhani and El-Abiad were the foremost to develop short-term forecasting model by proposing Auto-Regressive Moving Average (ARMA) model in 1975 [4]. Regression method, statistical tools, time series were explored time to time to predict various electric profiles/ parameters [5]. In recent years/ decades, Artificial Intelligence (AI) based models drew large attention of researchers over conventional time series models [6], providing promising results. Various hybrid approaches were proposed by various researchers as listed in Table-1 to develop forecasting models.
TABLE-1:Various Hybrid Forecasting Approaches
Forecasting model/ approach Year
STLF using fuzzy and an evolutionary algorithm [7] 2010 MTLF for weighted evolving fuzzy NN [8] 2011 Price forecasting using hybrid model [9] 2012 Predicting power production using Wavelet Transform and Fuzzy ARTMAP [10]
2013
A hybrid model used for day-ahead electricity [11] 2014 To investigates the effectiveness of different machine learning algorithms[12]
2015
STLF using hybrid neural networks [13] 2016 STLF using NN model combined with ADF test [14] 2017
STLF and MTLF using GA [15] 2018
In this paper following electrical parameter profiles of India are used as historical data and concerned forecasting models are developed.
(a) Daily hydro generation profile (b) Daily energy met
(c) Daily peak demand
Looking at several advantages of AI based forecasting techniques; this manuscript proposes ANN based forecasting models to predict above profiles. ANN has the capability of fault tolerance, adaptive, non-linear modeling, etc [16]. A popularly known and effective training algorithm, i.e., Levenberg-Marquardt is used to train the ANN. The forecasting results obtained from ANN based forecasting models are compared with classical AR, MA, ARMA and ARIMA, models, to show superiority of ANN over it. To measuring performance parameters of the model mean absolute percentage error (MAPE) is used [17]. There are different kinds of parameters influencing the prediction, i.e., environmental population, econometric information, power supply & cost, selling of electrical appliances and a few alternative random disturbances.
AI-based Short-Term Electric Time Series
Forecasting
As years passed, load patterns become extremely mismatched due to increasing electricity demand, human dependency on electricity. [18].
In Section II, case under consideration is discussed. Section III provides brief description of ANN architecture and other details related to develop forecasting model. All the simulation information and forecasting results are discussed in Section IV. The results are then concluded and analyzed in Section V.
II. CASEUNDERCONSIDERATION
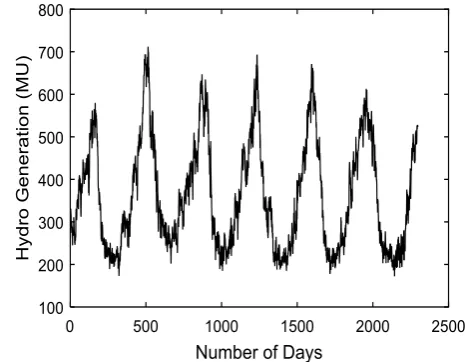
[image:2.595.312.540.48.227.2]Daily electricity data has been collected for India from 01 April, 2012 to 31 July, 2018 of hydro generation (in million units) of a power plant, Energy Met (in million units) and peak demand (in mega watt) [19] to develop short-term forecasting model. In this manuscript, simulation results of conventional models, i.e., AR, MA, ARMA and ARIMA with artificial neural network model for the electric forecasting are compared. Additionally, the best selection of hidden layer neurons with minimum forecasting error is also discussed. The first 2297 days is employed for training and validation purpose; however, remaining fourteen days is saved for testing purpose. The variations of various data sets, i.e., daily hydro generation, daily energy met, and daily peak demand are depicted in Figs. 1-3.
[image:2.595.50.283.367.548.2]Fig. 1. Actual hydro-generation data (MU) of India
Fig. 2. Actual energy met data (MU) of India
Fig. 3. Actual peak demand curve (MW) of India
It is obvious from the figures that the profiles are non-linear in nature and cannot be accurately forecasted using conventional forecasting models.
The developed ANN based forecasting models are in detail discussed in subsequent section.
III. FORECASTINGMODELS
There are various techniques used for prediction of future data. Few of them are discussed here and used to develop forecasting models.
A. Conventional Models
These models are popularly known and utilizing by many researchers for forecasting. These models used previous data for predicting future data.
Auto-Regressive (AR) model
Each time series has some kind of dependency on its past data. AR model is realized by identifying its order using partial auto correlation. It is denoted as (AR)p and it is defined by (1) [26].
1 p
t i t i t
i
Z c
Z
(1) where,
1,…,
p are the parameters of the model, c is constant, and
t is white noise.Moving Average (MA) Model
It provides the averages, laying within the specified moving window. This method is extremely helpful for prediction of short trends. [28] It is denoted as (MA)q and it is defined by (2)
1
q
t t i t i
i
Z
(2)where,
1,…,
2are the parameters of the model,
is the expectation of the Xt and
t is [image:2.595.50.284.582.766.2]International Journal of Innovative Technology and Exploring Engineering (IJITEE) ISSN: 2278-3075, Volume-8 Issue-10, August 2019
Auto Regressive Moving Average (ARMA) Model
It is the combination of (AR)pand (MA)q models and it is defined by (3) [27]
1 1
p q
t t i t i i t i
i i
Z
c
Z
(3)Auto-Regressive Integrated Moving Average (ARIMA) Model
It is a generalize form of a time series model without seasonality. It is used for the time series that need to be made stationary by integrating [27].
t
c
1 t 1p t p
1 t 1 q t q
Z
Z
Z
(4)Where, c is constant,
1...
p is parameter of AR model,1
...
q
are parameter of MA model,
is white noise.B. Brief Details of ANN
ANN is first proposed in 1943. It consists of multiple nodes (i.e., neurons), reflecting biological neurons of a human brain. These nodes are massively interconnected by links having various weights. These nodes can receive input information and perform operations on it. The output of these operations is passed to successive neuron(s). The output of a neuron depends upon the activation function of the neuron [20]. ANNs has the capacity to learn that takes place by changing weights values of the interconnections. If the network creates a desired output there is no need to change the weights; in other words the network is treated as trained. On contrary, a network, creating undesired output needs weights updating or training using appropriate training method [21]. An ANN has the capability to modeling non-linear relationships. It doesn’t impose any restrictions on the input variables. ANN has good generalization ability. [22]
I n1
I n2
I n3
I q
I n6
Y
q th q th
Input Layer ( Ni)
Hidden Layer (Nh)
Output Layer (No)
Output Layer Weights
(W2)
Sigmoid Function Hidden Layer
[image:3.595.76.261.519.714.2]Weights (W1 )
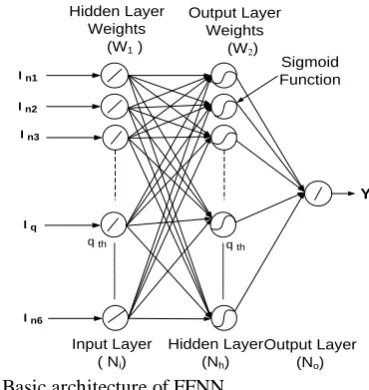
Fig. 4. Basic architecture of FFNN
Feed Forward Neural Network (FFNN)
As the name reflects, the flow of information in this kind of network is in forward direction only. The basic architecture of FFNN is shown in Fig.1. While developing ANN
forecasting model, six inputs, i.e., In1, In2, In3, In4, In5, In6, and
one output are selected. Complying with this, 6-20-1 structure of ANN is selected, implying 6 input neurons, 20 hidden layer neurons, and one output neurons. The activation functions used for hidden neuron are sigmoid and for input & output layers are linear. W1 and W2are the weights of the
hidden and output layers. [23]
Training Patterns for ANN
The correct sequence is required for training data. To forecast the energy E(t) at time index t, Input vector I(t) consists of 6 inputs as [E(t-k), D(t)], where, k=[1,7,14,21,28] and D(t) denoted day type parametric value, i.e., value corresponding to Sunday, Monday, etc. at kthday. E(t) is received from the output. [24].
Mean Absolute Percentage Error (MAPE)
MAPE is used for testing accuracy of forecasting. It can be calculated by [25]
| | 1 *100 A F A E E MAPE N E
(5)In (5), N is forecasted energy to calculate error, EA is actual
energy and EF forecasted energy corresponding to EA.
IV. RESULTSANDDISCUSSION
In this section, forecasting results of energy met (million units), hydro generation (million units) and peak demand (mega watt) using conventional models, i.e., AR, MA, ARMA & ARIMA and artificial intelligence, i.e., ANN are presented. Additionally, the best selection of hidden neurons is also mentioned in this section. It can be seen from the results that conventional models do not provides an accurate forecasting as comparison to ANN models. ANN models provide more accurate results.
A. Conventional Model Results
In this part, forecasting results of energy met, hydro generation and peak demand using conventional models, i.e., AR, MA, ARMA and ARIMA are presented. It can be seen from Figs. 5-8. The MAPE of various data profiles using conventional models is also presented in Table 2.
(b)
[image:4.595.312.540.49.467.2](c)
Fig. 5. Actual and forecasted (a) hydro generation (MU), (b) energy met (MU), and (c) peak demand (MW), all using AR models
(a)
(b)
(c)
Fig. 6. Actual and forecasted (a) hydro generation (MU), (b) energy met (MU), and (c) peak demand (MW), all using MA models
[image:4.595.54.287.54.475.2]International Journal of Innovative Technology and Exploring Engineering (IJITEE) ISSN: 2278-3075, Volume-8 Issue-10, August 2019
(b)
[image:5.595.47.289.49.479.2](c)
Fig. 7. Actual and forecasted (a) hydro generation (MU), (b) energy met (MU), and (c) peak demand (MW), all using ARMA models
(a)
(b)
(c)
Fig. 8. Actual and forecasted (a) hydro generation (MU), (b) energy met (MU), and (c) peak demand (MW), all using ARIMA models
TABLE-2 MAPE Obtained From Conventional Models for Various Data
S. No. Data Profile
MAPE
AR MA ARMA ARIMA
1. EM 2.8365 14.6097 2.6034 2.60
2. HG 3.7568 28.9340 3.9112 8.27
3. PD 2.9504 12.4897 2.8524 3.42
EM=Energy Met (MU); HG=Hydro-Generation (MU); PD=Peak Demand (MW)
Fig. 5(a, b, c) – Fig.8(a, b, c) shows actual and forecasted hydro generation, energy met and peak demand. It is shown in TABLE 2 that ARIMA is better than other time series models, i.e. AR, MA and ARMA because ARIMA MAPE is minimum in comparison to other time series models.
B. ANN Model Results
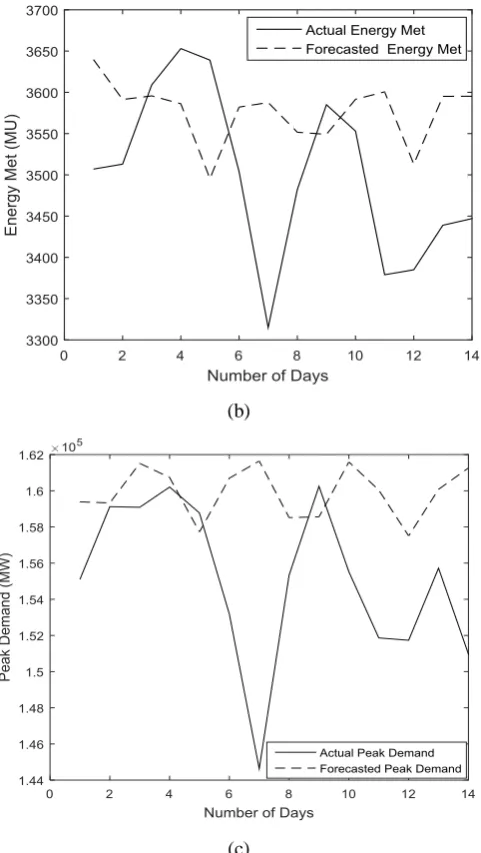
[image:5.595.307.548.50.477.2]FFNN have 6 input neurons (Ni), 20 hidden neurons (Nh) and
1 output neuron (No). The actual & forecasted, performance
[image:6.595.305.556.111.257.2]and regression results are shown in Figs. 9-11. The forecasted days for all profiles are 14 days. These forecasted models are applicable for both linear and non-linear load profiles. This method gives better results as comparison to conventional methods. Additionally, Table 3 has shown the best selection of hidden neurons for developed forecasting models which give minimum errors.
Fig. 9. Actual and forecasted hydro generation (MU) using ANN
[image:6.595.43.285.152.559.2]Fig. 10. Actual and forecasted energy met (MU) using ANN
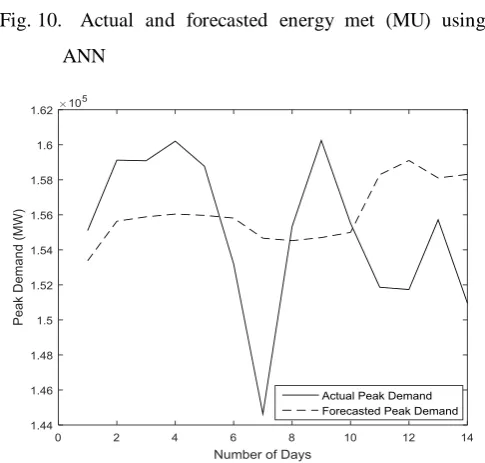
[image:6.595.47.284.161.341.2]Fig. 11. Actual and forecasted peak demand (MW) using ANN
TABLE-3 MAPE Obtained Using ANN Model At Different Hidden Neurons Of Various Data
S. No. Nh MAPE
EM HG PD
1 15 4.3179 5.9292 3.0199
2 16 3.0385 3.8391 3.6996
3 17 3.0841 5.2905 3.0269
4 18 2.7095 9.9737 3.1357
5 19 3.4044 4.9159 3.0856
6 20 2.4122 2.7667 2.7240
7 21 2.6118 5.3102 3.0599
8 22 2.7217 7.6998 3.7672
9 23 2.9346 9.1982 4.7843
10 24 3.0826 11.2528 6.7562
11 25 3.9141 12.1485 4.7695
HG=Hydro-Generation (MU); EM=Energy Met(MU)); PD=Peak Demand (MW)
Fig. 9-11 shows actual and forecasted hydro generation, energy met and peak demand. It is found in TABLE 3 that ANN models with twenty hidden neurons are better than other number of hidden neurons because MAPE of twenty hidden neurons is minimum.
V. CONCLUSION
In this paper an accurate short-term electric forecasting models for hydro generation, energy met and peak demand of India are developed using conventional methods, i.e., AR, MA, ARMA & ARIMA, and artificial intelligence technique i.e. ANN. It is found that accuracy of developed forecasted models is improved by using ANN methodology in comparison to conventional models. Additionally, proper selection of hidden neurons is also shown here. Thus, it is found that 20 hidden neurons gives minimum error in comparison to other number of hidden neurons.
ACKNOWLEDGMENT
Authors express their gratitude to Power System Operational Corporation Limited, New Delhi, India for providing electricity load data online.
REFERENCES
1.M.A.J. Moran, E.G. Romera and D C. Fernandez (2013) “Monthly electric demand forecasting with neural filters,” Electrical Power and Energy Systems, vol. 49, pp. 253-263.
2.A.K. Fard, H. Samet and F. Marzbani (2014) “A new hybrid modified firefly algorithm and support vector regression model for accurate short-term load forecasting,” Expert Systems with Applications, vol. 41, pp. 6047-6056, October 2014.
3.Navneet K. Singh, Asheesh K. Singh and Manoj Tripathy (2014) “A comparative study of BPNN, RBFNN and ELMAN neural network: A case study of Delhi Region,” 9th International Conference on Industrial and Information Systems (ICIIS), India, pp.1-6.
4.Navneet K. Singh, Manoj Tripathy and Asheesh K. Singh (2011) “A radial basis function neural network approach for multi-hour short term load price forecasting with type of day parameter,” 6th IEEE International Conference on Industrial and Information Systems (ICIIS), Sri Lanka, pp.316-321.
[image:6.595.46.284.342.548.2] [image:6.595.47.290.550.781.2]International Journal of Innovative Technology and Exploring Engineering (IJITEE) ISSN: 2278-3075, Volume-8 Issue-10, August 2019
6.Navneet K. Singh, Asheesh K.Singh and Manoj Tripathy (2012) “Selection of hidden layer neurons and best training method for FFNN in application of long term load forecasting,” Journal of Electrical Engineering, vol. 63, pp. 153-161.
7. V.H. Hinojosa and A. Hoese (2010) “Short-term load forecasting using fuzzy inductive reasoning and evolutionary algorithms,” IEEE Transaction on Power Systems, vol. 25, pp. 565-574.
8. P. C. Chang, C.Y. Fan and J.J. Lin (2010) “Monthly electricity demand forecasting based on a weighted evolving fuzzy neural network,” Electrical Power and Energy Systems, vol. 33, pp. 17-27.
9. V. Gonzalez and J. Contreras (2012) “Forecasting power prices using a hybrid fundamental-econometric model,” IEEE Transaction on Power Systems, vol.27, pp. 363-372.
10.A.U. Haque, P. Mandal, J. Meng, A.K. Srivastava, T.L. Seng, T. Senjyu (2013) “A novel hybrid approach based on wavlet transform and fuzzy ARTMAP network for predicting wind farm power production,” IEEE Transactions on Industry Applications, vol. 49, pp. 2253-2261. 11.L. Wu and M. Shahidehpour (2014) “A hybrid model for integrated
day-ahead electricity price and load forecasting in smart grid,” IET Generation, Transmission & Distribution, vol. 8, pp. 1937-1950. 12.C. Cecati, J. Kolbusz, P. Rozycki, P. Siano and B M. Wilamowski (2015)
“A novel RBF training algorithm for short-term electric load forecasting and comparative studies,” IEEE Transaction on Industrial Electronics, vol. 62, pp. 6519-6529.
13.S. Li P. Wang and L. Goel (2016) “A novel wavelet-based ensemble method for short-term load forecasting with hybrid neural network and feature selection,” IEEE Transactions on Power Systems, vol.31, pp. 1788-1798.
14.B. Li J. Zhang, Y. He and Y. Wang (2017) “Short-term load forecasting method based on wavelet decomposition with second-order gray neural network combined with ADF test,” IEEE Access, vol. 5, pp. 16324-16331. 15.M. Jawad, S.M. Ali, B. Khan, C.A. Mehmood, U. Farid, Z.Ullah, S.Usman, A. Fayyaz, J. Jadoon, N. Tareen, A. Basil, M.A. Rustam and I. Sami (2018) “Genetic algorithm-based non-linear auto-regressive with exogenous inputs neural network short-term and medium-term uncertainty modeling and prediction for electrical load and wind speed,” The Journal of Engineering, vol. 2018, pp. 721-729.
16.S. Anbazhagan and N. Kumarappan (2013) “Day-ahead deregulated electricity market price forecasting using recurrent neural network,” IEEE Systems Journal, vol.7, pp. 866-872.
17.Navneet K. Singh, Asheesh K. Singh and Manoj Tripathi (2014) “Short Term Load Forecasting using Genetically Optimized Radial Basis Function Neural Network,” Australasian Universities Power Engineering Conference, (AUPEC), Perth Australia, pp. 1-5.
18.Navneet K. Singh, Asheesh K. Singh and Pradeep Kumar (2014) “PSO optimized radial basis function neural network based electric load forecasting model”, Australasian Universities Power Engineering Conference (AUPEC), Perth, Australia, pp. 1-5.
19.“Operational Performance Report, India, 2012-2018” [online] Website: https://posoco.in
20.Y. Liu, T. Zhi, H. Xi, X. Duan and H. Zhang (2019) “A novel content popularity prediction algorithm based on auto regressive model in information centric IoT,” IEEE Access, vol. 7, pp. 27555-27564. 21.S.A. Fattah, W.P. Zhu and M.O. Ahmad (2011) “Identification of
autoregressive moving average systems based on noise compensation in the correlation domin,” IET Signal Processing, vol.5, pp. 292-305.
22.Z. Liu, Z. CAI and X.T. Na (2011) “Forecasting research of aero-engine rotate speed signal based on ARMA model,” Procedia Engineering, 15, pp. 115-121.
23.C.A.V. Cardoso and G.L. Cruz (2016) “Forecasting natural gas consumption using ARIMA models and artificial neural networks,” IEEE Latin America Transactions, vol. 14, pp. 2233-2238.
24.W.S. McCulloch and W. Pitts, “A logical calculus of the ideas imminent in nervous activity,” Bulletin of Mathematical Biophysics, vol.5, pp. 115-133, 1943.
25.C.M. Lee and C.N. Ko (2009) “Time series prediction using RBF neural networks with a nonlinear time-varying evolution PSO algorithm,” Neurocomputing, vol. 73, pp. 449-460.
26.A.Y. Alanis (2018) “Electricity prices forecasting using artificial neural networks,” IEEE Latin America Transactions, vol. 16, pp. 105-111. 27.P.M. Baggenstoss (2018) “On the duality belief networks and feed-forward
neural networks,” IEEE Transactions on Neural Networks and learning systems, vol. 30, pp. 190-200.
28.C. Guoqiang, T. Zhongzhi and X. Zongyi (2010) “Modelling of electrohydraulic systems using RBF neural networks and genetic algorithm,” Journal of Convergence Information Technology, vol.5. 29.G.E.P. Box and G.M. Jenkins(1976)“Time series analysis: forecasting
and control, Holden-Day inc, 500 Sansome Street, San Francisco, California,”.
AUTHORSPROFILE
Anamika Singh is research Scholar in the Department of Electrical Engineering, Sam Higginbottom University of Agriculture, Technology And Sciences, Prayagraj, India. Her current research work includes power system planning, load forecasting, neural network and artificial intelligence.
Manish Kumar Srivastava received the Ph.D. degree from Sam Higginbottom University of Agriculture, Technology And Sciences, Allahabad, India. Currently he is with the Department of Electrical Engineering, Sam Higginbottom University of Agriculture, Technology And Sciences, Prayagraj, India. His research area includes power system planning, transformer, energy efficiency, load forecasting, neural network.