InTrans Project Reports Institute for Transportation
4-2010
Instrumentation and Monitoring of Precast Bridge
Approach Tied to an Integral Abutment Bridge in
Bremer County
Anna Nadermann
Institute for Transportation, anaderma@iastate.edu Lowell Greimann
Institute for Transportation, greimann@iastate.edu
Brent Phares
Institute for Transportation, bphares@iastate.edu
Follow this and additional works at:http://lib.dr.iastate.edu/intrans_reports Part of theCivil and Environmental Engineering Commons
This Report is brought to you for free and open access by the Institute for Transportation at Iowa State University Digital Repository. It has been accepted for inclusion in InTrans Project Reports by an authorized administrator of Iowa State University Digital Repository. For more information, please contactdigirep@iastate.edu.
Recommended Citation
Nadermann, Anna; Greimann, Lowell; and Phares, Brent, "Instrumentation and Monitoring of Precast Bridge Approach Tied to an Integral Abutment Bridge in Bremer County" (2010).InTrans Project Reports. 27.
Instrumentation and Monitoring of Precast Bridge Approach Tied to an
Integral Abutment Bridge in Bremer County
Abstract
Approach slab pavement at integral abutment (I-A) bridges are prone to settlement and cracking, which has been long recognized by the Iowa Department of Transportation (DOT). A commonly recommended solution is to integrally attach the approach slab to the bridge abutment. This study sought to supplement a previous project by instrumenting, monitoring, and analyzing the behavior of an approach slab tied to a integral abutment bridge. The primary objective of this investigation was to evaluate the performance of the approach slab. To satisfy the research needs, the project scope involved reviewing a similar previous study, implementing a health monitoring system on the approach slab, interpreting the data obtained during the evaluation, and conducting periodic visual inspections of the bridge and approach slab. Based on the
information obtained from the testing, the following general conclusions were made: the integral connection between the approach slab and the bridge appears to function well with no observed distress at this location and no relative longitudinal movement measured between the two components; the measured strains in the approach slabs indicate a force exists at the expansion joint and should be taken into consideration when designing both the approach slab and the bridge and the observed responses generally followed an annual cyclic and/or short term cyclic pattern over time; the expansion joint at one side of the approach slab does not appear to be functioning as well as elsewhere; much larger frictional forces were observed in this study compared to the previous study.
Keywords
Bridge approaches, Bridges, Jointless bridges, Bremer County (Iowa)
Disciplines
Civil and Environmental Engineering
Instrumentation and Monitoring
of Precast Bridge Approach Tied
to an Integral Abutment Bridge
in Bremer County
Final Report
April 2010
About the BEC
The mission of the Bridge Engineering Center is to conduct research on bridge technologies to help bridge designers/owners design, build, and maintain long-lasting bridges.
Disclaimer Notice
The contents of this report reflect the views of the authors, who are responsible for the facts and the accuracy of the information presented herein. The opinions, findings and conclusions expressed in this publication are those of the authors and not necessarily those of the sponsors.
The sponsors assume no liability for the contents or use of the information contained in this document. This report does not constitute a standard, specification, or regulation.
The sponsors do not endorse products or manufacturers. Trademarks or manufacturers’ names appear in this report only because they are considered essential to the objective of the document.
Non-Discrimination Statement
Iowa State University does not discriminate on the basis of race, color, age, religion, national origin, sexual orientation, gender identity, genetic information, sex, marital status, disability, or status as a U.S. veteran. Inquiries can be directed to the Director of Equal Opportunity and Compliance, 3280 Beardshear Hall, (515) 294-7612.
Iowa Department of Transportation Statements
Federal and state laws prohibit employment and/or public accommodation discrimination on the basis of age, color, creed, disability, gender identity, national origin, pregnancy, race, religion, sex, sexual orientation or veteran’s status. If you believe you have been discriminated against, please contact the Iowa Civil Rights Commission at 800-457-4416 or Iowa Department of Transportation’s affirmative action officer. If you need accommodations because of a disability to access the Iowa Department of Transportation’s services, contact the agency’s affirmative action officer at 800-262-0003.
The preparation of this report was financed in part through funds provided by the Iowa Department of Transportation through its “Second Revised Agreement for the Management of Research Conducted by Iowa State University for the Iowa Department of Transportation” and its amendments.
Technical Report Documentation Page
1. Report No. 2. Government Accession No. 3. Recipient’s Catalog No.
InTrans Project 08-335
4. Title and Subtitle 5. Report Date
Instrumentation and Monitoring of Precast Bridge Approach Tied to an Integral Abutment Bridge in Bremer County
April 2010
6. Performing Organization Code
7. Author(s) 8. Performing Organization Report No.
Anna Nadermann and Lowell Greimann InTrans Project 08-335
9. Performing Organization Name and Address 10. Work Unit No. (TRAIS)
Institute for Transportation Iowa State University
2711 South Loop Drive, Suite 4700 Ames, IA 50010-8664
11. Contract or Grant No.
12. Sponsoring Organization Name and Address 13. Type of Report and Period Covered
Office of Bridge and Structures Iowa Department of Transportation 800 Lincoln Way
Ames, IA 50010
Final Report
14. Sponsoring Agency Code
SPR 0000-005
15. Supplementary Notes
Visit www.intrans.iastate.edu for color pdfs of this and other research reports.
16. Abstract
Approach slab pavement at integral abutment (I-A) bridges are prone to settlement and cracking, which has been long recognized by the Iowa Department of Transportation (DOT). A commonly recommended solution is to integrally attach the approach slab to the bridge abutment. This study sought to supplement a previous project by instrumenting, monitoring, and analyzing the behavior of an approach slab tied to a integral abutment bridge. The primary objective of this investigation was to evaluate the performance of the approach slab. To satisfy the research needs, the project scope involved reviewing a similar previous study, implementing a health monitoring system on the approach slab, interpreting the data obtained during the evaluation, and conducting periodic visual inspections of the bridge and approach slab. Based on the information obtained from the testing, the following general conclusions were made: the integral connection between the approach slab and the bridge appears to function well with no observed distress at this location and no relative longitudinal movement measured between the two components; the measured strains in the approach slabs indicate a force exists at the expansion joint and should be taken into consideration when designing both the approach slab and the bridge and the observed responses generally followed an annual cyclic and/or short term cyclic pattern over time; the expansion joint at one side of the approach slab does not appear to be functioning as well as elsewhere; much larger frictional forces were observed in this study compared to the previous study.
17. Key Words 18. Distribution Statement
abutment bridges—approach slabs—slab pavement No restrictions.
19. Security Classification (of this report)
20. Security Classification (of this page)
21. No. of Pages 22. Price
Unclassified. Unclassified. 46 NA
I
NSTRUMENTATION AND
M
ONITORING OF
P
RECAST
B
RIDGE
A
PPROACH
T
IED TO AN
I
NTEGRAL
A
BUTMENT
B
RIDGE IN
B
REMER
C
OUNTY
Final Report April 2010
Principal Investigator Brent Phares
Associate Director, Bridge Engineering Center Institute for Transportation, Iowa State University
Research Assistant Anna Nadermann
Authors
Anna Nadermann and Lowell Greimann
Sponsored by
Iowa Department of Transportation and Federal Highway Administration
(SPR 0000-005)
Preparation of this report was financed in part
through funds provided by the Iowa Department of Transportation through its Research Management Agreement with the
Institute for Transportation (InTrans Project 08-335)
A report from
Institute for Transportation Iowa State University 2711 South Loop Drive, Suite 4700
Ames, IA 50010-8664
TABLE OF CONTENTS
ACKNOWLEDGMENTS ... ix
EXECUTIVE SUMMARY ... xi
INTRODUCTION ...1
1.1 Background ...1
1.2 Objectives ...1
2. PREVIOUS WORK ...2
3. PROJECT DESCRIPTION ...3
3.1 Bridge Description ...3
3.2 Approach Slab Description ...3
3.3 Instrumentation ...5
4. RESULTS ...9
4.1 Temperature ...9
4.2 Coefficient of Thermal Expansion ...12
4.3 Strain and Force ...15
4.4 Joint Movements ...26
4.5 Visual Inspection ...30
5. SUMMARY, CONCLUSIONS, AND RECOMMENDATIONS ...31
5.1 Summary ...31
5.2 General Conclusions ...32
5.3 Recommendations ...33
LIST OF FIGURES
Figure 3.1. Plan view of precast approach slab with bridge and existing pavement (see Figure
3.2 for slab panel dimensions) ...4
Figure 3.2. Plan view of precast approach slab ...4
Figure 3.3. Elevation view of precast approach slab ...5
Figure 3.4. Longitudinal joint at centerline of approach slab an location of mechanical splicer bar (Bierwagen 2009) ...5
Figure 3.5. Instrumentation layout ...6
Figure 3.6. Installed embedded strain gauge in the temperature compensation beam form ...7
Figure 3.7. Installed embedded strain gauge in the approach slab form...8
Figure 3.8. Installed crackmeter (D1CRACK) ...8
Figure 4.1. Temperature variation in approach slab (see Figure 3.5 for X-location) ...9
Figure 4.2. Average approach slab temperature over time ...10
Figure 4.3. Air temperature over time ...11
Figure 4.4. Average approach slab temperature and Waterloo, Iowa air temperature over time ..11
Figure 4.5. Correlation of daily high and low Waterloo, Iowa air temperatures with daily high and low average approach slab temperatures...12
Figure 4.6. Temperature compensation beam temperatures and Waterloo, Iowa air temperatures over time ...13
Figure 4.7. Correlation of average air temperatures and compensation beam temperatures ...13
Figure 4.8. Correlation of readout strain and temperature in compensation beam ...15
Figure 4.9. Load strain in approach slab over time (February 2009-February 2010, relative to “average” day) ...16
Figure 4.10. Load strain in approach slab over time for gauge D6 ...16
Figure 4.11. Load strain along A-line of approach slab ...17
Figure 4.12. Load strain along B-line of approach slab ...18
Figure 4.13. Load strain along C-line of approach slab ...18
Figure 4.14. Load strain along D-line of approach slab ...19
Figure 4.15. Load strain across the EF joint of the approach slab for the cold, hot, and average days ...20
Figure 4.16. Load strain across the abutment joint of the approach slab for the cold, hot, and average days ...20
Figure 4.17. Load strain at EF joint ...21
Figure 4.18. Load strain at abutment joint ...22
Figure 4.19. Average load strain at EF joint and abutment joint ...22
Figure 4.20. Average load strain with respect to average slab temperature ...23
Figure 4.21. Average slab force with respect to average slab temperature ...24
Figure 4.22. Average slab force across EF joint and abutment joint ...25
Figure 4.23. Coefficient of friction over time ...26
Figure 4.24. Precast approach slab opening at pavement and abutment joints...27
Figure 4.25. Precast approach slab opening at EF joint ...28
Figure 4.26. EF joint opening across approach slab for cold day, hot day and an average day ....28
Figure 4.27. Abutment joint opening across approach slab for cold day, hot day and an average day ...29
viii
Figure 4.29. Expansion joint movements relative to average slab temperature ...30
LIST OF TABLES
ACKNOWLEDGMENTS
This research was sponsored by the Iowa Department of Transportation Office of Bridges and Structures and received Federal Highway Administration State Planning and Research (SPR) funding. The authors would like to thank Doug Wood, Travis Hosteng, Jake Bigelow, and the many students who were involved on the project for their help completing much of the
EXECUTIVE SUMMARY
Approach slab pavement at integral abutment (I-A) bridges are prone to settlement and cracking, which has been long recognized by the Iowa DOT. The study sought to supplement a previous project, Bigelow et al, by instrumenting, monitoring and analyzing the behavior of an approach slab tied to a integral abutment bridge.
The particular bridge studied is the northbound bridge on US 63 over County Road C-50 in Denver, Iowa in Bremer County. The bridge utilized a precast approach slab system, which was tied to the bridge abutment. An expansion joint type (EF joint) is located near the pavement end of the approach slab. To collect behavior data strain gauges were embedded in the approach slab and crackmeters were fitted to the approach slab at the abutment joint, expansion joint, and pavement joint.
The temperature of the approach slab was monitored using a thermistor in the embedded strain gauges and crackmeters. The air temperature was also monitored using the Weather
Underground website for Waterloo, Iowa. As expected, a linear regression model showed the thermal mass of the approach slab moderates the air temperature. Generally, the slab temperature was relatively uniform throughout the slab for hot and cold days and were consistent with the daily high and low air temperatures.
In order to determine the coefficient of thermal expansion of the concrete, an unconfined, temperature compensation, concrete beam was instrumented similarly to the approach slab. The coefficient of thermal expansion of the concrete was found to be 5.1 µε/˚F.
The approach slab was instrumented with 24 embedded strain gauges. The load strain in the approach slab was determined by correcting the readout strain for temperature. The slab force was proportional to the load strain.
The load strain and slab force moved toward tension in the winter months and compression in the summer months with seasonal and short term cyclic patterns observed in the data as was
observed in the Bigelow et al. (2008) study. This study did, however, differ from the previous study (Bigelow et al. 2008), in that the load strain and slab force were neither transversely nor longitudinally uniform. The slab force had a total range of 3662 kip or a stress range of 713 psi.
The total friction force along bottom of the slab was found as the difference between the average forces at the abutment and EF joints. The resulting coefficient of friction varied over a wide range, which differs significantly from the Bigelow et al. (2008) study.
The crackmeter data showed the approach slab had much larger movements in the EF joint (ranging 0.9 in.) relative to the abutment and pavement joints with movement of less than 0.02 in. The EF joint opening increases as the average slab temperature decreases. As found in the Bigelow et al. (2008) study, there are significant thermal forces at the EF joint.
xii
The integral connection between the approach slabs and the bridge appear to function well.
Forces exist at the expansion joint and should be taken into consideration when designing both the approach slab and the bridge.
The observed responses generally followed an annual cyclic and/or short term cyclic pattern over time.
The EF joint at one side of the approach slab does not appear to be functioning as well as elsewhere.
INTRODUCTION
1.1Background
The Iowa Department of Transportation (DOT) has long recognized that approach slab
pavements at integral abutment bridges are prone to settlement and cracking, which is manifested as the “bump at the end of the bridge.” The bump is not a significant safety problem; rather it is an expensive maintenance issue. Further, public perception is negatively affected by the presence of the bump. The formation of the bump is typically attributed to settlement of backfill soil under the approach slab, deterioration of the corbel or paving notch, and poorly functioning expansion joints. Integral abutment (I-A) bridges are believed by many engineers to worsen the bump, although it is recognized that I-A bridges have many other highly desirable attributes. A commonly recommended solution is to attach the approach slab to the bridge abutment, which moves the expansion joint typically found at the approach slab/abutment interface to a location further from the bridge where soil settlement is less of a concern and maintenance is easier. Other midwest states utilize this type of connection.
Two new bridges were constructed on US 63 over County Road C-50 (Fayette Street) in Denver, Iowa in Bremer County. The south approach slab of the bridge carrying the northbound traffic was chosen as a test bed for testing such a connection detail. The bridge utilized a precast approach slab system.
1.2Objectives
A similar project, Integral BridgeAbutment-to-Approach Slab Connection, was conducted on a bridge in O’Brien County, Iowa in 2008. That project investigated a methodology for connecting the approach slab to the bridge abutment (Bigelow et al. 2008). The work provided case-specific behavior information. The project at hand seeks to supplement the approach slab results from the previous project by instrumenting, monitoring, and analyzing the behavior of an approach slab tied to an integral abutment bridge in Bremer County, Iowa.
The recommendation of the previous project included further study with monitoring programs that utilized instrumentation to eliminate the observed uncertainties of the Bigelow et al. (2008) project and a method to determine the coefficient of thermal expansion for the particular concrete on the project. As such, a health monitoring system was installed to monitor approach slab strain changes, temperatures, approach slab joint relative displacements, and coefficient of thermal expansion of concrete. The objectives of this work are as follows:
1. Evaluate the performance of the approach slab.
2. Determine the range of forces that should be considered when designing integral abutment bridges with integrally connected approach slabs.
2 2. PREVIOUS WORK
I-A bridges are widely used across the country, Bigelow et al. (2008) discusses the results of testing an integral approach slab to abutment connection in such a bridge. Two new side-by-side three span precast concrete girder bridges constructed in 2006 on the new Iowa Highway 60 bypass of Sheldon, Iowa in O’Brien County were chosen as test bridges for evaluation of the connection detail. The integral approach slab to abutment connection detail was implemented at both bridges. These are the first bridges in Iowa to tie the approach slab to an I-A bridge. The northbound bridge utilized an approximate 77 ft long precast approach slab system while the southbound bridge utilized an approximate 30 ft long cast-in-place approach slab system. All other aspects of the bridges were identical: 303 ft x 40 ft three-span-continuous, right-hand-ahead 30 degree skew, supported by HP10x57 piles.
The research team instrumented the south approach slab, abutments, and south bridge span of both bridges in order to determine the performance of the approach slab, the effects on the bridge, and the possible range of forces to consider when designing connected approach slabs. A wide variety of sensors were installed on the bridge and the approach pavement to monitor the following behaviors: temperature, bridge abutment movement (translation and rotation), bridge girder strain changes, approach slab strain changes, post-tensioning strand losses, approach slab joint relative displacement, and bridge abutment pile strain changes. Readings from the various elements were collected every hour for one year (April 2007 to April 2008).
From the results of the testing, the following conclusions were made by Bigelow et al. (2008):
There is no observed distress at the connection and no relative longitudinal movement measured between the approach slab and bridge components.
The bridge abutment displacements and girder forces appear to be impacted by tying the approach slab to the bridge, possibly due to the manner in which the approach slab is attached to the mainline pavement.
The longer precast slab and the shorter cast-in-place slab appear to have different impacts on the bridge. Although, it is unclear whether the greatest difference is due to the type of approach slab or the size of the approach slab.
The force in the expansion joint, indicated by the measured strains in the approach slab, should be taken into considerations when designing both the approach slab and the bridge.
Generally, the observed responses followed an annual cyclic and/or short term cyclic pattern. The annual cyclic pattern had summer responses at one extreme and winter responses at the other extreme, with spring and fall responses
3. PROJECT DESCRIPTION
3.1Bridge Description
The bridge selected for this project is located on US 63, west of Denver, Iowa, at the crossing of County Road C-50 (Fayette Street). The instrumented precast approach slab is depicted in Figure 3.1. The northbound bridge is a three-span precast concrete girder bridge, 161 ft x 40 ft, with a right-hand-ahead 2°29'52" skew angle. The bridge is inclined with a change in elevation from the south abutment to the north abutment of 9.5 in.
3.2Approach Slab Description
The approach slabs for both bridges at this site consist of precast prestressed panels. The approach slab that was instrumented and tested was the south approach slab of the northbound bridge (see Figure 3.1).
The approach slab uses both precast and cast-in-place shoulder sections (see Figures 3.1 and 3.2). The precast approach slab panels are shown in Figure 3.2. Each approach slab consists of eight precast prestressed panels that are nominally 12 in. thick, except at the abutment where the thickness was reduced to 9.5 in. to match the exiting paving notches (see Figure 3.3). The four panels at the pavement end of the approach are rectangular and doweled to the pavement (E joint). The four panels at the bridge end of the approach are trapezoidal with a 2°29'52" skew to match the bridge. The approach slab is connected to the bridge by an angled dowel bar as depicted in Figure 3.3. A pavement expansion joint (Iowa DOT standard EF joint) was used in the precast panels; the joint is four feet from the pavement end of the approach slab. A friction reducing polyethylene sheeting was used under the approach slab.
An open joint and a keyway joint were used to connect the longitudinal joints at the centerline and shoulders, respectively (Bierwagen 2009). The centerline joint included threaded mechanical bars with 3 in. x 12 in. full depth grouted pockets spaced at 12 in. (see Figure 3.4). A 5/8 in. stainless steel dowel, drilled and grouted into the existing abutment paving notch, was used to connect the approach slab to the abutment. For more construction details, refer to Bierwagen (2009).
4
Figure 3.1. Plan view of precast approach slab with bridge and existing pavement (see Figure 3.2 for slab panel dimensions)
Figure 3.2. Plan view of precast approach slab
BRIDGE DECK CAST-IN-PLACE
SHOULDER EXISTING
PAVEMENT
2°29'25" 41'-10"
N
PRECAST APPROACH SLAB (8 PANELS)
7'-10" 12' 12' 3'-10" 4'
N 19'-2 169"
PRECAST SHOULDER
PRECAST SHOULDER
[image:20.612.151.436.397.686.2]Figure 3.3. Elevation view of precast approach slab
Figure 3.4. Longitudinal joint at centerline of approach slab an location of mechanical splicer bar (Bierwagen 2009)
3.3Instrumentation
All of the instrumentation consists of vibrating wire sensors manufactured by Geokon. These sensors operate on the principle that a given wire will vibrate at a certain frequency dependent on the wire length and wire tension. As the length of the wire changes, so does the frequency. Readings are taken by “plucking” the wire and measuring the frequency with an electromagnetic coil. These readings were collected by a CR 1000 data logger.
A total of 32 sensors were installed on the approach slab (24 strain gauges and 8 crackmeters). The strain gauges were intended to measure the strain in the approach slab and the crackmeters were intended to measure the relative movement at the approach slab joints. The instrumentation layout can be seen in Figure 3.5.
# 8 DOWEL BAR
1 12" Ø PLAIN ROUND DOWEL
W/ EXPANSION TUBE
#5 DOWEL BAR (STAINLESS STEEL) 4 MIL POLYETHELENE
SHEETING 4'
10" 10"
VARIES (19'-2 169" TO 20'-11 12")
7" 10" 'EF' JOINT
(PRECAST) (PRECAST) 1" "E" JOINT
1" Ø MECHANICAL SPLICER BAR GROUT POCKET
& LONG. JOINT
5a BARS
? LONG. JOINT & APPROACH SLAB
GROUT POCKET
3" x 12"
PRECAST PANEL PRECAST PANEL
5"
L
6
Figure 3.5. Instrumentation layout
3.3.1. Temperature
A thermistor encapsulated in the coil of each sensor recorded the temperature at the gauge and, hence, the approach slab temperature. For comparison, ambient air temperature data were also collected from the Weather Underground website for Waterloo, Iowa.
3.3.2. Temperature Compensation
A temperature compensation concrete beam was instrumented in the same manner as the approach slab in order to determine the coefficient of thermal expansion of the concrete. The beam measured 6 in. x 6 in. x 36 in.and was unconfined. The beam was placed under the bridge beside the south abutment. Figure 3.6 is a photograph of the installed strain gauge in the beam form prior to concrete placement.
Figure 3.6. Installed embedded strain gauge in the temperature compensation beam form
3.3.3. Approach Slab
Geokon VCE-4200 Vibrating Wire Strain Gauges were embedded in the approach slab. Twelve strain gauges were placed in each of the precast shoulders of the approach slab (see Figure 3.5). Gauges A1 to A6 and B1 to B6 were cast in the west precast shoulder. Gauges C1 to C6 and D1 to D6 were cast in the east precast shoulder. In all cases the strain sensors were placed at mid-depth. The sensors were installed between two longitudinal reinforcing bars with wire tying them together. Figure 3.7 is a photograph of a typical installed embedded strain gauge prior to
8
Figure 3.7. Installed embedded strain gauge in the approach slab form
3.3.4. Joints
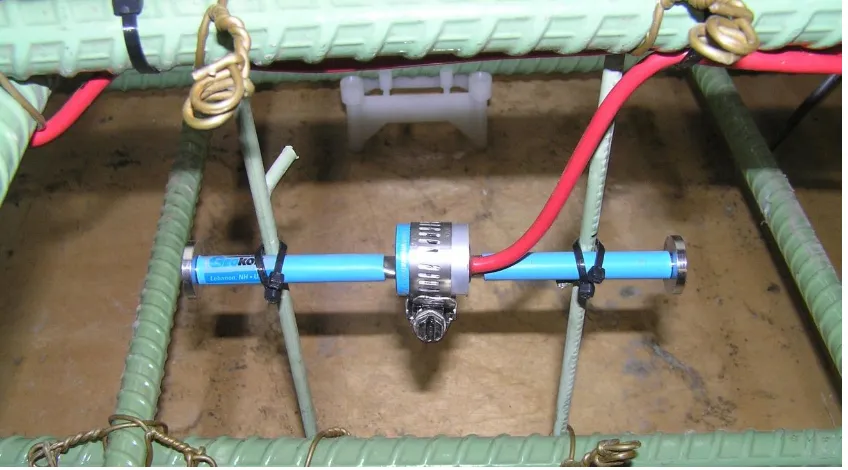
The approach slab was instrumented with eight Geokon Model 4420 Vibrating Wire Crackmeters. Two of the crackmeters were placed across the bridge to approach slab joint (A6CRACK and D6CRACK), two were placed across the approach slab to existing pavement joint (A1CRACK and D1CRACK), and four were placed across the EF joint (A3CRACK, B3CRACK, C3CRACK, D3CRACK). Special block-outs were cast into the approach slabs at each joint to accommodate the sensors. Figure 3.8 is a photograph of a typical crackmeter, D1CRACK. The relative movement at the crackmeter location is recorded as the joint opens and closes.
Figure 3.8. Installed crackmeter (D1CRACK)
[image:24.612.84.528.499.700.2]4. RESULTS
Instrument data were collected from October 24, 2008 through January 19, 2010 for all sensors. Due to some observed inconsistencies in the data, the data collection system was recalibrated at 1:00 p.m. on February 25, 2009. No data from before the recalibration date are presented herein.
4.1Temperature
[image:25.612.72.540.274.550.2]A typical plot of temperature with respect to position of the gauges along the precast approach slab is shown in Figure 4.1. The hot temperature data occurred on July 21, 2009 at 12:00 p.m. (noon) and the cold temperature data occurred on January 5, 2010 at 12:00 p.m. (noon). Figure 4.1 shows that the temperatures across and along the slab were relatively uniform, varying somewhat more on cold days than hot days.
Figure 4.1. Temperature variation in approach slab (see Figure 3.5 for X-location)
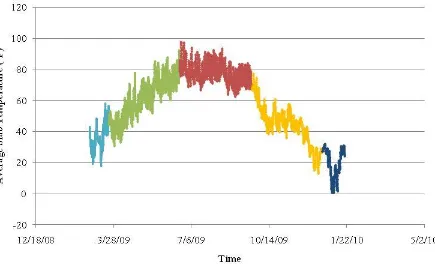
The temperature data from all 24 gauges were averaged together and are shown in Figure 4.2. The average extreme low slab temperature was 0.5° F and occurred on January 3, 2010 at 10:00 a.m. The average extreme high slab temperature was 97.5° F and occurred on June 22, 2009 at 7:00 p.m.
10
Figure 4.2. Average approach slab temperature over time
Table 4.1. Seasonal dates and corresponding temperatures
Season Dates Color
Winter 2009 2/25 to 3/21
Spring 3/22 to 6/21
Summer 6/21 to 9/21
Fall 9/22 to 12/21
Winter 2010 12/22 to 1/19
The Waterloo, Iowa daily air temperatures shown in Figure 4.3 were obtained from the Weather Underground website (http://www.wunderground.com/history/airport/KALO/2009/3/23/Monthly History.html#calendar). The extreme low air temperature of -34° F occurred on January 16, 2009. The extreme high air temperature of 93° F occurred on June 23, 2009.
Figure 4.4 compares the average approach slab temperatures (Figure 4.2) and the daily high and low air temperatures in Waterloo, Iowa (Figure 4.3).
Figure 4.3. Air temperature over time
Figure 4.4. Average approach slab temperature and Waterloo, Iowa air temperature over time
Air Temperature
12
Figure 4.5. Correlation of daily high and low Waterloo, Iowa air temperatures with daily high and low average approach slab temperatures
4.2Coefficient of Thermal Expansion
Figure 4.6. Temperature compensation beam temperatures and Waterloo, Iowa air temperatures over time
Figure 4.7. Correlation of average air temperatures and compensation beam temperatures
Air Temperature
14
The total strain read by a typical gauge in concrete is given, respectively, by the following:
(4.1)
(4.2)
where:
Δε = Change in total strain
ΔR = Change in readout of the gauge ΔT = Change in temperature
B = Batch gauge factor supplied by manufacturer α = Coefficient of thermal expansion
gauge = properties or changes in the gauge
concrete = properties or changes within the concrete
load = changes caused by load
Because the gauge is installed in concrete, the total strain of the gauge and concrete must be the same. The load strain (Δεload) can then be found by equating Equations 4.1 and 4.2, and solving for load strain.
(4.3)
Since the temperature compensation beam is allowed to expand and contract freely:
(4.4)
Or substituting into Equation 4.3 and solving for αconcrete gives
(4.5)
Figure 4.8 is a plot of readout strain ΔRB with temperature. The slope of the linear regression line (ΔRB/ΔT) in Figure 4.8 is -1.7 µε/°F. Using Equation 4.5, with 6.78 µε/°F as the
Figure 4.8. Correlation of readout strain and temperature in compensation beam
4.3Strain and Force
4.3.1. Load Strain
The approach slab was instrumented with 24 vibrating wire strain gauges as described Section 3.3 and shown in Figure 3.5. The temperature information obtained from the thermistor was used to correct the strain gauge readout and to determine the load strain (strain caused by an applied load or a restraining force) using Equation 4.3.
The load strain time history, for all functioning gauges after February 25, 2009, is shown in Figure 4.9. In general, as the temperature decreases the load strain within the slab increases (i.e., the load strain moves toward tension in winter months and toward compression in summer months). The strain data shown in Figure 4.9 are relative to the “average” day listed in Table 4.2 (i.e., the data were zeroed on the “average” day). The three vertical lines represent the cold, hot and average days (see Table 4.2).
16
[image:32.612.84.530.71.349.2]Figure 4.9. Load strain in approach slab over time (February 2009-February 2010, relative to “average” day)
Table 4.2. Hot day, cold day, and average day data
Hot Day Cold Day Average Day
Date, Time July 21, 2009,
12:00 p.m. (noon)
Jan. 5, 2010, 12:00 p.m. (noon)
Apr. 18, 2009, 4:00 p.m.
High Air Temp. (˚F) 72 5 65
Low Air Temp. (˚F) 53 -11 42
Avg. Slab Temp. (˚F) 71.5 2.1 58.5
Figures 4.11 through 4.14 show how the load strain varies longitudinally on the cold, hot, and average days along the A, B, C, and D lines of gauges. Each of these figures shows the locations of the EF joint and the abutment joint. These figures also show the linear regression line on the cold day (when strain varies the most) with the linear regression line extrapolated to the
[image:33.612.86.545.311.587.2]abutment joint. The linear regression lines on the cold day for gauge lines A, B, and D have slopes of differing magnitudes but in the same direction (i.e., the load strain is decreasing longitudinally toward the abutment). The linear regression line on the cold day for gauge line C slopes in the opposite direction (i.e., the load strain is increasing toward the abutment).
Figure 4.11. Load strain along A-line of approach slab
18
Figure 4.12. Load strain along B-line of approach slab
Figure 4.13. Load strain along C-line of approach slab
Abutment Joint EF Joint
[image:34.612.98.548.406.679.2]Figure 4.14. Load strain along D-line of approach slab
The transverse variation in load strain along the EF joint and abutment joint is shown in Figures 4.15 and 4.16, respectively. Figures 4.11 through 4.16 show the load strain varies more on cold days than on hot days across and along the slab.
20
Figure 4.15. Load strain across the EF joint of the approach slab for the cold, hot, and average days
[image:36.612.89.526.396.661.2]The load strains at the EF joint and abutment joint, from the A, B, C, and D lines in Figures 4.11 through 4.14, are shown in Figures 4.17 and 4.18, respectively. Figure 4.19 shows the average of the A, B, C, and D loads strains at the EF and abutment joints. The connection of the precast panels to the cast in place shoulders may have an impact on the strains in the precast panels.
22
[image:38.612.90.530.393.662.2]Figure 4.18. Load strain at abutment joint
The average load strain of all the gauges in the entire approach slab is plotted with respect to the average slab temperature in Figure 4.20. A cyclical pattern emerges with the winter and summer having the maximum and minimum load strain, respectively, while the spring and fall are seen as the transition periods. Some evidence of short term cycling (dashed lines) is present in Figure 4.20, as was observed in the previous study (Bigelow et al. 2008).
Figure 4.20. Average load strain with respect to average slab temperature
4.3.2. Force
The change in approach slab longitudinal force relates to the change in approach slab load strain by the equation:
(4.6)
where:
ΔP = change in the approach slab force Aconcrete = cross-sectional area (A = 5,136 in.2) Econcrete = 57000 * (f ’c)1/2 (f ’c = 8376 psi)
24
[image:40.612.89.530.120.384.2]range of approximately 3662 kip relates to a 713 psi stress change in the slab from winter to summer.
Figure 4.21. Average slab force with respect to average slab temperature
Figure 4.22. Average slab force across EF joint and abutment joint
The friction force on the slab was calculated as the difference between the average EF joint force and average abutment joint force (see Figure 4.22). Equation 4.7 relates the friction force in the bottom of the slab to the coefficient of friction.
(4.7)
where:
µ = coefficient of friction
∆P abutment = change in the approach slab force at the abutment joint ∆P EF = change in the approach slab force at the EF joint
γconcrete = density of concrete (γ = 150 pcf) Aconcrete = cross-sectional area (A = 5,136 in.2)
L = length of approach slab between EF joint and abutment joint
Figure 4.23 is the time history of the coefficient of friction. During the summers months the coefficient of friction approximately ranges from -2.5 to 2.5. During the winter months, when the force in the EF and abutment joint varies more, the coefficient of friction of nearly 25 was
26
Figure 4.23. Coefficient of friction over time
4.4Joint Movements
The approach slab joints were equipped with eight crackmeters (see Figure 3.5), two at the abutment joint, four at the expansion joints and two at the pavement joint, to monitor joint opening and closing over time. The opening at the crackmeters is related to the change in readings by Equation 4.8.
(4.8)
where:
∆D = crackmeter opening
K = crackmeter thermal correction factor given by supplier G = gauge factor supplied by the manufacturer
crackmeter = properties or changes in the crackmeter
To find the actual opening of the precast slab joints the concrete temperature and load effects must be accounted for over the length of the crackmeter. Equation 4.9 relates the opening of the joint, the opening of the crackmeter, and the length of the crackmeter.
where:
∆δ = joint opening
L = length of crackmeter (L=13.1 in.)
joint = properties or changes in the approach slab
The crackmeter located at the expansion joint between the east shoulder and east travel lane, C3CRACK, was damaged at some point after installation and the data obtained from this
crackmeter were deemed to be unusable. The remaining crackmeters provided usable data during the duration of the project. Figure 4.24 shows the joint movement data across the abutment and pavement joints of the approach slab. Figure 4.25 shows the joint movement data across the EF joint of the approach slab A positive movement indicates that the joint is opening. Figure 4.24 shows the crackmeters located along the abutment joint and pavement joint had movements of less than 0.02 in. Figure 4.25 shows the crackmeters located along EF joint indicate relatively larger movements ranging from 0.35 in. during winter months to 0.55 in. during summer months for a total range of 0.90 in.
Figures 4.26 and 4.27 show the opening across the approach slab for a cold day, hot day and an average day for the EF and abutment joints, respectively. Comparing Figures 4.26 and 4.27 shows the EF joint opens more than the abutment joint on hot and cold days.
[image:43.612.89.523.401.675.2]The average expansion joint opening is shown relative to average slab temperature in Figure 4.28. The opening of the expansion joint has an inverse relationship with average slab temperature. As the temperature increases the joint opening size decreases.
28
[image:44.612.89.530.378.662.2]Figure 4.25. Precast approach slab opening at EF joint
Figure 4.27. Abutment joint opening across approach slab for cold day, hot day and an average day
[image:45.612.89.527.413.675.2]30
[image:46.612.96.523.192.457.2]Slab force per foot of the approach slab versus joint opening for the EF joint is shown in Figure 4.29. The range of slab forces shown in Figure 4.29 is comparable to the force found in the approach slab of the Bigelow et al. (2008) study. Figure 4.29, similar to Figure 4.15, shows the force in the slab along line D of the slab behaves differently from the force in other areas of the slab. Apparently, the EF joint at line D is not functioning as well as elsewhere resulting in larger thermal forces, which may be affected by the connection of the cast in place shoulder to the bridge wing wall.
Figure 4.29. Expansion joint movements relative to average slab temperature
4.5Visual Inspection
A visual inspection of the bridge and approach slab was performed during a visit to the project site on January 19, 2010. During this visit no cracks were present in the precast approach slab panels or the cast-in-place shoulders.
-150 -100 -50 0 50 100 150
-0.75 -0.5 -0.25 -1E-15 0.25 0.5 0.75
S la b F o r c e /f t (k ip /f t)
Joint Opening (in.)
EF Joint
5. SUMMARY, CONCLUSIONS, AND RECOMMENDATIONS
5.1Summary
The Iowa DOT has long recognized that approach slab pavement at I-A bridges are prone to settlement and cracking, which is manifested as the “bump at the end of the bridge.” A
commonly recommended solution is to attach the approach slab to the bridge abutment, which moves the expansion joint typically found at the approach slab/abutment interface to a location further from the bridge where soil settlement is less of a concern and maintenance is easier.
Two new bridges were constructed on US 63 over County Road C-50 (Fayette Street) in Denver, Iowa in Bremer County. Both the bridges utilized a precast approach slab system. Each approach slab in made up of eight precast prestressed panels. The approach slabs have precast and cast-in-place shoulders. The approach slab has an EF joint near the pavement end.
The south approach slab of the bridge carrying the northbound traffic was chosen as a test bridge for studying such a connection detail. The northbound bridge is a three-span precast concrete girder bridge with a right-hand-ahead skew angle. This project sought to supplement the
approach slab results from a previous project, Bigelow et al., by instrumenting, monitoring, and analyzing the behavior of an approach slab tied to an integral abutment bridge in Bremer County.
5.1.1. Temperature
Slab temperatures were recorded with a thermistor in the gauges embedded in the approach slab. Air temperatures were obtained from the Weather Underground website for Waterloo. The slab temperatures were relatively uniform throughout the slab on both hot and cold days with
variations of less than 5° F on the days selected. Average slab temperatures were consistent with the high and the low daily air temperatures. A linear regression model showed that, as expected, the thermal mass of the approach slab moderates the air temperature.
5.1.2. Coefficient of Thermal Expansion
An unconfined, temperature compensation concrete beam was instrumented in the same manner as the approach slab in order to determine the coefficient of thermal expansion of the concrete that was found to be 5.1 µε/°F.
5.1.3. Strain and Force
The approach slab was instrumented with 24 embedded strain gauges. The load strain was
32
The slab force is proportional to the load strain and therefore the slab force data yield similar results to the load strain data. The same seasonal and short term cycling present in the load strain data can be seen in the slab force data. Like the load strain, the slab force is neither transversely nor longitudinally uniform. These non-uniformities may be attributable to how the cast in place shoulder is connected to the bridge wing wall. The slab forces move toward compression in the summer and tension in the winter with a total range of 3662 kip, or a stress range of 713 psi.
The total friction force along the bottom of the slab was taken as the difference in the average abutment and EF joint forces. The coefficient of friction was determined from the friction force acting on the slab and the weight of the slab and varied over a wide range (-2.5 to 25); which, again, differs significantly from the Bigelow et al. study.
5.1.4. Joint Movements
The abutment joint, pavement joint, and expansion joint were fitted with a total of eight crack meters. The crackmeters along the expansion joint revealed movements a range of 0.90 in while the pavement and abutment joints had considerably smaller movements, movements of less than 0.02 in. The average expansion joint opening is inversely related to the average slab temperature, i.e., increasing as the temperature decreases. Significant thermal forces exist at the expansion joint and are not transversely uniform.
5.1.5. Visual Inspection
The approach slab and bridge were visually inspected during the monitoring process. No cracks were observed during the monitoring period.
5.2General Conclusions
The results summarized above led to the following conclusions:
The integral connection between the approach slabs and the bridge appear to function well with no observed distress at this location and little relative longitudinal movement measured between the two components.
The measured strains in the approach slabs indicate a force exists at the expansion joint and should be taken into consideration when designing both the approach slab and the bridge.
The observed responses generally followed an annual cyclic and/or short term cyclic pattern over time. The annual cyclic pattern had summer responses at one extreme, a transition through the fall to the other extreme response in the winter, followed by a transition in the spring back to the summer responses. A linear relationship of the transitions between the extreme responses was typically observed. Seasonal and short term cycles were evident in most data, probably caused by friction ratcheting.
The location of the EF joint, near the abutment or the pavement, does not appear to affect the functionality of the joint.
Much larger frictional forces were observed in this study compared to the Bigelow et al. study.
5.3Recommendations
As a first recommendation, from the data reported herein, and the Bigelow et al. study, the authors recommend that additional bridges be constructed using the approach slabs and
connection studied herein, and that these new bridges be monitored at the same level. At some point, it may be appropriate to consider retrofitting older bridges.
Further bridge monitoring programs would contribute to better understanding of integral abutment bridges with integral approach slabs and different skew angels, span lengths, slab length, horizontal alignments, and girder type (concrete or steel), especially since not all the experimentally measured results compared with previous studies (Bigelow et al. 2008), which did not report non-uniform strains throughout the approach slab.
In addition, future studies should also monitor if a “bump” is still created at the
bridge-to-approach slab connection location, if the bump is moved to the expansion joint location, or if the bump is eliminated altogether.
34 REFERENCES
Beirwagen, Dean, Sunday, Wayne, Abu-Hawash, Ahmad, Wipf, Terry, Accelerated Precast Bridge Approach Slab Replacement, PCI Bridge Conference, San Antonio, TX September 15, 2009.