International Journal of Innovative Technology and Exploring Engineering (IJITEE) ISSN: 2278-3075, Volume-8 Issue-7, May, 2019
Abstract: It is well heard and invisible problem of different kinds of deceptions happening with the rise of ecommerce technology developments. Specifically, such problems need to be addressed and controlled. This paper presents various implementation techniques that are necessary for identifying irregularities in the usage of card systems. The ultimate outcome is to identify the finances loss anomaly. In view of the current state of art, the problem is considered to address with machine and deep learning methods. To eradicate fraudulency, it is proposed to apply random forest, SVM of machine learning techniques and CNN deep learning method. The comparative analysis of the proposed methods is discussed in the paper. The performance study of the proposed techniques is also covered.
Index Terms: Card systems, deceptions, irregularities, machine learning.
I. INTRODUCTION
Credit card fraud is another adjunct to identity theft in financial loss. This is a high end problem which needs to be emphasized to meet the societal issues. Recently, in and around India, Reserve Bank of India (RBI) registered a total of 921 cases of fraud involving ATM /debit cards, credit cards and internet banking where the amount involved was Rs 1lakh and above during 2018-2019. In 2015-2016, 2016-2017, 2017-2018, the number of such RBI-registered fraud cases was 1,191, 1,372 and 2,059 respectively. In 2016, 12,317 cybercrime cases were registered, according to data maintained by the National Crime Records Bureau (NCRB). [6]The government shows that all-India losses from fraud by 78 standard banks and private commercial banks were Rs.69,770 crore. This problem is spreading in small regions and every part of the country. Similarly, Andhra Pradesh banks suffered losses of 2,721 crore from 594 cases of fraud. Over the same period, the 78 commercial banks across the country reported about 22,949 cases of fraud. From these observations, it is very necessary to identify and classify the scams, thefts and deceptions taking place with the card system payment methods. [7]The following are different types of credit card frauds :
Stolen Cards: Unauthorized theft of cards of authorized users
Revised Manuscript Received on May 10 ,2019
Naziya Shaik, Department of Information Technology, VR.Siddhartha Engineering College, Vijayawada, India.
Priyanka Sanikommu, Department of Information Technology, VR.Siddhartha Engineering College, Vijayawada, India.
Phishing Mails: In transactions involving NP (Card Not Present), merchants rely on user providing the credit card information.
Skimming: theft of credit card information through various means.
Carding: applying different means and verifying the authenticity of the card's stolen data.
Application Fraud: fake or stolen data is used in the name of others to open an account.
Account Takeover: Account acquisition takes possession of the account of others.
II. BACKGROUNDWORK
With the summary and explanation of the complete and current state of knowledge the problem to identify scams in payment methods is considered.
[1]Sahil Dhankhad, Emad A. Mohammed, Behrouz proposed supervised machine learning algorithms to detect fraudulent transactions. A comparison is done on various supervised machine learning algorithms that provides the best/highest accuracy. [2]John Richard D. Kho, Larry A. Vea suggested to capture the possible anomalous transactions. Several classifiers like Random Tree and J48 are applied. [3]John O. Awoyemi, Adebayo O. Adetunmbi, Samuel A. Oluwadare investigated the performance of Naive Bayes, k-nearest neighbor, and logistic regression and performance is evaluated based on accuracy, sensitivity, specificity, precision, Matthews’s correlation coefficient, and balanced classification rate. [4] Prajal Save, Pranali Tiwarekar, Ketan N. Jain, Neha Mahyavanshi recommended Luhn's algorithm and Hunt's algorithm to validate the card number to guarantee whether a transaction is a fraud or genuine. [5] Kang Fu, Dawei Cheng, Yi Tu, and Liqing Zhang proposed an approach to find fraudulent transactions with convolutionary neural network (CNN). Here more complex fraud patterns are used to improve classification accuracy. Cost-based sampling is used to generate number of frauds.
III. PROPOSEDMETHOD
For the considered problem, the system model is developed to highlight the implementation details. Firstly, the overall system design of the proposed method to identify the frauds in the given dataset is shown in Fig 3.1.
Dataset collection phase includes the collection genuine and fraud transactions.
Designed Methodologies to Recognize Credit
Card Deceptions with Machine and Deep
Learning Techniques
Figure 1 Proposed design
To address the problem, we considered the dataset from kaggle. The dataset presents transactions that occurred in two days, which contains 284807 transactions. [11]The dataset is highly unbalanced. It contains only numerical input variables which are the result of a PCA transformation. Here the actual data is split to form train and test datasets. The data is divided into training data and testing data based on the ratio provided.
[10]The training data obtained after partitioning is given to the respective models of either Support Vector Machine/Random Forest/convolutional neural network algorithms for training these models. Now by using the trained support vector machine/Random forest/Convolutional neural network respective models are built to test the test data. The test data is passed to these models developed through training. When the test data is passed to the models based on the training they have gone through these models gives respective results for each model like the Accuracy, frauds and genuine count.
A. Support Vector Machine (SVM):
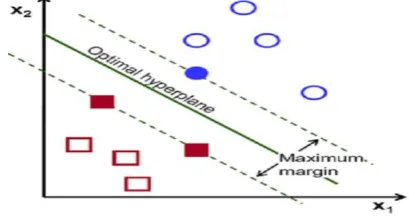
[image:2.595.305.549.108.272.2]Support Vector Machines (SVM) and Support Vector Networks (SVN) are supervised methods of machine learning for classification and regression purposes to analyze, detect and match data patterns. SVM is a non-probabilistic linear binary classifier assigning training data to one or more categories. Using Kernel Trick, it can also be used effectively for nonlinear classification problems. Kernel Trick is a class of SVM algorithms which, in a simple and cheaper computational way, maps the input features into a very high dimensional output space. SVM represents training data as space points that conglomerate in the form of groups separated by a clear distinct gap called a hyperplane based on their category.
Figure 3 Support Vector Machines
The design methodology of the support vector machine algorithm is shown in figure2, which demonstrates the step by step procedure of the overall process to find credit card fraud detection.
Figure 2 System architecture of SVM As shown in figure 2, the details are illustrated :
Step-1: The training data is passed as an input to Features extraction phase. The training data is just the raw data without any further development done.
Step-2: The features extraction method is used for the pre-processing step which is applied for the features of the data. The important features used for the purposed of classification are extracted leaving the remaining ones. The features extracted here are then passed to the next step. Step-3: The function of kernel is to take the data as input and transform the data into the required form like linear, nonlinear, polynomial, radial basis function (RBF), and sigmoid. Here, radial basis function (RBF) is used as a kernel function. It is a general-purpose kernel; used when there is no prior knowledge about the data. This is the mostly used kernel function because of its immense effect towards classification.
Step-4: Cross validation is one method that attempts to maximize the use of the available data for training and then testing a model. It is particularly useful for assessing model performance, as it provides a range of accuracy scores. Step-5: The above selected kernel function and random state is specified are passed into the svc classifier to build a support vector machine training model. The support vector machine algorithm gets trained by using the various features extracted and develops a model which could classify the new data into either genuine or fraud transactions.
Step-6: The test data is further passed into the obtained support vector machine training model, which then classifies the data into genuine or fraud.
Step-7: The test data and the predicted data are compared to obtain the accuracy of the model. To validate the models accuracy confusion matrix is built.
[image:2.595.64.269.642.752.2]International Journal of Innovative Technology and Exploring Engineering (IJITEE) ISSN: 2278-3075, Volume-8 Issue-7, May, 2019
B. Random Forest Tree:
Random Forest is a classification and regression algorithm. In summary, it is a collection of classifiers for the decision tree. [8]Random forest has an advantage over the decision tree as it corrects their training set's habit of overfitting. A subset of the training set is sampled randomly so that each tree is trained and then a decision tree is built, then each node splits on a feature selected from a random subset of the complete feature set. In random forest, training is extremely fast even for large data sets with many features and data instances and because each tree is trained independently of the others. [8]The Random Forest algorithm has been found to provide a good estimate of the generalization error and to be resistant to overfitting. The design methodology of the Random Forest Tree algorithm is shown in figure4, which demonstrates the step by step procedure of the overall process to find credit card fraud detection.
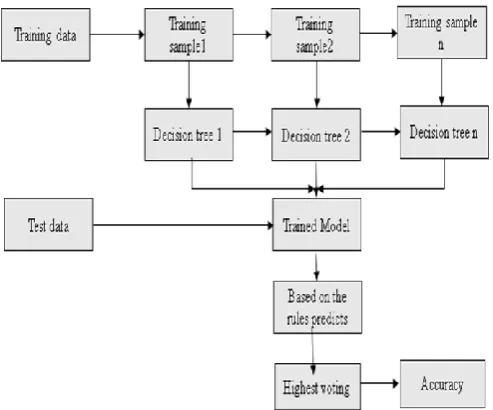
Figure 4 System Architecture of Random Forest Tree
The detailed steps of figure 4 are explained as :
Step-1: The dataset is divided into training and test data based on the percentage given like the training data 70 percent and test data 30 percent.
Step-2: The training data is divided into different training samples randomly by selecting few transactions and decision trees for each sample developed are Formed.
Step-3: The Algorithm gest trained based on the above process being done, firstly selecting random samples and forming decision trees and then this way it gets trained Step-4: The test data is passed to the above trained model and according to the rules formed the test data gets categorized into samples and predicted.
Step-5: The voting is done for the samples being predicted. The ones with the highest voting is given as the final output Step-6: The accuracy of the model is obtained by comparing the actual and the predicted results. The evaluation metrics for this model is the confusion matrix.
C. Convolutional Neural Networks (CNN):
[9]Convolutional neural network (CNN) is a specific type of artificial neural network that uses perceptron’s, a machine learning unit algorithm, for supervised learning, to analyze
[image:3.595.47.294.268.473.2]The design methodology of the Convolutional neural network algorithm is shown in figure 5, which demonstrates the step by step procedure of the overall process to find credit card fraud detection.
Figure 5 System Architecture of Convolutional Neural Network
The detailed steps of figure 5 are presented below :
Step-1: The model type that we will be using is Sequential. Sequential is the easiest way to build a model in Keras. It allows you to build a model layer by layer. Each layer has weights that correspond to the layer the follows it.
Step-2: The ‘add ()’ function is used to add layers to the model. Three layers and an output layer is added.
Step-3: ‘Dense’ is the layer type. Dense is a standard layer type that works for most cases. In a dense layer, all nodes in the previous layer connect to the nodes in the current layer. Each Dense Layer contains Convolutional layer, activation Layer, max pooling layer. Each layer consists of neurons. Each single neuron of the lower layer stores the information and pass the information further to the next layer.
Step-4: The convolutional layer captures the most discriminating features useful for the prediction of the transactions.
Step-5: The activation function after the convolutional operation determines whether and to what extent a signal should be sent to connected nodes. A frequently used activation is just a basic step function that is 0 if its input is less than some threshold and 1 if its input is greater than the threshold. The pooling layer reserves the invariant feature patterns. The activation function we will be using is ‘RELU’. The RELU is the most used activation function in the world right now. Since, it is used in almost all the convolutional neural networks or deep learning.
Step-7: The above process can be repeated as many times as the number of layers are fixed, resulting in repetition of all the layers until the output layer is obtained.
Step-8: Finally, top fully connected layers combine all fed features to do the classification job
Step-9: The last layer is the output layer. It only has one node, which is for prediction. The difference between the tested and predicted results is shown by an optimization algorithm.
Step-10: The optimizer controls the learning rates. The most common optimization algorithm used is Nadam. Step-11: For loss function, ‘mean_squared_error’ is used.. It is calculated by taking the average squared difference between the predicted and actual values. It is a popular loss function for regression problems. The closer to 0 this is, the better the model performed.
IV. RESULTANALYSIS
Various classification techniques were applied on the Dataset from the kaggle which contains various transactions. By applying different classifiers the best classifier can be judged by using confusion matrix and accuracy of classification techniques.
Dataset Collection:
The kaggle dataset contain transactions made by credit cards in September 2013 by European cardholders. [11]This dataset presents transactions that occurred in two days, where there are 492 frauds out of 284,807 transactions. The dataset is highly unbalanced, the positive class (frauds) account for 0.172% of all transactions. It contains only numerical input variables which are the result of a PCA transformation. Unfortunately, due to confidentiality issues, we cannot provide the original features and more background information about the data. Features V1, V2, ... V28 are the principal components obtained with PCA, the only features which have not been transformed with PCA are 'Time' and 'Amount'. Feature 'Time' contains the seconds elapsed between each transaction and the first transaction in the dataset. The feature 'Amount' is the transaction Amount, this feature can be used for example-dependent cost-sensitive learning. Feature 'Class' is the response variable and it takes value 1 in case of fraud and 0 otherwise.
A. Support Vector Machine (SVM):
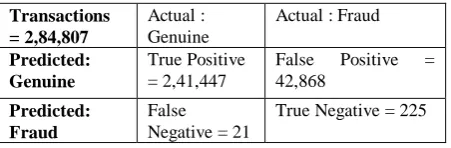
[image:4.595.309.546.554.684.2]SVM algorithm is applied on the dataset for finding genuine and fraud transactions. The Table 1 below shows the confusion matrix obtained by the SVM algorithm. The result below is for all the transactions in the dataset. The total number of transactions are 284807.
Table 1 Confusion Matrix (SVM) Transactions
= 2,84,807
Actual : Genuine
Actual : Fraud
Predicted: Genuine
True Positive = 2,41,447
False Positive = 42,868
Predicted: Fraud
False Negative = 21
True Negative = 225
According to the table 1 , SVM model correctly predicted 241447 transactions as genuine which are actually genuine, 42868 transactions as fraud which are actually genuine, for fraud transactions it predicted 21 transactions as genuine which are actually fraud and 225 transactions as fraud which are actually fraud.. The accuracy of SVM model is 97.2%.
B. Random Forest Tree:
[image:4.595.42.268.683.757.2]Random Forest tree algorithm is applied on the dataset for finding genuine and fraud transactions. The Table 2 below shows the confusion matrix obtained as the results for the test data only. The total number of transactions in test data are 71202.
Table 2 Confusion Matrix (Random Forest) Transactions
=71202
Actual: Genuine Actual: Fraud
Predicted: Genuine
True
Positive=71085
False Positive=4
Predicted: Fraud
False Negative=25 True Negative=88 According to the Table 2, Random Forest model predicted 71085 transactions as genuine which are actually genuine, 4 transactions as fraud which are actually genuine,25 transactions as genuine which are actually fraud and 88 transactions as fraud which are actually fraud. The accuracy of the model thus obtained is 99%.
C. Convolutional Neural Networks (CNN):
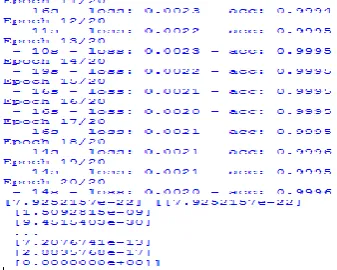
The figure 6, shows the results of the CNN model in 4 layers. Every iteration gives out the loss function and accuracy of the model. Initially the maximum accuracy is obtained and therefore it doesn’t not increase much and becomes stable. The loss function should be gradually low to obtain higher accuracy. The accuracy is obtained after the training and testing are done. The time taken to complete this iteration, loss function and accuracy are shown for each iteration. The Accuracy of this model is 99.96%.
First 10 iterations are shown in figure 6.
International Journal of Innovative Technology and Exploring Engineering (IJITEE) ISSN: 2278-3075, Volume-8 Issue-7, May, 2019
Figure 7 next 10 CNN Iterations
The graph in figure 8 shows the test vs predicted values.The blue lines indicate the resuts of test data and the orange lines indicate the predicted result.Here the observation is that the predicted ones overlap the actual ones showing that the model has predicted well,same as the original one.The area below near the X-axis has dense area and less gaps because this shows that most of the transactions are genuine,where as few are fraud.The grap below also shows that the moel developed has predicted very well.
[image:5.595.54.280.328.716.2]Figure 8 Test vs Predicted Graph
Figure 9 Comparision of proposed methods
V. CONCLUSIONANDFUTUREWORK
Currently the use of credit cards has been increased due to its immense advantages. Although the problem of performing online transactions is not secured completely. Various classification techniques are applied on the kaggle dataset. The results show that convolutional neural networks performs high end classification and gives the accuracy of 99.96%.The results show that support vector machine and random forest are best classifiers among various classifying algorithms by producing higher accuracies. Coming to the machine learning algorithms Support vector machine with RBF kernel and Random Forest algorithm has produced accuracies of 97. 2% and 99% respectively. Although support vector machine model has performed well it lags from Random forest model in less accuracy. Future Work should possess other algorithms in deep learning to classify the transactions more better by producing correct number of genuine or fraud transactions and increased accuracy rates.
REFERENCES
1. Sahil Dhankhad, EmadA.Mohammed, Behrouz Far “Supervised Machine Learning Algorithms for Credit Card Fraud Transaction: A Comparative Study”,IEEE 2018
2. John Richard D. Kho, Larry A. Vea, “Credit Card Fraud Detection Baes on Transaction Behavior”, IEEE 2017
3. John O.Awoyemi, Adebayo O. Adetunmbi, Samuel A. Oluwadare, “Credit Card Fraud Detection using Machine Learning Algorithms”, IEEE 2017
4. Prajal Save, Pranali Tiwarekar, Ketan N. Jain, Neha Mahyavanshi, “A Novel Idea for Credit Card Fraud Detection using Decision tree”, International Journal of Computer Applications 2017
5. Kang Fu, Dawei Cheng, Yi Tu and Liqing Zhang, “Credit card fraud detection using Convolutional Neural Networks”, Springer 2016. 6. https://economictimes.indiatimes.com/industry/banking/finance/banking
/ed-writes-to-investigative-bodies-in-singapore-hong-kong-on-chanda-ko chhar-quid-pro-quo-case/articleshow/69026694.cms
7. https://business.mapsofindia.com/finance/credit-cards/credit-card-frauds. html
8. Morgan-Kaufmann,“Data-Mining.-Concepts-and-Techniques”, 3rd-Edition, 2011
9. Aman Gulati, Prakash Dubey, Jasmine Norman, “Credit card fraud detection using neural networks”, IEEE, 2017.
10.Aman Gulati, Prakash Dubey, Kasmine Norman, “A Novel Idea for Credit Card Fraud Detection using Decision Tree, 2017
11.Suhasini Sodagudi, Sita Kumari Kotha “A case based approach to forecast and detect credit card fraud transactions”, Springer ICFSST 2019 proceedings, April 2019,Veltech University, Chennai