Detection & Classification of Lung Cancer at an
Early Stage by Applying Feature
Extraction-Optimization and Neural Network on Hybrid
Structure
Pankaj Nanglia, Aprana N Mahajan, Paramjit Singh, Davinder Rathee
Abstract: As of now the detection and classification of lung cancer disease is one of the most tedious tasks in the field of medical area. In the diversified sector of medical industry usage of technology plays a very important role. Detection and diagnosis of the lung cancer at an early stage with more accuracy is the most challenging task. So, in this research article 400 set of images has been used for this experiment. Best feature extraction technique and best feature optimization technique has been analyzed on the basis of parameter minimum execution time with minimum error rate. Then finest selection of features leads to an optimal classification. In this context, one of the best classification algorithm the support vector machine has been proposed in this hybrid model for the binary classification. Further Feed forward back propagation neural network has been implemented with SVM. This proposed hybrid model reduces the complexity of the system on the basis of minimum execution time that is 1.94 sec. with minimum error rate 29.25. Further better classification accuracy 99.6507% has been achieved by using this unique hybrid model.
Keywords: Hybrid Structure, Lung Cancer Detection, Feature Extraction, SIFT, SURF, PCA and Feature optimization.
I. INTRODUCTION
Lung cancer is one of the most dangerous diseases that is common today. In India alone, lung cancer causes more than 10,000 deaths per year [1]. The mortality rate is increasing by 10-12% every year. This deadly disease has attracted much attention in the medical industry, and many attempts have already been made to automate the detection process to reduce mortality [1-3]. Identifying lung cancer requires two steps if the research industry is trying to automate the detection process. The first stage is called the training phase, and the second stage is called the classification stage. Phase architecture is easy to understand by looking at the doctor’s procedure. An experienced doctor goes through five to six years of training, and then applies his knowledge to treat people. The learning phase requires effective functions and, therefore, the function extraction algorithm plays a vital role when it comes to system training. This paper describes the methods used to extract the features. The algorithm for extracting attributes is followed by an optimization
algorithm, since each evaluated attribute does not fall into the corresponding category of attributes. The optimized set of functions is passed to the learning algorithm, which creates a controlled learning architecture [2,3-4]. The architecture of supervised learning is used for a disease classification mechanism. The learning algorithm is also divided into two categories, namely, controlled and uncontrolled learning. Inadequate training leads to a process in which a machine can think independently, which is 100% impracticable, and, therefore, even in modern frame architectures, controlled training is used. The entire classification process is presented using a flowchart as follows.
Revised Manuscript Received on December 05, 2019.
Pankaj Nanglia* is currently pursuing Ph.D in Electronics and Communication Engineering in Maharaja Agrasen University,Himachal Pradesh, India,.
Dr Aprana N Mahajan is Professor in Electronics and Communication Engineering in Maharaja Agrasen University,Himachal Pradesh, India,.
Paramjit Singh is currently pursuing Ph.D in Electrical & Electronics Engineering in Maharaja Agrasen University,Himachal Pradesh, India,.
Dr Davinder Rathee is Associate Professor in Electronics and Communication Engineering in Maharaja Agrasen University,Himachal Pradesh, India,.
The algorithmic architecture of the classification process is as follows:
a. For each Cancerous/ Non-Cancerous Image b. Extract Feature Vector
c. Optimize Feature Vector d. Store to db
e. End for
f. Train Optimized Feature Vector g. Upload Test Sample
h. Extract Feature Vector and Optimize i. Use trained db for classification j. Classify and diagnose
In this context, many researchers and scientist produce a lot of effort to classify the lung cancer diseases at an early stage. S. H. Hawkins et.al (2014) proposed an automated CAD system which performed on the CRs and CT scans images. In this CAD system SFS method has been used for feature selection and putting this SFS algorithm for the features of cluster which is based on the collective classifier traits supports better features that are good for clustering
[4]. The classification performance of this hybrid CAD obtained was 75.2.
Similarly, D. D., Westaway et.al (2013) were used Radio-mic approach to choose the 3-D features from the lung cancer images for giving prognostic information. As we know classifiers are created to forecast the survival time. In this experiment CT scan images has been used and these images were collected from Moffitt Cancer Center, Tampa [5]. The image traits from CT scans may signify phenotypes which are proficient of permitting more good forecasts which can be created by human analysis. By using the decision tree the prediction of survival and accuracy of this was observed 77.5%.In another experiment that was performed by Abidi Kureshi, N.et.al (2016) in which an automatic pathological diagnosis method has been proposed which is known as Neural ensemble based detection(NED). In this proposed method preprocessing, feature extraction, classification and diagnosis were used. In this experiment data has been taken from the X ray chest films by Bayi hospital. This proposed method used to use to recognize lungs cancer cell of needle biopsies, identification rate is
high and provides less number of false negative identification which improves the accuracy automatically that helps the people to save the life [6].
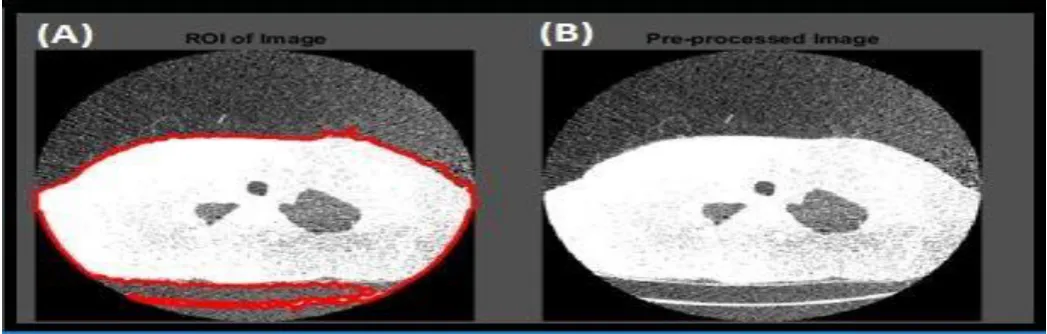
This paper mainly focusses on the early detection and accurate classification of the lung cancer. In this research article first Region of interest(ROI) has to be find out by using different feature extraction techniques via. SIFT, SURF and PCA. As shown in the fig.2 ROI has to be detected and marked after that preprocessing of the image has to be implemented in which scaling of the image has to done and key points has to extracted. The performance of these feature extraction technique has to be depends on the minimum execution time with minimum error rate. Now, this hybrid model gone through the second phase in which extracted feature has to be optimizes via. Genetic algorithm, Particle Swarm Optimization and Ant Bee Colony. It is clearly shown by the fig.2 in which Mean square error has been calculated. The third phase of this hybrid model training and classification has to be performed on 1000 images in which 25%images used for training and 75%images used for
classification. In this research article training and classification has been done by Feed forward back propagation neural followed by SVM. So, this hybrid models consists of three phase:
a) Selection of Feature extraction algorithm b) Selection of the Optimization algorithm c) Training and Classification
II. SELECTION OF FEATURE EXTRACTION ALGORITHM
Three different feature extraction algorithms have been implemented as discussed in Section 1 and Section 2.
[image:2.595.46.570.554.721.2]SIFT return key points of any image, which is relevant in the ROI (Region of Interest). The ROI is the section, which is the most relevant part of any image toward the required operation [7-8].
Fig.2 ROI analyses of the lung cancer images for classification (a) ROI region for feature extraction (b) Pre-processed image of lung cancer
Figure 3(a), 3(b) and 3(c) represents the ROI selection and finalized image after morphological process [9-10]. Any
directly for the feature extraction. In addition to that, specific region selection prevents the feature extraction algorithm from any kind of irrelevant time laps. The
[image:3.595.56.565.88.311.2]extracted region is passed to feature extraction algorithm turn by turn. The following table illustrates the architecture of extracted key points / Eigen values.
Table – I: Different feature set of different algorithms
Image
PCA->Principle Eigen Vector)
SIFT-> Key Points
SURF -> Key Points
Image 1( 255 * 393 )
256 *1 252*252 224*62
Image 2 (196*250)
256 *1 253*252 164*52
Image 3 (181*277)
256 *1 252*252 163*26
Image 4 (195*200)
256 *1 253*252 180*45
Fig.3. Feature extraction of the different feature extraction technique (a) PCA Eigen Components (b) SIFT Key (c) SURF Key Point
Figure 3. represents different feature set samples of different feature extraction algorithm. Although, as discussed in previous sections, each feature extraction has its own significance and architecture. Based on the parameters SURF is considered the best feature extraction algorithm as it consumed least time and produced least error rate [11-12]. Also in Figure (3), it is clearly visible that the most relevant points are extracted by SURF. Out of the extracted key points by SURF, only few are the most relevant key points for
Cancer Identification and optimization algorithms have judged.
III. SELECTION OF OPTIMIZATION
ALGORITHM
[image:3.595.59.562.483.724.2]The selection of the most suitable optimization technique has been done based on the execution time and mean square error. The entire process is summed up in one architecture whose algorithm design is given as follows
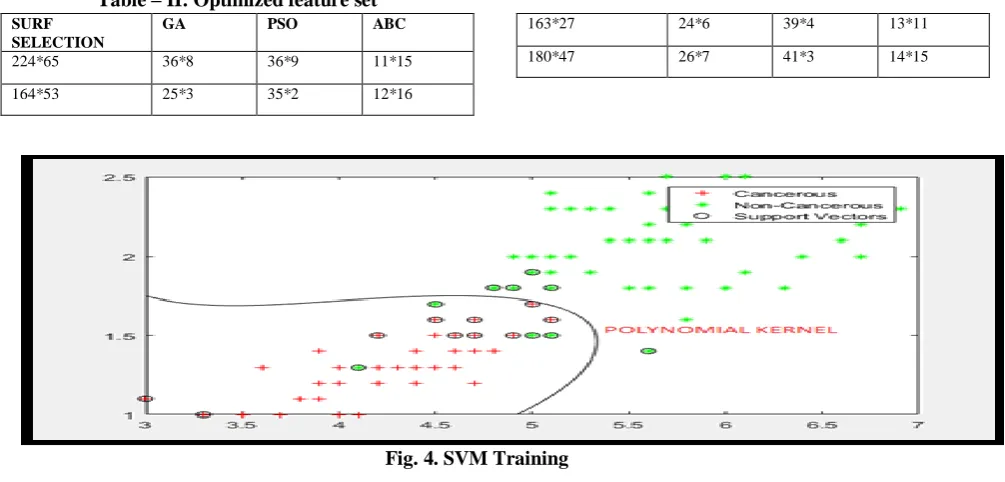
Table – II: Optimized feature set
SURF SELECTION
GA PSO ABC
224*65 36*8 36*9 11*15
164*53 25*3 35*2 12*16
163*27 24*6 39*4 13*11
180*47 26*7 41*3 14*15
Fig. 4. SVM Training Algorithm 2. Select_Suitable( Image_Set)
Function
Find_Best_Suitable_Feature_Selction_Algo(Image_Set) 1. Foreach img in Image_set // for every image in
Image_Set
2. ROI= Identify_ROI(img); // Evaluating the ROI 3. F1=Feature_Sift(ROI); // Evaluating SIFT Key
4. F2=Feature_Surf(ROI); // Evaluating Surf Key Points
5. F3=Feature_Pca(ROI); // Evaluating Principle Eigen Vector
6. End For
7. [Time of execution, Error] =Evaluate_Time_Error(F1,F2,F3);
8. Find minimum_time,Error Rate select feature extraction algorithm
[image:4.595.49.273.49.266.2]9. End function
Table – I: Utilized fitness functions
GA 1
0
ABC
0
PSO 1
where fs is current feature vector and ft is the threshold of selection.
Algorithm3.Select_Suitable_Optimization(Selected Feature_Set)
Function Select Best_Optimization(Feature_Set)
1. Foreach f in feature_set 2. O1=GA_Fit(f); 3. O2=ABC_Fit(f); 4. O3=PSO_Fit(f); 5. End for
6. Min_time=Min(O1T, O2T,O3T);
7. Select Optimization Algorithm with minimum time 8. End Function
IV. TRAINING AND CLASSIFICATION
In this section the training and classification of the data set is to be done by using the SVM and FFBPNN. As SVM is a binary classifier and hence it can categorize only two categories at a time. Some researchers have utilized SVM as multiclass classifier in medical industry but they would be too complex in the required frame [13-15]. But in this hybrid architecture to get the desired results whether the image is cancerous or non- cancerous with more accuracy SVM with FFBPNN are sufficient. enough. The extracted and optimized feature set is passed to SVM for the training first. SVM does not pick each.
feature for training. The selection of the feature set depends completely on the type of Kernel used in the training. The proposed architecture has used Polynomial Kernel due to various regions.
a) Polynomial Kernel covers a lot of area as compared to any of the kernel function of SVM.
b) Unlikely liner kernel is quite flexible and results into simulations that are more accurate. The trainset for SVM is formed in the following manner.
Algorithm Train_SVM(N1, Opt_set1, N2, Opt_set2) Where N1= Total number of cancerous images Opt1= Optimized Feature vector for N1
N1= Total number of cancerous images Opt1= Optimized Feature vector for N1 1. gcount=1; Train_set=[ ]; //group count 2. Foreach fvec in Opt1.Row
3. Train_set(gcount,:)= Opt1_set1.Row.Value 4. Group(gcount)=1;
5. Gcount=gcount+1; 6. End for
7. Foreach fvec1 in Opt_set2.Row 8. Train_set(gcount,)=Opt_set.Row.Value 9. Group(gcount)=2
10. End for
The train set is initialized as empty and group set is accordingly set. The train set will contain both the values of the cancerous and the non- cancerous feature set. This data is passed to SVM training with polynomial kernel and the following graphical representations are attained [16-17] As described in the section earlier, SVM only takes those feature vectors, which is supported by the support vectors. The support vectors are marked as rounded object in Figure 5. In the similar fashion, the classification procedure takes place [18-19]. The classification procedure takes the test image as input, extracts its feature vector, optimizes it and finally passes it to trained architecture as described in the flow diagram in Section
[image:4.595.65.549.575.760.2]As the SVM use only that data which are close to the kernel. However, the count of extracted feature will be high so here SVM reduce the complexity of data size [20-21]. Concurrently only the selected features passed to the Feed forward back propagation neural network. Moreover, FFBPNN reduce the size of raw data by using the property
[image:5.595.47.538.122.381.2]of FFBPNN. So in this hybrid model in the first module train the data set by using SVM and in the second module trains the FFBPNN with selected Kernel [22-23]. The fig.6 shows the how the neural network implemented on the reduced and filtered size of data set with different numbered of neuron count.
Fig. 6. Neural Network with Neuron Count In this section FFBPNN calculate the weight of extracted
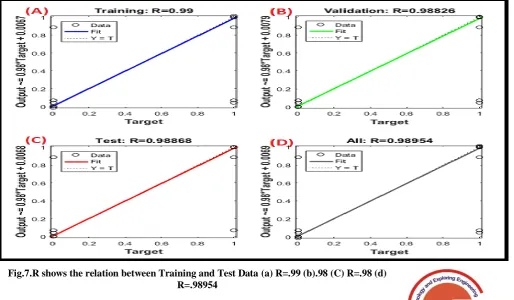
feature set. Here the mean square error is the parameter which act as a cross validator in propagating back to FFNN, whereas gradient act as a cross validator in propagating back to FFBPNN [25-27]. It is clearly shown by the fig.7.The
best propagating value is to be stored in the repository of this hybrid structure. However, value of regression R propagating the impact of one data to another data means there is very minute mismatch between trained and testing data [28-30].
[image:5.595.49.564.493.793.2]V. RESULT AND DISCUSSION:
In the proposed work, initially three feature extraction algorithm (SURF, SIFT, PCA) and three feature optimization algorithms (GA, ABC and PSO) have been implemented. A comparative analysis of feature extraction algorithms and feature optimization algorithm on the basis of time and error rate has been
calculated as shown in the table 5. In this section, the results obtained after simulating the code in MATLAB that has been discussed in detail The simulation is carried out in MATLAB software. The simulation environment in which the work has been done is shown in below table.
Table – IV: Simulation Environment
Language Utilized MATLAB
Version 2016 (a)
Tool Boxes Image Processing Toolbox , Data Acquisition Tool box
RAM Minimum 4 GB
Processor I3 and above
Image Set Source Research Lab , Chandigarh
This section compares the feature extraction techniques and evaluated the parameters in the form of parameter time and
[image:6.595.62.560.275.566.2]error rate after the successful implementation of Feature extraction algorithms.
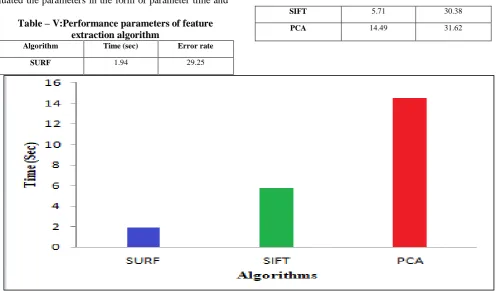
Table – V:Performance parameters of feature extraction algorithm
Algorithm Time (sec) Error rate
SURF 1.94 29.25
SIFT 5.71 30.38
PCA 14.49 31.62
Fig.8. Time verses feature extraction algorithm Figure8 represents the graphical architecture of the
values presented in Table 6. Surf feature extraction technique has the least consumption time in order to extract the features whereas the PCA is on the higher side. SIFT manages to lie in between SURF and PCA.
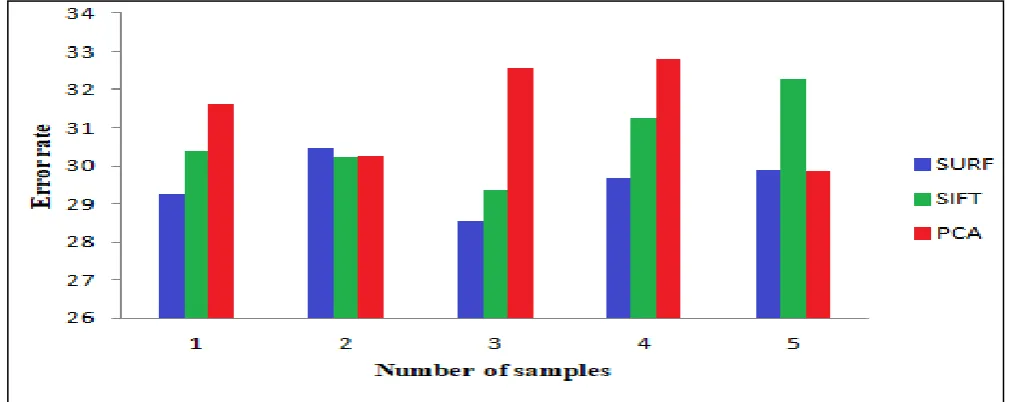
Another evaluation has been made on the basis of the error rate generated in the feature extraction procedure. Table 6 represents the Error rate corresponding to the time consumed
Table – VI: Performance parameters of feature extraction algorithm for five samples
Number of Iterations
Time Error rate
SURF SIFT PCA SURF SIFT PCA
1 1.94 5.71 14.4 29.25 30.38 31.62
2 2.04 4.57 13.25 30.47 30.24 30.25
3 1.65 4.97 16.54 28.54 29.36 32.56
4 2.52 6.57 17.85 29.65 31.25 32.79
Fig.9. Error rate verses feature extraction algorithm for five samples Figure 9 represents the graphical structure of the values
drawn in table 6. Even for this parameters, the SURF seams to perform well as compared to SIFT and PCA. The maximum error generated by SURF is 30.47 units whereas SIFT generates a maximum error of 32.25 units. The PCA on the other hand stands tallest prone to error and generates a maximum value of 32.79. Similarly, the mean square error has been calculating for three optimization algorithm GA=24.59, PSO=84.20 and ABC=28.10. So the GA has the least mean square error. Finally, the performance of this proposed hybrid architecture can be evaluated in the terms of parameter Recall(R), Precision(P), F-measure(F) and Accuracy.
A.
B.
C. It is the accuracy of supplied samples
The presented work focuses on the enhancement of true positive rate and accuracy. A GUI has been prepared in the Matlab that is shown by the figure10
Fig.10. GOI of Hybrid model represent the pictorial view (a) ROI of the image (b) Pre-processed image (c) Valid and key points of PCA
The value of precision for this hybrid model .84028, value of recall .93629 value of f-measure .88569 and accuracy 99.6507 has to be obtained. So this hybrid model achieves high value of accuracy with minimum execution time and
minimum error rate which means provides best classification of lung cancer at an early stage.
This work determines the possibility of detection the lung cancer at an early stage by employing the feature extraction technique, feature optimization technique and classification by using classifier and neural network on this hybrid structure. The Proposed hybrid model which provides the comparative analyses of feature vector and feature optimization algorithms. The best selected feature passed through the different optimization algorithm. So the best feature extraction technique Surf and best optimization algorithms GA analysed on the basis of parameter like minimum tic-toc time and mean square error. More over both these techniques have been implemented on this hybrid model. The optimized feature vector is trained & classified by SVM and FFBPNN. Some significant finding of this hybrid structure are as:
The work evaluated the best feature extraction technique Surf with minimum tic-toc time 1.94 sec and minimum mean square error 29.25 among the techniques SIFT and PCA and it is clearly shown by the figure no.8.
The proposed hybrid structure determines the best optimization algorithms GA which has minimum error rate 24.59 among the technique PSO and ABC.
The main objective of this paper to enhance the true positive rates which automatically increase the accuracy of the system. By applying the best feature extraction, optimization, SVM classifier and neural network FFBPNN the hybrid structure achieved the better accuracy of 99.6507%. The classification accuracy proves that the features were optimized correctly. It means lot of life can be saved if the detection and diagnosis of the lung cancer should be done at proper stage.
The current research work has opened many gates for the future research fellows. Different types of Lung Cancers or different stages of Lung cancers can be analysed through same architecture. It will also be interesting to see that how Deep Neural Network acts in this scenario.
REFERENCES
1. Yin, Y., Sedlaczek, O., Muller, B., Warth, A., Gonzalez-Vallinas, M., Grabe, N., & Drasdo, D. (2017). Tumor cell load and heterogeneity estimation from diffusionweighted MRI calibrated with histological data: an example from lung cancer. IEEE Transactions on Medical Imaging.
2. Nanglia.P.,Kumar.S.,Rathi.Devinder,Singh.,Paramjit.:Comparative Investigation of Different Feature Extraction Techniques for Lung Cancer Detection System, In: International Conference on Advanced Informatics for Computing Research.pp.296-307.(2018)
3. Zhang, L., Zhou, W., Velculescu, V. E., Kern, S. E., Hruban, R. H., Hamilton, S. R., ... & Kinzler, K. W. (1997). Gene expression profiles in normal and cancer cells. Science, 276(5316), 1268-1272.
4. Hawkins, S. H., Korecki, J. N., Balagurunathan, Y., Gu, Y., Kumar, V., Basu, S., ... & Gillies, R. J. (2014). Predicting outcomes of nonsmall cell lung cancer using CT image features. IEEE Access, 2, 1418-1426. 5. Westaway, D. D., Toon, C. W., Farzin, M., Sioson, L., Watson, N.,
Brady, P. W., ... & Gill, A. J. (2013). The International Association for the Study of Lung Cancer/American Thoracic Society/European Respiratory Society grading system has limited prognostic significance in advanced resected pulmonary adenocarcinoma. PathologyJournal of the RCPA, 45(6), 553-558.
6. Kureshi, N., Abidi, S. S. R., & Blouin, C. (2016). A predictive model for personalized therapeutic interventions in non-small cell lung cancer. IEEE journal of biomedical and health informatics, 20(1), 424-431.
7. Fischer, S. (2017). Sniffing for Cancer: Nano Noses Hold Promise for Detecting Lung Cancer and Other Diseases. IEEE pulse, 8(4), 20-22. 8. Gaikwad, A., Inamdar, A., & Behera, V. (2016). Lung cancer detection
using digital Image processing On CT scan Images”. International Research Journal of Engineering and Technology (IRJET) eISSN, 2395-0056.
9. Lambin, P., Rios-Velazquez, E., Leijenaar, R., Carvalho, S., van Stiphout, R. G., Granton, P., ... & Aerts, H. J. (2012). Radiomics: extracting more information from medical images using advanced feature analysis. European journal of cancer, 48(4), 441-446.
10. Peng, G., Tisch, U., Adams, O., Hakim, M., Shehada, N., Broza, Y. Y., ... & Haick, H. (2009). Diagnosing lung cancer in exhaled breath using gold nanoparticles. Nature nanotechnology, 4(10), 669-673.
11. Juan, L., & Gwun, O. (2009). A comparison of sift, pca-sift and surf. International Journal of Image Processing (IJIP), 3(4), 143-152. 12. Burger, W., Burge, M. J., Burge, M. J., & Burge, M. J. (2009).
Principles of digital image processing (p. 221). London: Springer. 13. Pang, Y., Li, W., Yuan, Y., & Pan, J. (2012). Fully affine invariant
SURF for image matching. Neurocomputing, 85, 610.
14. Huijuan, Z., & Qiong, H. (2011, September). Fast image matching based-on improved SURF algorithm. In Electronics, Communications and Control (ICECC), 2011 International Conference on (pp. 1460-1463). IEEE.
15. Houck, C. R., Joines, J., & Kay, M. G. (1995). A genetic algorithm for function optimization: a Matlab implementation. Ncsu-ie tr, 95(09). 16. Karaboga, D., & Basturk, B. (2007). A powerful and efficient
algorithm for numerical function optimization: artificial bee colony (ABC) algorithm. Journal of global optimization, 39(3), 459-471. 17. Fourie, P. C., & Groenwold, A. A. (2002). The particle swarm
optimization algorithm in size and shape optimization. Structural and Multidisciplinary Optimization, 23(4), 259-267.
18. Narayanan, B. N., Hardie, R. C., Kebede, T. M., & Sprague, M. J. (2017). Optimized feature selection-based clustering approach for computer-aided detection of lung nodules in different modalities. Pattern Analysis and Applications, 1-13.
19. Hawkins, S. H., Korecki, J. N., Balagurunathan, Y., Gu, Y., Kumar, V., Basu, S., ... & Gillies, R. J. (2014). Predicting outcomes of nonsmall cell lung cancer using CT image features. IEEE Access, 2, 1418-1426. 20. Belsare. A.D., Mushrif. M.M., Pangarkar. M.A., Meshram. N.:
Classification of breast cancer histopathology images using texture feature analysis. In: TENCON-2015. pp. 1-5. (2010)
21. Gupta. S., Kumar. S.: Variational level set formulation and filtering techniques on CT images. International Journal of Engineering Science and Technology. vol. 4, pp. 3509–3513. (2012)
22. Shallu, Nanglia. P., Kumar. S., Shukla. P.: Detection and analysis of lung cancer using radiomic approach. In: International Conference on Computational Strategies for Next Generation Technologies. in the press. (2017)
23. Song. Y., Cai. W., Zhou. Y., Feng. D.D.: Feature-based image patch approximation for lung tissue classification. IEEE Trans. Med. Imag. vol. 30, pp. 797-808. (2013)
24. Vo. K.T., Sowmya. A.: Multiple kernel learning for classification of diffuse lung disease using HRCT lung images. In: Proc. IEEE Eng. Med. Biol. Soc. Conf. pp. 3085-3088. (2010)
25. Shallu, Kumar. S., Aggarwal. E.: A study on adaptive wavelet technique for speckle noise removal. In: International conference on Communication and Computing Systems. pp. 131-136. (2016) 26. Su. H., Liu. F., Xie. Y., Xing. F., Meyyappan. S., Yang. L.: Region
segmentation in histopathological breast cancer images using deep convolutional neural network. In: International Symposium on Biomedical Imaging. pp. 55-58. (2015)
27. Shallu, Mehra. R., Kumar. S.: An insight into the convolutional neural network for the analysis of medical images. In: IEEE International Conference on ‘Nanofim 2017’. in the press. (2017)
28. Cireşan, D. C., Giusti, A., Gambardella, L. M., & Schmidhuber, J. (2013, September). Mitosis detection in breast cancer histology images with deep neural networks. In International Conference on Medical Image Computing and Computer-assisted Intervention (pp. 411-418). Springer, Berlin, Heidelberg.
29. Cruz-Roa, A. A., Ovalle, J. E. A., Madabhushi, A., & Osorio, F. A. G. (2013, September). A deep learning architecture for image representation, visual interpretability and automated basal-cell carcinoma cancer detection. In International Conference on Medical Image Computing and Computer-Assisted Intervention (pp. 403-410). Springer, Berlin, Heidelberg.
30. Camarlinghi, N., Gori, I., Retico, A., Bellotti, R., Bosco, P., Cerello, P., ... & Fantacci, M. E. (2012). Combination of computer-aided detection algorithms for automatic lung
nodule identification.
assisted radiology and surgery, 7(3), 455-464.
AUTHORSPROFILE
Pankaj Nanglia received the B. Tech. degree in Electronics and Communication Engineering from Kurukshetra University, Kurukshetra, India, in 2007 and the M. Tech degree in Electronics and Communication Engineering from Deenbandhu Chhotu Ram University of Science and Technology Sonipat, India, in 2013.He is currently pursuing Ph.D. from the Department of Electronics Engineering from Maharaja Agrasen University, Solan, Himachal Pradesh, and also working as an Assistant Professor in Department of Electronics and Communication Engineering at Maharaja Agrasen Institute of Technology, Maharaja Agrasen University, Baddi, Solan, Himachal Pradesh, India. His research area includes Image Processing, Digital Signal Processing, and communication engineering.
Dr Aprana N Mahajan received her Doctor of Philosophy from Banasthali Vidyapith University, Rajasthan, India in Electronic & Communication Engineering (ECE). During her Bachelor, she worked on Image Processing problem using digital filters and wireless communication. She is presently working as a Professor and Director of MAIT in Maharaja Agrasen University. Her research area includes wireless communication, Optical Communication, Electronics System Design, Microprocessor & Microcontroller Architecture, Analog & Digital Electronics and Digital Signal Processing.
Paramjit singh received the B. Tech. degree in Electrical Engineering from Himachal Pradesh University Shimla, India, in 2013 and the M. Tech degree in Electrical Engineering from Kurukshetra University, Kurukshetra in 2015. He is currently pursuing Ph.D. from the Department of Electrical and Electronics Engineering from Maharaja Agrasen University, Solan, Himachal Pradesh, and also working as an Assistant Professor in Department of Electrical and Electronics Engineering at Maharaja Agrasen Institute of Technology, Maharaja Agrasen University, Baddi, Solan, Himachal Pradesh, India. His research area includes Image Processing, Digital
Signal Processing, and communication engineering.
Davinder S. Rathee received his Doctor of Philosophy from Guru Jambeshwar University of Science & Technology, Hisar, India in Electronic & Communication Engineering (ECE), 2015. He is NET qualified. He did his Master’s of Engineering in ECE in 2008 from Maharishi Dayanand University, Rohtak, India. He also did his Masters of Electronics Science (specialization in VLSI Design) from Kurukhsetra University, Kurukhsetra, India in 1998. During his Bachelor, he worked on Image Processing problem using digital filters from Maharishi Dayanand University, Rohtak in 1996. His research area includes MOS IC designing, Optical Communication, Electronics System Design, Microprocessor & Microcontroller