435
Published By:
Blue Eyes Intelligence Engineering & Sciences Publication
Retrieval Number: F10880486S319/19©BEIESP
Abstract— Now a day’s most of the people are suffering from different kinds of cancer diseases, so the study of classification places a vital role in predicting the somatic mutations. As the size of gene variants and somatic mutations in the tumor increases, it is essential to predict the disease patterns using the machine learning models. Most of the traditional classification learning models are used to classify the somatic cancer based on related features. Also, the traditional classification algorithms predict only the existence of somatic cancer but not with high accuracy. In this proposed work, a novel framework which is the comparative study of accuracy computation is designed and implemented on the datasets to classify somatic mutations.
Keywords: Somatic Mutations, Machine Learning, Classification.
I. INTRODUCTION
Machine learning is the process of identifying and analyzing the unknown hidden patterns on large uncertain databases and also a decision making system on different medical datasets. As the size of the medical databases increases, traditional machine learning models such as decision tree, SVM, neural networks, naive bayes, fuzzy ensemble learning etc., become difficult to process the patterns due to noise, high dimensionality and non-relational instances in the medical databases. Also, the major challenge of the existing models includes disease pattern discovery and the quality services. Feature selection and classification are the essential requirements for most of the medical disease pattern discovery models.
Some of the approaches of supervised classification models are random forest, Support Vector Machine (SVM) [1], C4.5 and so on. Some of the traditional methods basically implement the baseline somatic cancer features for prediction of significant baseline scores. Other kinds of approaches require both baseline somatic cancer features and scores for prediction of accurate future scores.
II. RELATED WORKS
Bagging is a method which is used to decrease the variance in the data set and also increases the quality and effectiveness of prediction. The predictable error will be decreased by the group of various predictors since the bias-variance disintegration’s [1] modification component will be decreased by those predictors. Bagging improves the classifier’s stability and the modification of the classifier will be decreased. The classifier is capable of predicting the outputs. Each prediction done is considered as a single vote
Revised Manuscript Received on April 12, 2019.
Anuradha Chokka, Research Scholar,Dept. of Computer Science, Sri PadmavathiMahilaVisvavidyalayam, Tirupati, India. (Email: [email protected])
Dr.K Sandhya Rani, Professor Dept.of Computer Science, Sri PadmavathiMahilaVisvavidyalayam,Tirupati,A.P,India. (Email: [email protected])
(data point). If a given class gains the majority of the votes (data points), then it is considered as the output of the classification. The bagging aggregates the classes based on the number of votes [2]. There are some other classifiers that have been derived by improving this bagging method. The bagging method is best performed using trees [3], because the structure of trees is easy to interpret. Bagging is handled efficiently when the data is unstructured without having a uniform format, because of the efficiency of this procedure the tree makes bagging easier to interpret. Bagging has very small progress with the weak learners when compared to the other classifiers which are well trained from the given data.
Fast correlation-based filter method was used by Chung for data classification [4]. The feature subsets are generated based on how these features correlate. The base classifier is the support vector machine which enables the algorithm to learn from the feature subsets presented to it. Voting is then done to determine the results. Sets of features are first created by subdividing the redundant features. This is in a bid to achieve diversity. This gives the classifier an opportunity to train from several subsets instead of one selected subset [5]. This method is more accurate than bagging. It has the capability of comfortably dealing with various types of features. Most predictive algorithms don’t use the FCBF because it may lead to instability in algorithm development.
A feature subset selection method performs using selection metric from the large features set, a subset of features can be extracted [6]. In the medical somatic cancer processing, few of the features are highly relevant with Texture but the remaining have minimum intensity. Ensemble classification for the identification of diseases in the dataset is specified as the preparation of multiple base classifiers. The imbalanced property is a primary issue accounting for the poor performance of the traditional ensemble classification models, especially on the minority class attribute. Class inequality and data ambiguity are the main research directions in the somatic cancer predictions which try to find better classification accuracy.
Another classification method is called boosting. The boosting technique was introduced in 1994 by Schapire [7], The actual idea in boosting is that the understanding of the weak and strong classifiers are equivalent, which means that strong learning classification will be achieved by merging the weak learners. The training tuples are trained with weights in the boosting method. The tuples are then learned in a repetitive manner using the boosting classifier. During each cycle of repetition, the weights of the tuples are recorded. The tuples that have been correctly classified are
Ada Boost Ensemble Classifier for
436
Published By:
Blue Eyes Intelligence Engineering & Sciences Publication
Retrieval Number: F10880486S319/19©BEIESP
given lower weights but those that have been given wrong classifications are given higher. This is because as more weight is given to the tuple, more focus is put on it. The performance of this boosting method is evaluated by how correctly the weights are assigned to the tuples. This boosting method can be improved as it relies on assumptions so that at the end it transforms the large margins of error to the smaller margins.
III. PROPOSED MODEL
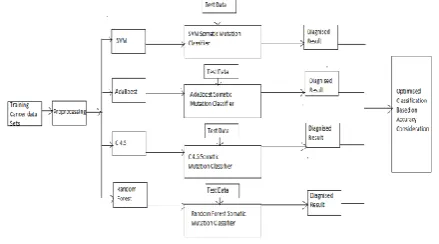
In the proposed framework, from the COSMIC repository five types of cancer data sets which consist of normal as well as somatic cancer data are taken as input. These training datasets are preprocessed using the predefined filters. In the next step, several classification algorithms are implemented on somatic data sets to verify the accuracy rate. The proposed model worked on various classifiers namely SVM, C4.5, Random Forest, AdaBoost, by considering cancer data sets. Brief descriptions of classifiers which are considered in the proposed model are given below.
3.1. Support Vector Machine
SVM is one of the machine learning’s classification method is SVM scheme. It is based upon the characteristics of statistical learning mechanism. The classification of SVM classifier supports structural risk minimization to carry out the whole process of classification smoothly and effectively [8]. Initially, different statistical evaluation processes are carried out in order to verify whether mutations are similar across healthy and diseased persons. Additionally, it has many other applications such as, disease assessment, detection of exudates in digital data, cancer disease prediction, glioma recognition, and so on. The drawback in SVM is quite efficient in case of small training data and can’t handle large data set effectively. SVM classifier is slow in test phase. The algorithm for Support Vector Machine shown as follows.
Support Vector Machine Algorithm
For a given dataset:
1.(m1, n1), ...., (mk, nk), ma € Rd andna € (-1, +1)
Here ma represents feature vector illustration, where na is the
class label (either –ve or +ve) of a training multiple a. 2. The ideal hyper plane can be determined as:
vqm a+d=0
Where V is weight vector, m represents the input feature vector, d is the bias.
3.The weight, v and the bias, d will fulfill the following differences for all components of training data:
vqm
a+d ≥ 0 if na= +1
vqm
a+d ≤ 0 if na = –1
4. The aim of Support Vector Machine technique is to calculate the weight v and also bias d thus the hyperplane splits the data and maximizes the boundary 1 / || v ||2.
5. Input vectors ma for |na| (vqma + d)= 1 will be taken as
support vector .
3.2. Random Forest classification
Random Forest constructs multiple numbers of decision trees and combines all the decision trees to bring maximum accuracy and more constant prediction. Random Forest
technique implements by considering the arbitrary feature subset selection for splitting of a node [9]. Instead of finding for the optimum probable saturation points as in common decision trees, for each and every feature, it uses arbitrary thresholds to make the decision trees utmost random.
This mechanism do well, as the summation of more decision trees decreases the noise influence which tends to give more accurate outcome, where as a single decision tree can prone to noise effect. The disadvantage is that created subsets of different decision trees may tend to overlap and also it is tough to interpret. The main disadvantage is taking a maximum number of trees creates ineptness in the technique and making to work slow and not suitable for real time forecasts. The Algorithm for Random Forest Technique is shown as follows.
Random Forest Algorithm
Input: imbalanced Dataset, Taken as S
Output: Classifier C(m), m is estimated sample
1. Split the Dataset S into subsets taken as q (+ve) and r (-ve) samples respectively.
If the Datasets has greater than two different classes, then the class with smallest samples was
considered as underground class or negative sample, and all the remaining classes are
considered as majority class or positive sample. 2. The ratio can be taken as F←[|𝑟|
|𝑞|]
3. Bring out the ratio sample subsets by using arbitrarily sampling with substitution
From majority class sample Dataset S, the sample capacity of each subset is equivalent to the
dimension of minority class sample Dataset S, Everysubset is taken a srk.
4. For k form 1 to F
5. Building the training Dataset Nk← q + rk
6. PrepareRandom Forest Classifier say RFk and b=RFk(m)
signify the prediction outcome for the sample m
7. End for
8. The Classifier C(m) = sign ∑𝐹𝑘=1𝑏
3.3 C4.5 classification
437
Published By:
Blue Eyes Intelligence Engineering & Sciences Publication
Retrieval Number: F10880486S319/19©BEIESP
cause to different decision trees. In C4.5 algorithm, the classification error rate can be minimized by replacing the sub-tree by a leaf node. The error rate can be measured by separating the training dataset according to the calculation, based on unused instances for training data. Another way for error rate estimation is performing pruning. The algorithm of C4.5 can be shown as follows.
3.4 C4.5 Algorithm
1. Test the base case information.
2. Calculate the feature(attribute) with more information gain
3. The more information gain for the attribute can find out by following formulas
Shown below
Entropy T(Q) = ∑nK=1− P(mk) ∗ l log2P(mk) Gain Gn (Q, L) = P(Q) − ∑mk=1P(Lk)T(QLk)
Where T(Q) is the data Entropy of Q, Gn (Q,L) is the gain of ‘Q’ after an attribute ‘L’
is splitted and ‘n’ specifies the number of classes presented in ‘Q’, ‘P(mk)’ represents the class
mk frequency in Q.‘M’ is the number of data values of
attribute ‘L’ which is presented in ‘Q’,‘P(Lk)’ is the ‘Li’
value presented frequency of cases in ‘Q’ and ‘T(QLk)’ is
the subset of Q contains data items that have ‘Lk’ value.
4. Divide the tree into sub-trees Q1, Q2, Q3etc. By considering the values of maximum information gain and iterate the process for Q1, Q2, and Q3 etc.
3.4 AdaBoost Classification
AdaBoost (Adaptive Boost) algorithm is one type of boosting technique. It was introduced by Freund and Schapiro. In the AdaBoost technique the weighted forms of equal training data will be utilized in spite of random sample data usage. The single trained data is used number of times and the groups of classifiers with improved enactment will be produced by using AdaBoost algorithm. To generate the last outstanding classifier [11], Adaboost algorithm prepares a group of classifiers by using the weak classifier (wrongly classified learner)[12].For the training data weights will be given and classification is to be performed, based on the weighted version of that data set of weak classifiers generated consecutively then the weights will be reweighted based on the quality of the performed classifiers. For every iteration, training data never changes and classification performs according to the misclassification of the preceding classifiers. The weak learners concentrate on the patterns which were not classified effectively. It continues this process until we get a strong base learner to reach maximum accuracy. AdaBoost [13] focuses on reduction of errors during learning. The weights of the wrongly classified tuples will remain constant and is not varied. AdaBoost has the advantage of not considering a single characteristic, but considers a set of labels with high probabilities. It puts its focus on the labels that were wrongly classified [14] In order to attain the accurate and desired output and the minimized pseudo loss is needed. Boosting methods (Ada Boost) can effectively be used with large datasets. Use of these complex algorithms will reduce the errors of the classifier. The AdaBoost algorithm implemented on somatic mutational data sets is shown below.
Adaboost Algorithm
Input: Somatic cancer datasets Output: Class label prediction Procedure:
1. Let n-dimensional instances are represented as D. 2. Initialize the weight to each instance I in D. 3. Calculate the weight Wi
i
1
W
;i
1, 2...m
m
=
=
1.
For each iteration i=1…N:Create data distribution D[i] on {1…n} instances. Select weak classifier with less error rate E[i] on D[i].
D t i i
t
E[i]
Pr ob [h (x )
y ]
h : x { 1, 1}ie.true or false
=
− +
End ForOutput: Predicted class value
[image:3.595.316.536.384.506.2]The main aim of the proposed model is to perform a comparative analysis of performances of above discussed various classifiers on five types of cancer data sets. A framework is proposed in this paper for somatic mutation classification by using different classification algorithms such as SVM, C4.5, AdaBoost and Random Forest. On five different types of cancer data sets namely BRCA, COAD, ESCA, PAAD and KIRC. The following diagram Figure1 specifies the proposed framework.
Figure 1: A Frame Work for Classifying Cancer Data Sets with Accuracy Measurement.
IV. IMPLEMENTATION OF THE PROPOSED
FRAMEWORK & RESULTS
The proposed model is implemented using the java environment and Somatic training datasets are taken from the https://github.com/ikalatskaya/ISOWN [15].They have prepared different types of somatic mutational datasets from the COSMIC repository. In the proposed model, these training datasets are used in order to classify the somatic mutational patterns. The somatic mutational data set taken as input and consists of different cancer types namely Breast Cancer (BRCA), Colon Cancer (COAD), Esophageal Cancer (ESCA), Kidney Cancer (KIRC), Pancreatic Cancer (PAAD).
438
Published By:
Blue Eyes Intelligence Engineering & Sciences Publication
Retrieval Number: F10880486S319/19©BEIESP Attribute Description
Exac
The Exome Aggregation Consortium (ExAC) is a collection ofGermline as well as Somatic variants from different individuals. It is a database which consists of germlinevariants collected from individual variants. Each variant in validation sets is given a Boolean value based on the existence in ExAC. This can be used as an independent feature.
dbSNP The single nucleotide polymorphism DataBase (dbSNP) resource classifies given variants into normalpolymorphisms and abnormal polymorphisms.
CNT
CNT is an attribute given to each coding mutation classified by COSMIC and signifies the data values with a mutation against all tumor categories. If the given mutation was not catalogued by COSMIC then a zero will be given to CNT. So CNT values vary from 0 to 19,966.
Fre fre (frequency) samples are computed as the fraction of the total number of samples to the samples which carry a specific mutations in the data set.
VAF VAF (Variant allele frequency) can be computed as the ratio of quantity of reads associating to the variant allele (VA) over the sum of the entire quantity of reads.
mutAss It forecasts the functional influence of amino acid replacements actually based on conservation of the affected amino acids. Categorical outputs from mutAssare : high,low,medium,stopgain,stoploss. Pattern
Pattern Replacement is specified as adouble base gene sequence which constitutes mutations along withpresented mutational base. Every mutations categorical patterns are grouped into six varieties namely,“TG”,“CG”,“TA,“TC”,“CA”, and “CT”.
isFlanking
isFlanking is a region which measures the features and checks whether the VAF of an unknown mutation is matched with the VAF of flanking known mutations. This attribute mainly depends on the presence of known mutational polymorphisms.
polyphen The value assigned to this attribute is the outcome of a tool. The probable values that can be assigned to polyphen attribute are benign, probably and possibly.
isSomatic isSomatic specifies whether the patient is having somatic mutations or not. Sample cancer dataset related to Breast Cancer dataset is shown in Table 2.
Table 2: Breast Cancer Dataset @attribute ExAc {true, false}
@attribute dbSNP {true, false} @attribute CNT numeric @attribute fre numeric @attribute VAF numeric
@attribute mutAss {'neutral','low','medium','high','stopgain','stoploss'} @attribute pattern {'CG', 'CA', 'CT', 'TA', 'TC', 'TG'}
@attributeSeqContext
{'ATT','CTT','GTT','TAT','AAA','CAA','AAC','CAC','GAA','AAG','CAG','GAC', 'GAG','TGA','TGC','TCA','AAT','TCC','TGG','CAT','TCG','GAT','TGT','TTA','TTC', 'TCT','TTG','TTT','AGA','CGA','AGC','CGC','ACA','CCA','GGA','ACC','AGG','CCC', 'CGG','GGC','GCA','ACG','CCG','GCC','GGG','GCG','AGT,'ATA','ATC','CGT','CTA','ACT', 'CTC','ATG','CCT','GGT','GTA', 'TAA','CTG','GTC','TAC','GCT','GTG','TAG',}
@attribute isFlanking numeric
@attribute polyphen {'benign', 'probably', 'possibly'} @attribute isSomatic {true, false}
false,false,0,0.01,44.44,low,TC,CAG,0,possibly,true, false,false,1,0.01,29.82,stopgain,CA,GGG,?,?,true, false,false,1,0.01,24.36,medium,CA,GGA,?,probably,true, true,true,0,0.17,32.111,low,TG,AAC,0,?,false,
439
Published By:
Blue Eyes Intelligence Engineering & Sciences Publication
Retrieval Number: F10880486S319/19©BEIESP
[image:5.595.304.547.50.171.2]We have given somatic mutational data which contains different cancer types such as Breast Cancer (BRCA), Colon Cancer (COAD), Esophageal Cancer (ESCA), Kidney Cancer (KIRC), Pancreatic Cancer (PAAD). The instances distribution of five cancer dataset is shown in Figure 2.
[image:5.595.49.288.121.245.2]Figure 2: Instance Distribution of Each Cancer Dataset Each cancer type instances are used for training and testing purpose. The breast cancer training data are given as input to develop different types of classifiers namely SVM, C4.5, AdaBoost,random Forest. After completion of training the test data is used to analyze the performance of each classifier. This process is repeated for remaining four data sets also. The performance of each classifier on each cancer data set is shown in Table 3.
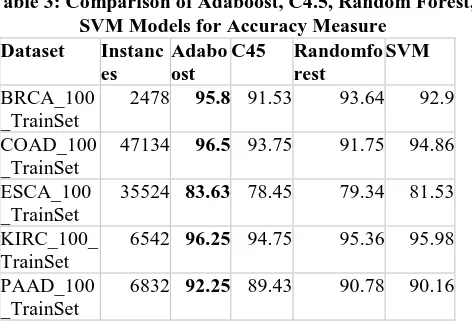
Table 3: Comparison of Adaboost, C4.5, Random Forest, SVM Models for Accuracy Measure
Dataset Instanc es
Adabo ost
C45 Randomfo rest
SVM BRCA_100
_TrainSet
2478 95.8 91.53 93.64 92.9 COAD_100
_TrainSet
47134 96.5 93.75 91.75 94.86 ESCA_100
_TrainSet
35524 83.63 78.45 79.34 81.53 KIRC_100_
TrainSet
6542 96.25 94.75 95.36 95.98 PAAD_100
_TrainSet
6832 92.25 89.43 90.78 90.16
Table 3 Describes the number of instances considered for Breast cancer data set is 2478. For this data set the least accuracy that is 91.53 is obtained for C4.5 classifier where as the adaBoost classifier given highest accuracy that is 91.8. Finally when the performance of the classifiers are compared on five cancer data sets, the accuracy results in table 1 proved that adaBoost classifier outperformed on all data sets compared to C4.5,SVM and Random forest.
The classification accuracy for adaBoost and C4.5, Random Forest and SVM for each of the cancer type BRCA, COAD, ESCA, KIRC and PAAD data sets are shown in graphical representation in Figure 3.
Accuracy of different classifiers for each cancer data set.
Figure 3: Accuracy of Different Classifiers for Each Cancer Data Set.
This representation clearly reveals that AdaBoost classifier is efficient compared to other classifiers for all the five cancer data sets. As an instance, for BRCA dataset, the accuracy achieved for AdaBoost classifier is 95.8434% and the error rate (which it could not able to classify the data accurately) is 4.1566% .
V. CONCLUSION
As the size of the data and dimensions increases, it is difficult to process the classification on the data to classify somatic genes with high classification accuracy. Also, traditional classification algorithms only predict the existence of somatic cancer independent of gene sequence. In this proposed work, a novel framework, adaBoost classification algorithm is implemented on the somatic cancer datasets to produce accurate performance of significance of cancer and compared with remaining classification techniques SVM, Random Forest, C4.5. In this work, the comparative study of four classification algorithms performed on somatic mutational data for verifying the more accuracy in classification. Among all the techniques SVM, Random Forest, C4.5 and adaBoost algorithms, AdaBoost ensemble classification algorithm classified the somatic mutations with high accuracy95.84%. Experimental results proved that AdaBoost classification algorithm is better than the existing approaches for high classification rate.
REFERENCES
1. T. Hastie, R. Tibshirani, and J. Friedman, The Elements of Statistical Learning, Springer, 2nd edition, 2001.
2. Peter Buhlmann,” Bagging, Boosting and Ensemble Methods”, Handbook of Computational Statistics, Springer Link, Page No 985-1022, January 2012.
3. Kristína Machová, František Barčák, Peter Bednár,”A Bagging Method using Decision Trees in the Role of Base Classifiers”, Acta Polytechnica Hungarica ,Vol. 3, No. 2, 2006.
4. Baris Senliol, Gokhan Gulgezen , Lei Yu and Zehra Cataltepe, ” Fast Correlation Based Filter (FCBF) with a Different Search Strategy”, IEEE Paper , 978-1-4244-2881-6/08, November 2008.
[image:5.595.52.288.396.560.2]440
Published By:
Blue Eyes Intelligence Engineering & Sciences Publication
Retrieval Number: F10880486S319/19©BEIESP
6. Guangtao Wang, Qinbao Song, Baowen Xu,” A Feature Subset Selection Algorithm Automatic Recommendation Method”, Journal of Artificial Intelligence Research 47 (2013) 1-34.
7. Artur Ferreira and M´ario Figueiredo, Boosting Algorithms: A Review of Methods Theory and Applications, chapte-3.pages 3-6, Springer,2012.
8. Y.Ireaneus Anna Rejani, Dr.S.Thamarai Selvi,” Early Detection Of Breast Cancer Using SVM Classifier Technique”, International Journal on Computer Science and Engineering, Vol.1(3), 2009, 127-130.
9. Cuong Nguyen, Yong Wang, Ha Nam Nguyen,” Random forest classifier combined with feature selection for breast cancer diagnosis and prognostic”, Journal of Biomedical Science and Engineering, 2013, 6, 551-560.
10. M A Muslim1, S H Rukmana , E Sugiharti , B Prasetiyo and S Alimah,” Optimization of C4.5 algorithm-based particle swarm optimization for breast cancer diagnosis”, International Conference on Mathematics, Science and Eduction (ICMSE2017),983,2017.
11. R.Senkamalavalli and Dr.T.Bhuvaneswari ,“Improved Classification of Breast
12. Cancer Data Using Hybrid Techniques”, International Journal of Advanced Engineering Research and Science, May 2018. 13. JareeThongkam, GuandongXu, Yanchan Zhang,
fuchunHaung,“Breast Cancer Survivability via Adaboost Algorithms”, Published in a Workshop on Health Data and knowledge Management,vol.80,Pages 55-64,Australia,January 2008.
14. Nianfeng Song, Kun Wang, MengluXu, XiaoluXie, Gan Chen and Ying Wang, “Design and Analysis of Ensemble Classifier for Gene Expression Data of Cancer”, Journal of Clinical & Medical Genomics, Volume 5 Issue 1 1000152