12-1956
Separation of niobium and tantalum by liquid
extraction
Ernest L. Koerner Jr. Iowa State College Morton Smutz Iowa State College H. A. Wilhelm Iowa State College
Follow this and additional works at:http://lib.dr.iastate.edu/ameslab_iscreports Part of theChemistry Commons
This Report is brought to you for free and open access by the Ames Laboratory at Iowa State University Digital Repository. It has been accepted for inclusion in Ames Laboratory ISC Technical Reports by an authorized administrator of Iowa State University Digital Repository. For more information, please contactdigirep@iastate.edu.
Recommended Citation
Koerner, Ernest L. Jr.; Smutz, Morton; and Wilhelm, H. A., "Separation of niobium and tantalum by liquid extraction" (1956).Ames Laboratory ISC Technical Reports. 151.
Abstract
Niobium, also known as columbium, is one of the new industrial metals likely to play an important role in industrial processing in the near future. Its high melting point (4376°F.) and low cross section for neutron absorption (1.1 barns) make it of special interest to the Atomic Energy Commission. Since tantalum, which invariably accompanies niobium in its ores, has a somewhat higher cross section for neutron absorption (21 barns) there is considerable interest in developing an industrial process for producing tantalum-free niobium. Tantalum itself is a valuable metal because of its high melting point (5160°F.) and its resistance to most corrosive chemicals.
Disciplines Chemistry
I
~ U N I T E D S T A T E S A T 0 M I C E N E R G Y C 0 M M I S S I 0 N :::-~
SEPARATION OF NIOBIUM AND TANTALUM BY LIQUID EXTRACTION Ernest L. Koerner, Jr., Morton Smutz
and
H.
A. WilhelmDecember, 1956
Ames Laboratory at
Iowa State College F. H. Spedding, Director
Contract W-7405 eng-82
ISC-802
This report is distributed according to the category Chemistry as listed in TID-4500, July 15, 1956.
Legal Notice
This report was prepared as an account of Government sponsored work. Neither the United States, nor the Commission, nor any
person acting on behalf of the -Commission:
A. ·Makes any warranty or representation, ··express or implied, with l .. espect to the accuracy, . completeness, or usefulness of the information contained in this report, or that the use of any information, apparatus, method, or process disclosed in this report may not infringe privately owned rights; or
B. Assumes any liabilities with respect to the use of, or for damages resulting from the use of any information, apparatus, method, 01 .. process discloseq in this report. As used in the above, "person acting on behalf of the
Commission" includes any employee or contractor of the Commission to the extent that such employee or contractor prepares, handles or distributes, or provides access to, any information pursuant to his employment or contract with the Commission.
from the Printed in USA. Price 40 cents. Available Office of Technical Services
TABLE OF CONTENTS
INTRODUCTION
PREVIOUS WORK
INVESTIGATION
Opening of the Ore
Preparation of the Extractor Feed Solution Separation of Niobium and Tantalum
Solvent Treatment and Recovery Final Conversion of Products
COST ANALYSIS
Chemical Costs
Equipment Costs and Investment Operating Costs
DISCUSSION OF RESULTS
LITERATURE CITED
APPENDIX A
APPENDIX B
Page
1
4
4
5 12
14
4244
45
45.
48
48
53 58
*
Separation of Niobium and Tantalum by Liquid Extractionby
Ernest L. Koerner, Jr., Morton Smutz and H. A. Wilhelm
ABSTRACT
Niobium, also known as columbium, is one of the new industrial metals likely to play an important role in
industrial processing in the near future. Its high melting point (4376°F.) and low cross section for neutron absorption
(1.1 barns) make it of special interest to the Atomic Energy Commission. Since tantalum, which invariably accompanies niobium in its ores, has a somewhat higher cross section for neutron absorption (21 barns) there is considerable interest in developing an industrial process for producing tantalum-free niobium. Tantalum itself is a valuable metal because of its li.ig;h melting point (5J.60°F.) and its resistance to most corrosive chemicals.
The purpose of this research was to find an economical method of producing a niobium oxide product containing as
little tantalum and other impurities as possible, starting with a typical niobium-rich ore or concentrate. The process
selected as a result of the research consisted of the following processing steps:
*
1. Digestion of the ore or concentrate with hydrofluoric acld.
2. Extraction of niobium and tantalum from the digested mass with an organic solvent such as methyl isobutyl ketone.
3.
Separation of tantalum and niobium by continuouscountercurrent multistage extraction using an organic solvent and an aqueous scrubbing solvent.
This report is based on a Ph.D. thesis by Ernest L. Koerner, Jr., submitted December 1956 to Iowa State College, Ames, Iowa.
4.
Separation of niobium from other impurities by a second solvent extraction step using an organic solvent.5.
Stripping of the niobium and tantalum from their solvents and regeneration of solvents.The process as outlined above was studied on a small scale and demonstrated on a somewhat larger scale so that a more accurate cost estimate could be made. Several pounds of niobium oxide containing less than 700 parts per million of tantalum oxide were produced. Several pounds of tantalum oxide containing less than 100 parts per million of niobium oxide were produced. Both purity values were the limit of detection for the spectrographic methods employed.
INTRODUCTION
Niobium and tantalum have had an interesting history. In 1801 Hatchett discovered niobium in a Connecticut mineral. Since niobium-bearing minerals without tantalum are virtually unknown, the first investigators were dealing with mixtures of these two chemically similar elements. The presence of
titanium in some cases caused additional complications. Before their final identification, seven names had been ascribed to new elements that were thought to be present in these
minerals. Marignac finally identified the two elements in 1866 by separating them as complex potassium fluorides by
fractional crystallization. He found that the complex niobium fluoride was isomorphous with the known salts K2TiF6·H20 and K2W02F4•H20, which indicated that the valence of niobium was +5 and the formula of the salt was K2NbOF5•H20• The literature on the separation of nicbium and tantalum has been reviewed by Koerner and Smutz (1).
The first industrial importance of niobium resulted from its property of combining with carbon in steel to form
stable niobium carbide. It is used as an addition agent to 18-8 chrome-nickel types of stainless steel to prevent
intergranular corrosion. More recently, niobium has been mentioned as a possible structural material in nuclear
reactors because of its corrosion resistance, high-temperature strength, and low neutron absorption. Because of the high neutron absorption of tantalum, any niobium used within a reactor would necessarily be required to be low in tantalum contamination.
Other possible uses of niobium are for gas turbine blade alloys and high-velocity, rapid-fire machine gun barrels. The former application would allow gas turbines to operate at
higher temperatures than those now in use. Present gun liners do not have a satisfactory life. Work on molybdenum liners has not resulted in a production model. If costs are not prohibitive, the high melting points of niobium and
tantalum and their alloys make them logical candidates for trial.
The physical property which makes niobium interesting for these and other applications is a melting point of 4376°F. This is roughly 1600-1700°F. higher than iron, cobalt, or nick~l,
molybdenum, which is the base for alloys useful to at least 2000°F. (if protected from oxidation). In contrast to
molybdenum, the oxide of niobium is relatively non-volatile and, therefore, may be easier to protect by alloying or coating.
For all of the above applications, niobium and tantalum must compete with relatively low cost metals. Future demand, therefore, will increase only if the price makes it competitive.
Presently the Fansteel Metallurgical Corporation is the sole producer of niobium metal. The present consumption of columbite-tantalite ores does not exceed 10,000 tons per year with only a small fraction being converted to niobium metal. During World War II, the world reserves were estimated as equivalent to 15,000,000 pounds of contained niobium and tantalum. Present known reserves are of the order of ten times this figure in columbites and one hundred times including pyrochlore minerals.
The price of tantalum metal varies from 65 to 125 dollars a pound; niobium from 230 to 300 dollars a pound. The high cost is attributed partly to the fractional crystallization process presently used to separate the niobium and tantalum. Another factor which raises the cost is the fusion method of opening the ore.
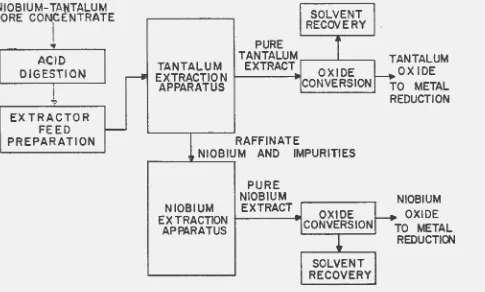
It was the object of this investigation to propose,
develop, and test a process for recovering niobium and
tantalum oxides from their ores. The process selected as a result of this study is shown schematically in Figure 1. The columbite-tantalite ore was dissolved in 70 per c~nt hydro-fluoric acid. Methyl isobutyl ketone (hexone) was used to extract the niobium and tantalum fluorides away from the
gangue materials of the ore. Th~s hexone solution of niobium
and tantalum fluorides was used as feed material for the
extraction separation. The fluoride salts were best suited to separation by solvent extraction since chlorides, nitrates, and sulfates exist only in dilute solutions.
The extraction apparatus shown in Figure 1 performed the actual separation of niobium and tantalum. The hexone
preferentially extracted the tantalum, leaving tantalum-free niobium in the aqueous phase. A second extractor then
...
ACID
DIGESTION -II
~
EXTRACTOR
FEED
r--PREPARATION
PURE
1
TANTALUM
TANTALUM EXTRACT
OXIDE ...a
EXTRACTION CONVERSION
APPARATUS
RAFFINATE
w NIOBIUM AND IMPURITIES
PURE NIOBIUM
NIOBIUM EXTRACT
OXIDE
...
EXTRACTION CONVERSION
APPARATUS
1
SOLVENT RECOVERY
ANT ALUM OXIDE 0 METAL EDUCTION
NIOBIUM OXIDE
TO METAL
REDUCTION
Figure 1. Proposed process for the separation of niobium and tantalum.
H Cll 0
I
co
0
1\)
[image:10.600.152.637.155.447.2]nine extraction stages would produce an extract of tantalum containing less than 100 parts per million of niobium and a raffinate of niobium containing less than 700 parts per million of tantalum. The purified tantalum and niobium
fractions were removed from the hexone solvents'by filtration after precipitation of the hydroxides with ammonia. The
solvent streams wer•e recovel"ed, regenerated by mixing with sulfuric acid, and recycled. The purified hydroxides were calcined to tantalum and niobium oxides.
The simulated column technique was employed to obtain equilibrium extraction data. This procedure involved a series of batch contacts operated in such a manner as to approach stead~r state in a- countercurrent extraction operation. The use of the procedure was successful in predicting product composition in continuous extraction runs.
Most of the investigation was concerned with the
opening of the ore, the purification of the extractor feed solution, and the actual separation. Attempts to strip
the solvents by various aqueous solutions were not successful so that resort was made to direct precipitation of the
tantalum and niobium fluorides in the organic phase. The
final product form of the tantalum and niobium were the oxides. These oxides were assumed suitable for metal
reduction but if other salts proved ·more useful, they could be obtained by a simple modification in the process or by direct conversion of the oxides. Based upon methods
developed in laborato1~ and pilot plant studies, a cost estimate of chemical and operating charges was compiled.
PREVIOUS WORK
Previous work on the separation of tantalum and niobium was reviewed and summarized in report ISC-793, "Separation ·
of Niobium and Tantalum - Literature Survey" by Ernest
L.
Koerner and Morton Smutz.INVESTIGATION
shown in Figure 1. It was necessary to develop methods for carrying out the individual steps in the process and to determine operating conditions and chemical and equipment requirements.
The investigation was divided into five sections: (a) opening of the ore, (b) preparation of the extractor feed solution, (c) separation of niobium and tantalum,
(d) solvent treatment and recovery, and (e) final conversion of products.
Opening of the Ore
The source material for the earth oxides was a colurnbite ore concentrate from Nigeria. The analysis of the ore used in this investigation was made by the Ledoux Company and is shown in Table 1.
The ore concentrate, as received, was mostly retained on a 65-mesh Tyler screen. Initial experiments on this 11as
received" ore indicated that a smaller particle size was
necessary for reasonable reaction rates. The ore concentrate was then ground ~o pass 325 mes~ in a Raymond hammer mill pulverizer.
Table 1. Ledoux analysis of Nigerian columbite ore
Constituent
Nb2
o
5 Ta2o
5 FeO MnO Ti02 Sn02H2 0
Per Cent
61.93
9.80
[image:12.597.88.529.462.654.2]Acid dissolution of columbite ore
The .columbite ore concentrate could be dissolved in sulfuric or hydrofluoric acids~ but in order to obtain
economical separation of niobium and tantalum the final feed solution must be niobium and tantalum fluoride. Each acid was tested in so~e detail and the resulting procedures compared. It was desirable to eliminate filtration steps since experience with the fusion process showed that
filtrations of various niobium and tantalum salts were extremely troublesome.
Dissolution of columbite ore in concentrated sulfuric acid was only moderately successful. Employing an acid to ore weight ratio of five to one and heating at 300°0. for one-half hour yielded 50 to 70 per cent reaction of the ore. When the sulfur1c acid-columbj_te ore reaction mass was
diluted approximatel:>• fifteen fold Nith water, niobic and
tantalic acids (commonly called earth acids) were precipitated while the iron and other gangue materials of the ore went
into solution as su~~ates. Filtration of the e~rth acids and unreacted ore was very troublesome because .6f the gelatinous natu~e of the cake. If the reaction mass were filtered before dilution and then the filtrate and cake
diluted with water separately, two earth acid fractions could be obtained. The fraction recovered from the filtrate
dilution was approximately 90 per cent niobium while the fraction from the cake assayed 80-90 per cent tantalum. The starting columbite ore for the above experiment was an
Argentina ore which af~sayed 50 per cent Nb2
o
5 and 17 per cent Ta 2o5 • Hm~ever, this procedure doubled the filtration difficulty because both cakes wer•e again very gelatinous.It was first determined by vl:ilhelm (2) that niobium-tantalum ores could be successfully opened by hydrofluoric
acido Wilhelm's tests indicated that 90 per cent reaction
of the ore was possible when a 100 per cent excess of cold 70 per cent hydrofluoric acid was shaken with ore concen-trate" for 8--12 hours.
Dissolution of the ore concentrate in hydrofluoric acid was attractive because of the direct conversion to the desired niobium and tantalum fluorides. However, excess hydrofluoric acid was known to decrease separation factors in the extraction process and hence was undesirable.
\.
were calculated and are shown in Table 2.
Table 2. Seventy per cent hydrofluoric acid requirements of Nigerian columbite ore
Basis: 100 grams ore
Constituent Weight Weight
70 per cent
as oxide as fluoride as oxide as fluoride hydrofluoric
acid
Nb2
o
5 H2NbOF5 61.93 95.95 66.57Ta 2
o
5 H2TaF76
'.
80 9.73 3.09FeO FeF2 18.65 24.36 14.83
MnO MnF2 1.51 1.98 1.21
Ti02 TiF4 3.48 5.40 4.99
Sno2 SnF4 2.86 3.70 1.09
H2o 0.01
95.24 141.12 91.78
As can be seen from Table 2, 100 grams of this particular columbite ore required approximately 92 grams of 70 per cent hydrofluoric acid. Since about five per cent of the ore was unaccounted for by the Ledoux analysis, it was arbitrarily decided to increase the requirements to a one to one weight ratio.
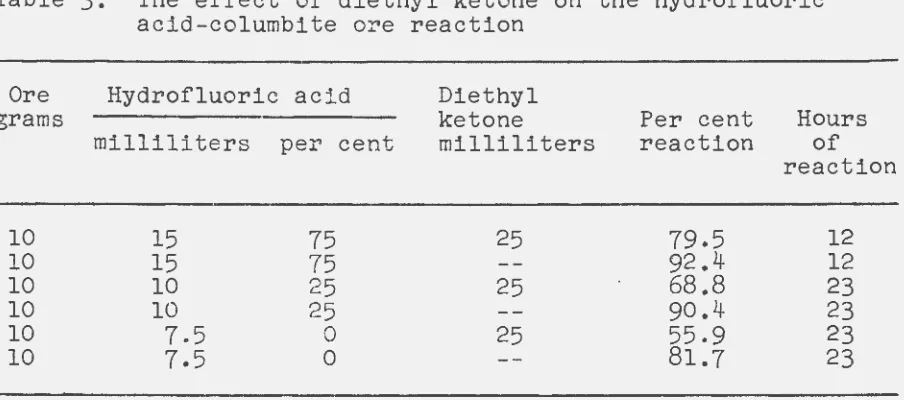
Experiments were run to verify Wilhelm's results. The first tests indicated that even with a large excess of
hydrofluoric acid, the reaction mass was viscou~. Diethyl ketone was added to increase the fluidity of the reactants. The results obtained are shown in Table 3. It should be
Table 3. The effect of diethyl ketone on the hydrofluoric acid-columbite ore reaction
Ore Hydrofluoric acid Diethyl
grams ketone Per cent Hours
milliliters per cent milliliters reaction of reaction
10 15 75 25 79.5 12
10 15 75 92.4 12
10 10 25 25 68.8 23
10 10 25 90.4 23
10 7.5 0 25 55.9 23
10 7.5 0 81.7 23
The columbite ore in the previous experiments was the Argentina oreo Hydrofluoric acid requirements for this ore were such that 7.5 milliliters was necessary for ten grams. Also, it is noted here that diethyl ketone was used in many of
the early experiments. A plentiful supply was at hand and since it belonged to the same class of compounds as hexone, it was considered immaterial which was actually used.
The results of Table 3 showed that the presence of diethyl
ketone decreased the amount of reaction. Apparently the
diethyl ketone acted as a diluent. It was also apparent that excess hydrofluoric acid was necessary for economical reaction rates. The solutions containing the diethyl ketone were more easily filtered than the solutions containing only hydrofluoric acid. Furthermore, only one phase was noted which indicated the diethyl ketone had extracted the hydrofluoric acid and the niobium and tantalum fluorides. Neutralization of a portion
of the organic ketone product resulted in the precipitation
of relativel¥ pure niobium and tantalum oxides (commonly called earth oxides). Earth oxides recovered from the aqueous solutions were colored brown instead of the usual white. The brown
color was caused by iron and other impurities in the oxides.
It appeared that the extraction of the niobium and tantalum
fluorides into an organic solvent after the ore had been reacted with hydrofluoric acid would result in a simple procedure
[image:15.595.52.504.103.303.2]In a second series of experiments various mixtures of hydrofluoric acid and concentrated sulfuric acid were reacted with 10 grams of columbite ore. It was thought that the
sulfuric acid would react with the various fluorides as
they formed to generate more hydrofluoric acid for attacking the ore. The results of this experiment are shown in Table 4.
The results of Table 4 showed that the presence of
another liquid again acted as a diluent for the hydrofluoric acid. Direct comparison of the results in which 75 per cent excess acid was used revealed that sulfuric acid decreased the amount of reaction as much as ten per cent as compared to when no diluent was added. On the other hand, sulfuric acid dilution resulted in three to five per cent more reaction than when diethyl ketone was the diluent.
Table 4. Effect of sulfuric acid on the hydrofluoric acid treatment of columbite ore
Ore Hydrofluoric acid Sulfuric acid Per Hours
grams milliliters per cent milliliters cent of
excess reaction reaction
10 20 146 20 86.3 11
10 .. 20 146 20 88.0 14.5
10 15 75 25 81.9 11
10" 15 75 25 84.4 14.5
10 10 25 30 79.0 11
10
io
25 30 81.0 14.510 7.5 0 32.5 11
10 7.5 0 32.5 70.9 14.5
Addition of sulfuric acid to the reaction mass of hydro-fluoric acid and columbite ore eliminated the possibility of extracting the earth acid fluorides from the reaction mass wi~th
an organic solvent. The large amount of sulfuric acid
resulted in two liquid phases when diethy& ketone was added. Phase separation was poor and made recovery of the unreacted ore residue and the earth acids impossible. The blank space in Table 4 was the result of following this procedure. Attempts to reduce the amount of sulfuric acid were not successful.
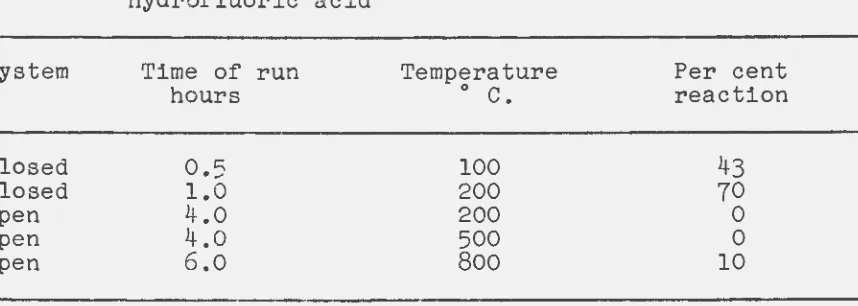
[image:16.601.92.548.315.523.2]Attempts were made to react columbite ore with anhydrous hydrofluoric acid in both sealed and open systems. A sealed bomb reactor and a rotary kiln type furnace were used in these experiments. The conditions and results of these experiments are shown in Table 5.
Table 5. Reaction of Nigerian columbite ore with anhydrous hydrofluoric acid
System
Closed Closed Open Open Open
Time of run
hours
0.5 1.0 4.0
4.0
6.0
Temperature Per cent
0
c.
reaction100 43
200 70
200 0
500 0
800 10
As can be seen from Table 5, the reaction of columbite ore and anhydrous hydrofluoric acid worked better in a closed
system than in an open system. The reaction rates shown for the closed system probably could have been higher. Stains on the lead gasket indicated hydrofluoric acid loss. Also, no fumes of hydrofluoric acid were noted when the closed reactors were opened. For the open reactions no weight loss was noted
in the first two cases reported. Leaching of the ore after reaction with both water and hexone resulted in no oxide recovered. It was concluded from these tests that a gaseous hydrofluoric acid-columbite ore reaction was feasible but only when it was run under pressure in a closed reactor.
Dissolution of the columbite ore in hot 70 per cent hydrofluoric acid was found to be the most desirable method tested. A Fluorothene beaker and cover were used in these experiments. A stirrer rod and paddle were fabricated from rigid polyvinyl chloride, sold under the trade name 11Lucoflex11 ,
and was inserted through a small hole in the center of the cover. The heat source was a hot plate calibrated to
[image:17.600.58.487.205.358.2]Aqueous 70 per cent hydrofluoric acid was added to the
ore concentrate and allowed to react for various lengths of
time, forming a slurry of fluorides and unreacted ore. At
the end of the reaction period hexone was added to the
slurry to extract the niobium and tantalum fluorides. The
solution was allowed to cool and was then filtered in a
polyethylene buchner funnel to remove the solids and produce
a clear filtrate. The fluoride cake was washed
counter-currently with hexone solutions from previous reactions, the
last wash being fresh hexone acidified to one normal with
hydrofluoric acid.
In order to use the hydrofluoric acid most effectively,
it was decided to add an excess of ore to the reaction vessel. '
It was hoped that this method of operation would reduce loss
of the acid by volatilization and also tend to keep the free
hydrofluoric acid content of the hexone solution as low as
possible. In the first experiments 82 milliliters of 70 per
cent hydrofluoric acid were reacted with 125 grams of columbite
ore. This ratio of acid to ore was such that a 25 per cent
excess of ore was present. The results of these and later
experiments under other conditions are presented in Table 6.
Table 6. Reactions of 70 per cent hydrofluoric acid and columbite ore at 100°C.
Run Acid/ore Time of run Per cent
number V~reight ratio hours reaction
2 0.8 1 46.0
3 0.8 2 65.0
4 0.8 4 94.8
5 Oe8 4 94.8
6 0.8 4 90.6
7 0.8 4 88.0
8 0.8 4 70.3
9 0.8· 4 76.1
10 0.9 4 72.8
11 1~2 93
99.3
12 0.8 9 90.7
[image:18.601.93.538.403.655.2]The amount of reaction was determined by dissolving the filter cake in water and/or acid and weighing the unreacted ore.
The data in Table
6
show that four hours was apparently a reasonable reaction time. Undoubtedly, some hydcofluoric acid was lost by volatilization under the conditions employed. Itis believed safe to assume~ then, that a reaction time of four hours in a suitable vessel, designed to eliminate hydrofluoric acid losses, would give nearly a complete reaction of the
oreo The low values reported in runs 7-10 were the result of dissolving the cake in water alone. Some fluoride residue was noted in the unreacted ore from these runs so that the
per cent reaction was probably highero For the basis of future calculations, a reaction time of four hours and a 100 per
cent opening of the ore will be used. Volume requirements for the reaction vessel were determined to be 0.192 gallons per pound of ore processedo
Preparation of the Extractor Feed Solution
In general the source materials for niobium and tantalum contained about 20 per cent total iron and manganese and
roughly five per cent tin and titaniumo In order that final purity of the niobium and tantalum be high, it was necessary to eliminate these foreign materials as early as possible in the extraction procedure~ Early experiments utilizing
aqueous feed solutions showed iron to be present in tantalum to the extent of 0.25 to Oo50 per cento The elimination of titanium was especially desirable since it associated itself with niobium and its removal necessitated a separation which is achieved with great difficultyo
Countercurrent leaching with hexone
Direct filtration of the hydrofluoric acid-columbite ore reaction mass resulted in incomplete recovery of the niobium and tantalum fluorideso Complete recovery was
effected when the filter cake was washed with water but this procedure also dissolved the iron, manganese, titanium, and tin fluorides which contaminated and diluted the original
solution. Washing the aqueous fluoride cake with hydrofluoric acid was moderately successful but this scheme proved
Leaching the reaction mass wi tl!i·. hexone proved to be the
most effective method tested~ Four countercurrent leaches
were employed for each reaction mass~ The final leach in each case was either fresh hexone or hexone acidified to one
normal with hydrofluoric acid.
The first leach was made by mixing the second leach solution from a previous run directly with the reaction mass.
The slurry was then filtered to apparent dryness on a
polyethylene Buchner funnel. In all cases the first leach
resulted in recovering 70 per cent or more of the
niobium-tantalum fraction of the ore. The filtrate volume from the
first leach increased 25 per cent over the amount of hexone
originally addedo No significant inoreases were noted in
any of the volumes of the following three leacheso The second leach was made by transferring the filter cake back
to the reactor and mixing thoroughly with the third leach
solution from a previous run. This solution usually contained
about 16 per cent of the niobium and tantalum. Repeating the
above procedure for the third leach resulted in a solution
containing
6-7
per cent Of the niobium and tantalumoWhen the fourth leach was made with fresh hexone6 very
little niobium and tantalum was found in the filtrate. However, if the fresh hexone were first acidified to one
normal with hydrofluoric acid, 2-3 per cent more of the
niobium and tantalum was recovered.
Filtration difficulties ceased when the hexone leach procedure was used. Attempts to filter the aqueous reaction mass failed as the cake set up on the filter before complete recovery of the liquid could be effected. Filtering the
reaction mass hot eliminated some of this difficulty but the
problem of recovery still remainedo
When the first organic leach solution was filtered~ the
solids always came out of the reactor intacto This first
filter cake resembled a piece of gelatin until all of the
liquid was removed. Subsequent filter cakes were then very
granular in nature and filtered with great ease. The color
of the filter cakes progressed from a dark brown after the
first filtration to a light tan after the final filtration.
Detailed filtration studies were not conducted on the
above filter cakeso The characteristics of the cakes w~re
hence a detailed study was not necessary. Each filter cake was filtered four times~ once after each washing. By
calculation~ a filter area of 0.791 square feet per pound of ore processed based on a cake thickness of one inch was
determined necessary.
The washing or leach:l.ng of the filter cake was
determined to be an important part of the process. Counter-current washing$ as carried out on the bench scale, repeatedly yielded recovery of 95-96 per cent of the niobium and
tantalum in the ore. To yield the same results on a larger scale, it was determined that a filter such as the Bird P·rayon
or Eimco Pan would be necessary. These filters have the
reputation of high cake washing efficiency and sharp
separation of filtrates, two features which fit in well with
the proposed procedure~ Because of the corrosiveness of
hydrofluoric acid and the toxicity and inflammability of hexone, such a filter would be completely enclosed. The whole unit could be constructed of monel but a cheaper method would be to employ plastics and plastic coatings. Before any mRterial of c~nstruction is chosen, it is recommended that corrosion tests be made.
The wet cake contained 0.18-0.20 pounds of hexone per
pound of solidso For economical operation this hexone should
be recovered. Drying of the fluoride cake was not
investi-gated.
Separation of Niobium and Tantalum
Conditions for the separation of niobium and tantalum
were determined by simulated column runs. Both diethyl
ketone and hexone were used in these runs. Nine simulated column runs were made under varying conditions. In all cases the niobium and tantalum were present with excess
hydrofluoric acid in the organic phase. Various concentrations of sulfuric acid were tested as the aqueous scrub solution. The tantalum preferentially remained in the solvent while the niobium and minor imp~rities were scrubbed into the aqueous raffinate.
Single stage extractions with hexone
primary stock solutions of tantalum were made by dissolving tantalum oxide, in one case# and tantalum metal, in the
second case, in hydrofluoric ac·td,; .. The solution made from the tantalum oxide analyzed
595
grams oxide per liter while the solution made from the tantalum metal analyzed 1176 grams oxide per liter. A third tantalum stodk solution was made by adding hydrofluoric acid to a portion of the second tantalum solutiono This stock solution, which analyzed989
grams oxide per liter, was an attempt to prepare a solution one normal in excess hydrofluoric acid. All of these solutions remained stable for over a year. Aprimary stock solution of niobium was made by dissolving niobium oxide in hydrofluoric acido This solution assayed
598
grams oxide per litero A portion of the ni0bium solution was evaporated yielding a second stock solution of 852 grams oxide per liter. The niobium stock solutions were unstable as precipitation started a few days after preparation. These stock solutions and various water dilutions were used asfeed solutions for the single stage extractions.
Extractions were made by shaking equal volumes of feed solution and virgin hexone in a polyethylene container. All shake ups were made for two minutes even though no
further changes in distribution were noted after 30 seconds. The phases wel"e then separ'ated in a polyethylene separatory funnel and stored in polyethylene bottles for analysis. The analytical procedures used a:r•e discussed in Appendix A.
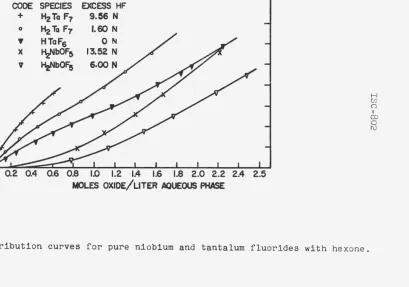
Distribution data for the three tantalum stock solutions and the two niobium stock solutions are shown in Figure 2. The concentrations in Figure 2 are shown in moles per liter to allow for more direct comparisonQ The data for these curves are tabulated in Table 20 in Appendix B.
An aoournte determination of the excess hydrofluoric acid concentration was desired for the primary stock
solutionsQ The best procedure found for the excess hydrofluoric acid concentration was by the determination of the fluoride
ion by a modified Willard and Winter (3) analysis. This method was found satisfactory on standard solutions of
tantalum and niobium in hydrofluoric acid and is presented in Appendix Ao
l&J (/) <t ::r;
n..
u
~
a:
0
a: w
1-~
0
~
f3
d
:i
CODE SPECIES EXCESS HF +
0
~ )(
I
v
H2Ta F7 9.56 N
H2 Ta F7 . 1.60 N
HTaF6 0 N
HzNbOF5 13,52 N HiJbOF5 6.00 N
0.8 1.0 t2 ·1.4 1.6 1.8 2.0 2.2
· MOLES OXIDE/L1TER. AQUEOUS PHASE
Figure 2. Distribution curves for pure niobium and tantalum fluorides with hexone.
H
(/)
0
I CD
0
[\)
[image:23.595.174.584.108.395.2]niobium distribution is more affected by an increase in acid
concentration than is the tantalum. Foos (4) has presented
a possible explanation for the lack of preferential extraction
of tantalum.at higher hydrofluoric acid concentrations by the
following reactions.
7 HF + H3~:rao4 H2TaF7 + 4H2
o
(1)
5 HF + H3Nb04 H2NbOF5 + 3H20 (2)
2 HF + H NbOF 2 5 H2NbF7 + H20 (3)
The products of reactions 1 and 3 are very similar while
the niobium and tantalum salts from reactions 1 and 2 are
quite differento It would be expected that the relative
extractability of fluotantalates and the fluoniobiates might
be similar while for the fluotantalates and the pentafluoniobiates
it might be different. Thus if an amount of hydrofluoric acid
insufficient to yield appreciable amounts of reaction 3 were
present, considerable difference in niobium and tantalum
extractability should result.
A research paper by Werning and associates (5) also
reported da.ta on the extractability of tantalum and niobium
at various hydrofluoric acid concentrations. This work
showed that tantalum extractab:l.lity apparently reached a
maximum at about six normal hydrofluoric acid while the
extractability of niobium continued to increase at hydrofluoric
acid concentrations as high as 15 normal.
Figure 2 also revealed that an increase in concentration
also increased the distribution coefficient of both tantalum
and niobiumo However, it; is interesting to note that the
niobium distributio~ coefficient apparently increased until
the aqueous solution was approximately one molar and then
remained constanto This same effect is also noted for the
tantalum distribution coefficient until the aqueous solution
was approximately Oo5 mola.:;:·.
The middle curve on Figure 2 presented an interesting topic
for discussiono The fluoride ion determination revealed that
the species HTaF6 was present with no excess hydrofluoric acid.
The proximity of this curve to the other tantalum curves showed
that HTaF6 was not as extractable as H2TaF7e It has been
suggested many times that tantalum and niobium fluorides are
extracted by ketones tbr•ough hydrogen bonding. If this be the
case then~ it follows that the HTaF6 species is not as
Simulated column runs using diethyl ketone
A diethyl ketone solution containing 209 grams
liter and assaying 4198 per cent tantalum oxide and cent niobium oxide was used in the following tests. fluoride determination also showed this solution to
normal in excess hydrofluoric acid.
oxide per 58.2 per
A
be three
Since the distribution coefficient of niobium increased
more than the distribution coefficient of tantalum at
increased concentrations~ it would be expected that the separation factors '!!"WOuld increase with decreased niobium-tantalum concentrations. To check this conclusion a series of one stage extractions wer•e made with the above diethyl
ketone solution. One molar sulfuric acid was employed as
the aqueous phase in ·chis test o The results of these one
stage shake ups are shown in Figure
3
and Table7.
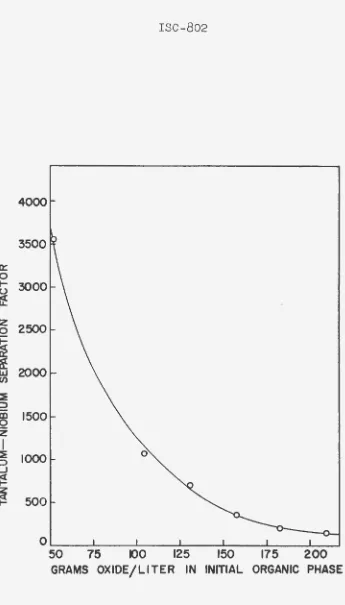
Figure 3 shows that the tantalum-niobium separation factor increased very r•apidly when the ini tia 1 feed
concen-tration was dec:t•eased be low 100 grams oxide per liter.
However» even at cor.(;rantJ."a~ions abo·ve 200 grams oxide per liter. a separation facto~ of over 130 was present.
It can be seen from Table
7
that all of the organicphases analyzed 90 per cent or more tantalum oxide. Similarly all of the aqueous phases contained 90 per cent or more
niobium oxide. In Y;:l.ew of the high separation factors
obtained, this phenomenon was to be expectedo
A fuethod for predicting the separation of niobium and tantalum by liquid extraction was desired. Since the organic phase was tantalum--rich and the aqueous phase was niobium-rich after only one contact, it was thought that the pure
component curves from Figure 2 could be used for this prediction. Hov-1ever, no completely successful method was found.
Tantalum distribution coefficients calculated from Figure 2 were usually less than oneo It can be seen from Table
7
that the tantalum distribution coefficients ranged from 14 to 120. It appeared that at ctower excess hydrofluoricacid concentration the niobium acted as a salting out agent
for the tantalum which necessarily increased the tantalum
0::: 0
1-(.)
~
4000
3500
~ 2500
~
~
2000 (/)0
0~--~---L----~----~----~--~--~
50 75 100 125 150 175 200
[image:26.599.148.493.51.656.2]GRAMS OXIDE/LITER IN INITIAL ORGANIC PHASE
Figure
3.
Effect of initial feed concentration indiethyl ketone on tantalum-niobium
Table
7.
Eqtdllbrillm contncta with Ya.r,r1ng oxide concentrAtion 1n d1etlq'1 ketone and one molar sulfuric acidCone. of Organic phase Aqu.eol.UI pha9e feed (grp..ms
Grt-JnS Per cent Grams Gra::~s GrpJ!IS Per cent Or~• ::r'l'a l)."b j3
oxidea/1) oxides/1 Gr;;?.!MI
'1'"205 ":~05/l 1ib205/l oxides/1 ?ib2c5 ~05{1 h~2c5/1
209 113~1~- 91.o4 103.2 10.2 100.2 92.87 7.2 93.4 14.4 0.109 132
183 98.6 90.05
ss.s
9.8 87.2 95-59;.s
83.4 23.0 0.11S 196157 so.6 92.02 74.2 6.4 .. 69.7 96.78 2.2 67-5 33-1 0.095 347
131 66.8 94.47 6).1 3·7 63.6 97-57 1.6 62.o
4o.r
o.o596ss
104.5 51.2 95-ll 48.7 2.5 49.6 98.20
o.g
48.7 54-7 0.051 1o6652-3 24.9 96.76 24.1 o.s 24.1 99.15 0.2 23.9 120.5 o.o;4 35~
H
(})
0 I <Xl
0
[image:27.593.51.652.69.546.2]Since the system sulfuric acid-tantalum and niobium fluorides-diethyl ketone was too complicated for calculation of stage requirements for equilibrium data by standard methods, extraction stages were determined empirically by a series of simulated column extractions. These simulated column's were used to provide the same data as a countercurrent extraction by the use of polyethylene separatory funnels as extraction stages. The flow pattern was arranged to simulate counter-current flow of solvent and §ul~uric acid.
A fractional extraction technique was used in which the feed was introduced at an intermediate point in the extractor. The organic solvent and an aqueous scrub solution were fed to opposite ends of the extractor.
In the analysis of the extraction operation the mixer-settler was divided into extraction and scrub sections. The region between the solvent entry point and the feed stage was taken as the extraction section. The action of the
solvent was to reduce the amount of tantalum leaving *1tb:ithe
r~ffinate solutiono In the feed stage essentially all of the niobium along with some tantalum was transferred to the scrub solution entering the extraction section. The function of the extraction section was to prevent any of the tantalum from leaving the extraction unit in the raffinate. The
entering solvent progressively extracted the tantalum and niobium from the aqueous phase and carried back to the feed
stage all the tantalum leaving the feed stage. Since the solvent preferentially extracted tantalum, the aqueous phase grew
progressively richer in niobium although both materials were being transferred to the solvent. Thus a tantalum-free
niobium concentrate left the extractor in the aqueous phase, or raffinate.
The scrub section was defined as the region from the solvent entry to the feed stage. The solvent entering the scrub section came from two sources, the feed and the organic solution from the extraction section. The action of the scrub solution was to progressively decrease the relative concen-tration of niobium in the solvent since the scrub solution preferentially extracted niobiumo Thus as the solvent passed through the scrub section, both niobium and tantalum were
Five simulated column runs were made with the diethyl ketone feed solution. The apparatus used in these
simulated column runs was unique and warrants a short description. The mixing and separatory funnels were made from ordinary polyethylene ''Tupperware" 16 ounce cups. A one inch piece of three-eights diameter polyethylene tubing was welded to the bottom of each cup. A hole was bored through the bottom of the cup to coincide with the inside diameter of the tubing. Another short piece of tygon tubing was firmly attached to the polyethylene tubing. Pinching the tygon tubing wi th a pinch clamp provided an effective st opcock. A corrosion resistant stirrer was made by welding a polyethylene paddle to a polyethylene coated stainless steel rod. A thin sheet of polyethylene was used to cover each mixing tube to minimize losses by volatilization and splashing.
The first extracti on test was made in an eight-stage simulated column under the fol lowing conditions:
Feed: 30 milliliters of diethyl ketone feed solution
added at stage five.
Scrub: 120 milliliters of one molar sulfuric acid added
at stage one.
Organic: 30 milliliters of diethyl ketone added at
stage eight.
This type of operation ~ave five scrub stages with an organic (0) to aqueous scrub (A) volumetri c flow rate ratio of 1/2 and three extraction stages wi th 0/A
=
1/4.After twenty-nine cycles the run was stopped and the column was sampled stagewise. These data are presented in Table 8. The aqueous product from stage eight analyzed >99.93 per cent niobium oxide or less than 700 parts per
Table 8. Stagewise analyses for the first niobium-tantalum
simulated column run using diethyl ketone
Stage Organic phase Aqueous· phase
number Volume Grams Per cent Volume Grams Per cent
(ml) oxide/ Ta 2
o
5 (ml) oxide/ Nb2o
5liter liter
1 23.25 60.82 99.95 62.0 12.85 0.10
2 23.5 83.22 99.95 60.0 20.23 0~10
3 26.5 94.30 99.95 64.5 23.00 0.10
4 24.0 104.0 99.95 62.6 17.18 0.76
5 26.5 83.70 66.73 65.0 28.08 98.02'
6 14.0 24.24 96.09 63.0 22.95 99.00
7 14.5 4.61 43.17 65.0 21.73 >99.93
8 14.0 2.88 0.01 62.0 21.22 >99.93
Since the organic product contained about 500 ppm
niobium, expressed as oxides, instead of less than 100
ppm as desired, other operating conditions were studied in
an attempt to produce purer tantalum. It was noted in Table 8
that the aqueous streams from stages seven and eight contained
spectrographically pure niobium. This indicated that stage
eight was not necessary to the extractor. It was also noted
that the compositions of the organic phases in stages one
through four remained essentially constant in tantalum content.
Similarly the compositions of the aqueous phases in stages
one through three remained constant. This indicated very
little separation was occurring. A check of the separation
factors for the first three stages confirmed this fact.
Separation factors of lo5-2.7 were calculated for the first
three stages while this factor increased rapidly to 77~5 in
stage four and 98.5 in stage five.
The data of Table 8 also revealed that the scrub section
of the extractor contained essentially all tantalum and the
extraction section all niobium. Thus a large amount of solute
was recycled in both sections of the extractor. This was
desirable since it was known that a large amount of solute
[image:30.591.82.519.105.350.2]the tantalum product was not as pure as desired, it was evident that t he amount of solute refluxing had to be 1ncreased, at least in the scrub section. It was decided
to increase the solute recycle by adding more stages on that section of the column.
From the information gained on the first simulated column run the conditions for the second test were set as follows:
Feed: 35 milliliters of diethyl ketone feed
solution added at stage seven.
Scrub; 140 milliliters of one molar sulfuric acid
added at stage o~e.
Organic: 35 milliliters of diethyl ketone added at
stage nine.
The column then consisted of seven scrub stages with 0/A
=
1/2and two extraction stages with 0/A
=
1/4. Fifty cycles ofthis run were made, after which, the stages were analyzed. The results are presented in Table 9o
The data showed in this case that neither pure niobium
nor tantalum was produced. Every tenth cycle product was analyzed and the results confirmed the stagewise data. It can be seen that the analysis of the organic phase in stage four indicated pure tantalum was present in this stage. Th~
indicated that a small amount of niobium contamination was introduced with the scrub. However, a check of the scrub solution showed no niobium contamination present. It was concluded that either the analyses were in error or the
one molar sulfuric acid concentration was too high to effect a large amount of solute recycle. Since duplicate analyses were run and each checked within 10 per cent, it was decided
to reduce the sulfuric acid concentration of the scrub.
Phase separation was slow when water and 0.05 molar
hydrofluoric acid were used as scrub salutions. Adequate settling rates were found when 0.10 normal sulfuric acid was tried. In the first two runs noticeable volume changes
occurred where fresh diethyl ketone and the sulfuric acid were added. Experiments were made with various mixtures of virgin and equilibrated diethyl ketone and sulfuric acid. The system which gave the least organic volume change was chosen. This requirement was met by using virgin diethyl
Table 9. St~gewise analyses for the second niobium-tantalum simulated column run using diethyl ketone
Organic phase Aqueous phase Stage
number .:VOlume Grams Per cent Volume Grams Per cen.t
· (ml) oxide/ Ta2
o
5 (ml) oxide/ Nb2o5liter liter
1 24 .. 5 57 .. 01 99 .. 98 74 .. 2 12.59 o.o4
2 27o9 79.38 99 .. 94 73 .. 0 19.61 0.02
3 30.,0 94 .. 43 99o97 74.8 24 .. 61 0.03
4 29.0 104 .. 9 >99 .. 99 73 .. 0 30.92 0.02
5 32.0 115.9 99 .. 99 76.0 34.73 0.04
6 29.8 122.6 99.98 72 .. 0 31.10 0.92
7 32 .. 3 110o8 99 .. 68 75 .. 5 37.42 87.33
8 16 .. 9 48ol2 97 .. 70 73.0 29.30 97.00
9 17o4 7 .. 84 49 .. 54 75.0 24.66
99,60
Two short simulated column runs were made to check the mass transfer and settling rates of the new system. Spectro-graphically-pure niobium and tantalum were produced in these runs., Since only 12 cycles of each of these two runs were madea stagewise samples were not taken because it was
doubtful that steady state had been approached.. However1 the
conditions of these two runs furnished enough information so
that more specific conditions were set for the next test.
A fifth diethyl ketone simulated column run was made under the following conditions:
Feed~ 50 milliliters of diethyl ketone feed solution added at stage four ..
Scrub: 100 milliliters of diethyl ketone equilibrated OolO normal sulfuric acid added at stage one. Organic: 50 milliliters of diethyl ketone added at
stage seveno
[image:32.591.92.546.97.359.2]of the liquid phases in each stage were carried out after the extraction process was completed.
The cycle analyses indicated that about 40 cycles of
operation were required to closely approach steady state. These analyses showed that the niobium delivered in the aqueous product contained less than 700 ppm tantalum. These data were
substantiated by the stagewise data which appear in Table 10. It can be noted from the data in this table that the tantalum in the equilibrium organic phase of stages 11 2 and 3 was
spectrographically free of niobium. Since high purity tantalum was obtained in these three end stages it is probable that the contamination of the tantalum by niobium in the organic product phase was considerably less than 100 ppm, the lower limit of detection.
Analyses of the aqueous product phase indicated that the niobium in this phase contained less than 700 ppm tantalum. Although this was the limit of detection for tantalum in niobium, it was estimated (6) that the niobium probably contained less than 300 ppm tantalum.
Table 10. Stagewise analyses for the fifth niobium-tantalum simulated column run using diethyl ketone
Stage Organic phase Aqueous phase
number Volume Grams Per cent Volume Grams Per cent (ml) oxide/ Ta2
o
5 (ml) oxide/ Nb205liter liter
1 43 .. 5 49.48
>
99.99 52.0 29.36 0.013 2 43.3 80.43>
99.99 51.5 43.14 0.020 3 46.0 93.00 >99.99 55.0 42.01 3.33 4 46.0 90.83 99.44 55.5 68.29 87.00 5 27.0 40.62 90.38 56.0 54.93 96.55 6 24.0 12.22 39.97 54.0 52.40 99.74 7 26.2 5.21 4.09 54.0 51.54>
99.93 [image:33.593.46.498.376.614.2]w V)
~ 9
Q.. 5:2
z <t
(!)
a::
0
V)
~
-a::
(!)
KEY
o
EQULIBRIUM POINTx OPERATING POINT
[image:34.597.155.489.111.576.2]EXTRACTION SECTION
section. The curvature of this line was explained by the volume changes noted in the data. The operating line for the first three stages of the scrub section defined a nearly
straight line. However, the large amount of mass transfer which occurred near the feed stage undoubtedly caused volume
changes which caused the operating line to curve a little. The position of the operating point between stage three and four could not be explainedo The odd curvature of the
equilibrium curve in the scrub section was probably the contributing factor for this ef~ect.
Table 10 also revealed that the equilibrium aqueous concentration in stage three was less than the aqueous
concentrations of stages two and four, It was apparent that something was being added in the feed which affected the
scrub stage adjacent to the feed stage since this same effect can be noted in Tables 8 and 9.
The excess hydrofluoric acid was determined in each
organic and aqueous equilibrium phase. The results are shown in Table llo The total amount of fluoride was determined in each equilibrium phaseo From the analyses the amount of fluoride required for H2TaF7 and H2NbOF~ was calculated. The excess hydrofluoric acid concentration was determined by difference. Some negative excess hydrofluoric acid values were found in the scrub section of the extractoro This probably meant that some HTaF6 w~s present in these streams. This
effect, however~ was determined to be helpful to the separation.
Table 11. Stagewise excess hydrofluoric acid determination
for the equilibrium phases of the fifth simulated
column run using diethyl ketone
Stage Organic phase Aqueous phase
number Total Hf Excess HF Total HF Excess HF
(moles/1) (moles/1) (moles/1) (moles/1)
1 1.403 -0.165 0.892 -0.038
2 2ol31 -0.417 1 .. 468 0.1101
3 2.656 -0.292 1.773 0.433
4 3.275 0.394 4o461 1.945
5 2,090 0.912 4.197 2.142
6 1.362 0.941 3.851 1.881
[image:35.595.53.509.465.697.2]It was seen earlier in Figure 2 that HTaF6 was not as extractable as H2TaF7e Hence, if some HTaF6 were present in the extractorp it would prefer the aqueous phase and thus
increase the recycle of solutes. The equilibrium distribution of hydrofluoric acid between diethyl ketone and 0.1 normal
sulfuric acid was determined. The values from Table 11
piotted in a very irregular manner with this dat~ indicating
that niobium and tantalum influenced the excess hydrofluoric
acid equilibrium.
The excess hydrofluoric acid concentration increased
rapidly between the equilibrium aqueous phases of stages
three and four. It was probable then that the acid
concen-tration affected the oxide concenconcen-tration in these stages.
Simulated column runs using hexone
Hexone solutions containing various concentrations of
niobium and tantalum oxides and excess hydrofluoric acid were
used in these tests. The first simulated column run with
hexone was a short test to check mass transfer and settling
rates. The same flow rates that were used in the fifth
diethyl lee tone run were used in this and following tests. The
aqueous scrub soluti on was 0.1 normal sulfuric acid equilibrated
with hexone. The organic extraction solution was virgin
hexone. The feed solution for this run was a hexone solution
containing 292 grams oxide per liter and assaying 16.1 per
cent tantalum oxide and 83o9 per cent niobium oxide. The
excess hydrofluoric acid concentration was determined to be
4.4
normal. From this short test it appeared that hexone wasidentical to diethyl ketone as an extraction solvent as the
mass transfer, settling rates, and end product purities were
very similaro
In the second simulated column run with hexone an attempt
was made to study the effect of composition on the separation.
A portion of the above feed solution was diluted with hexone
to yield a Seed solut ion containing 209 grams oxide per
liter and 3el5 normal in excess hydrofluoric acid concentration.
The following conditions were followed for the second
simulated column run using hexone:
Feed: 50 milliliters of hexone feed solution added at
Scrub: 100 milliliters of hexone equilibrated 0.10
normal sulfuric acid added at stage one.
Organicg 50 milliliters of diethyl ketone added at
stage seven.
Thirty cycles of this run were made9 the run was stopped, and
the equilibrium stages analyzed. The results are presented in Table 12 and Figure 5.
Since the feed concentration~ excess hydrofluoric acid concentration9 and extraction conditions were similar for the second hexone run and the fifth diethyl ketone run,
comparison of the data from these runs indicated the effect
of feed composition on the extraction. This comparison wa~
true if the diethyl ketone and bexone were assumed to have equal extraction power for this system. A comparison of the equilibrium stagewise composition showed diethyl ketone a slightly better extracting agent than hexone. However, since product purities were apparently identical9 it was difficult to attach a significant difference between the extracting power of these wo ketones in this particular systemo
The effect of composition on the extraction was clearly seen by comparing Figures
4
and 5o Increasing the niobiumcontent of the feed solution caused both equilibrium curves to shift. Since identical flow rates were used in both runs,
the extraction equilibrium curve shifted to the right because
of the increased niobium content in the aqueous phases~
Similarly the equilibrium curve for the scrub section shifted
to the left because of the decreased tantalum content in the
scrub equilibrium aqueous phaseso Both equilibrium curves were shifted downward because of the decreased tantalum
content in the equilibrium organic phaseso
It can also be seen by a comparison of Figures
4
and 5 that the operating and equilibrium curves for the scrub section of the two extraction runs were quite similaro On the other hand9 the operating and equilibrium curves for the extraction section were different. The operating curves in both scrub sections were very nearly straight lines.This indicated that volume changes in this part of the
extractor were virtually nonexistento The curvature of the extraction operating curve for the diethyl ketone run
Table 12. Stagewise analyses for the second niobium-tantalum simulated column run using hex one
Stage Organic phase Aqueous phase
number Volume Grams Per cent Volume Grams Per ce,nt
(ml) oxide/ Ta2
o
5 (ml) oxide/ Nb2o
5liter liter
1 43.8 16.88 /99.99 51.0 20.39 0.050
2 46.0 39.14 >99o99 52.0 33.92 0.044
3 45.5 53.69 )99.99 53.3 36.83 7~43
4 45.0 57 .. 44 97.57 58.0 85.43 84.37
5 25.5 28.64 82.65 56.0 81.59 97.67
6 25.0 11.50 48.65 53.0 80.79 99.45
7 26.,0 6.09 5.00 54.0 76.92 >99.93
for the hexone run indicated an increase in the organic phase
with a decrease ln the aqueous phase. These conclusions were
verified by the data in Tables 10 and 12. It was unlikely,
however, that the sulfuric acid aqueous phases in the hexone
run were soluble in the organic phases to the extent shown
by the curvature of the extraction operating line in Figure 5.
It was more probable that the mass transfer between phases
caused the volume changes. Since virgin hexone and diethyl
ketone were fed in these experiments, some volume change was
expected because of solubilityo The mass transfer which
occurred between stages, then, apparently overshadowed the
solubility of hexone in the acid phases resulting in increased
organic volumes. For• diethyl ketone the mass transfer between stages was not great enough to counteract the
solubility and decreased organic volumes resulted. For
economical reasons hexone was preferred as the extracting agent over diethyl ketone because of the higher solvent
recovery value and lower initial cost.
A third simulated column run using hexone was made to
study the effect of higher feed concentrations on the
extraction. The feed solution previously used in hexone
[image:38.587.88.544.135.342.2]UJ
CJ) <(
_:t:
Q..
0
z
<(
(,!)
a: 0
a::
UJ
t-...J
"
UJ--0
g
CJ)
:E <(
a::
(,!)
o EQUILIBRIUM POINT
X OPERATING POINT
~ d... FEED~STAGE
SCRUB
SECTION
EXTRACTION
[image:39.591.189.641.55.484.2]SECTION
Figure
5.
Equilibrium diagram for the second hexonesimulated column run.
H
(/)
0
I CD 0
Feed: 50 milliliters of hexone feed solution added at stage fouro
Scrub: 100 milliliters of hexone equilibrated 0.10 normal sulfuric acid added at stage one.
Organic: 50 milliliters of hexone added at stage seven.
Eighty-one products were taken off this run with the products from every tenth cycle analyzed. Analyses of the liquid
phases in each stage were carried out after the extraction process was completed.
The cycle analyses indicated that less than 20 cycles of
o~eration were required to closely approach steady state.
These analyses showed that the tantalum delivered in the organic extract contained less than 100 ppm niobium. The niobium raffinate was assayed and showed less than 700 ppm tantalum present. These data were confirmed by the stagewise data which appear in Table
13.
For comparative purposes the stagewise data were plotted in Figure 6. As expected the higher concentration in the feed solution shifted the equilibrium curves. It was also noted that the reversal effects present in the diethyl
ketone runs of the scrub stage adjacent to the feed stage were absento Apparently the excess hydrofluoric acid distribution between equilibrium phases was not as drastic as had been found in the diethyl ketone runs.
The effect of feeding virgin hexone into the extractor was evident in Figure 6. Employing sulfuric acid equilibrated hexone in place of virgin hexone would probably remedy this situation and decrease the curvature of the operating line.
It was desired to test the separation process as predicted by the preceding simulated column runs in a pilot plant
extractor. Two large batches of hexone feed solution were
prepared in the following manner. The Nigerian ore concentrate reported in Table 1 was the source material for the niobium and tantalum.
o EQUILIBRIUM POINT
X OPERATING POINT
0
z
<t
~
nL
SCRUB0 ~:: SECTION a:
w
1-l:±/
:!!/
<t 0: (!)
f-1
j
[image:41.593.161.614.84.452.2]Ob
.l 1.... -'-
..'.... -'-
lx
...L
_r_J_
.1- 1 .. L I . '- . !JFigure
6.
Equilibrium diagram for the third hexane simulated column run.H
(/)
0 I co
0