IN-VEHICLE SIGNING SYSTEM USING RFID
HARMIDA BINTI AROBI
This report is submitted partial fulfillment of the requirement for the award of Bachelor
of Electronic Engineering Computer Engineering With Honours
Faculty of Electronic and Computer Engineering
Universiti Teknikal Malaysia Melaka (UTEM)
UNIVERSTI TEKNIKAL MALAYSIA MELAKA
FAKULTI KEJURUTERAAN ELEKTRONIK DAN KEJURUTERAAN KOMPUTER BORANG PENGESAHAN STATUS LAPORAN
PROJEK SARJANA MUDA II
Tajuk Projek : IN-VEHICLE SIGNING SYSTEM USING RFID Sesi Pengajian: 2010/ 2011
Saya ……… HARMIDA BINTI AROBI……… (HURUF BESAR)
mengaku membenarkan Laporan Projek Sarjana Muda ini disimpan di Perpustakaan dengan syarat- syarat kegunaan seperti berikut:
1. Laporan adalah hakmilik Universiti Teknikal Malaysia Melaka.
2. Perpustakaan dibenarkan membuat salinan untuk tujuan pengajian sahaja.
3. Perpustakaan dibenarkan membuat salinan laporan ini sebagai bahan pertukaran antara institusi
pengajian tinggi.
4. Sila tandakan ( √ ) :
(Mengandungi maklumat yang berdarjah keselamatan atau SULIT*
TERHAD*
TIDAK TERHAD
________________________________ (TANDATANGAN PENULIS)
Alamat Tetap: 2701, LORONG 55 TAMAN RIA, 08000 SUNGAI PETANI, KEDAH
Tarikh: 3 MEI 2011
kepentingan Malaysia seperti yang termaktub di dalam AKTA RAHSIA RASMI 1972)
(Mengandungi maklumat terhad yang telah ditentukan oleh organisasi/badan di mana penyelidikan dijalankan)
Disahkan oleh:
___________________________________ (COP DAN TANDATANGAN PENYELIA)
Tarikh: 3 MEI 2011
“I hereby declare that this report is the result of my own except for quotes as cited in
the references”
Signature : ………
Author : HARMIDA BINTI AROBI
“I hereby declare that I have read this report and in my opinion this report is
sufficient in terms of the scope and quality for the award of Bachelor of Electronic
Engineering Computer Engineering with Honours”.
Signature : ………..
Supervisor Name : EN. AHMAD NIZAM BIN MOHD JAHARI@JOHARI
Especially for
My beloved mom(Hasidah bt Ayob) and dad (Arobi b. Bakar)
My lovely sister(Rasimah bt Arobi), My Family
My supervisor
Mr Ahmad Nizam Bin Mohd Jahari@Johari
All beloved friends
ACKNOWLEDGEMENT
First of all, I am greatly indebted to Allah SWT on His blessing to make this
project successful and completely done in properly. I would like to gratitude and
express my appreciation to all organizations and individuals who have kind heartedly
contributed to my final year project in Universiti Teknikal Malaysia Melaka
(UTeM). With the cooperation from all parties, the objectives of the project were
achieved precisely to the expected outcome Additionally, I would like to give a
honored thanks to Mr Ahmad Nizam Bin Mohd Jahari@ Johari for supervise me
with the proper guidance and full cooperation in any phase of the project especially
in solving the problems that occurs from first to last of my final year project.
Furthermore, I would like to thanks to my parents and family who have
support me for all this years with their love and caring in term of moral, financial and
advice through this project. Lastly, my appreciation goes to my fellow links in
UTeM, especially from Faculty of Electronic Engineering and Computer
Engineering and all beloved friends. Their compliance in giving suggestions and
technical support are valued while doing upon completion of my final year project.
ABSTRACT
Road traffic sign is very important and has been used as common guidance to
vehicle drivers globally. Usually, traffic sign located at the roadside are likely to be
overlooked than dynamic visual information during driving. In this report, the
development of In-Vehicle Signing System using Radio Frequency Identification
(RFID) technology is discussed. The system is designed to alert the vehicle driver on
the speed limit signboard at low speed area such as at school, university campus and
curve area. This project system was designed to read traffic sign depend on the
signal data stored in RFID tags. The data was presented as an alarm and image data
on vehicle terminal screen using Visual Basic 6 (VB6) software as Graphical User
Interface (GUI). Microsoft Comm. Control 6.0 is used to connect the Visual Basic
with serial port for RFID communication. The process of programming in VB6 will
drive the output as a sign display in the vehicle terminal (computer). The GUI was
connected with Microsoft Access 2007 database that store the tag data using
Microsoft ActiveX Data Object (ADO) tool in VB6. As a result, this system was
able to alert the driver about the speed limit at the low speed area. The in-vehicle
signing system is suggested to replace the existing static traffic sign that located at
ABSTRAK
Papan tanda isyarat adalah sangat penting dan secara umumnya digunakan
sebagai petunjuk kepada para pemandu kenderaan. Akan tetapi, papan tanda isyarat
dan maklumat visual statik biasanya akan terlepas pandang berbanding dengan
maklumat visual dinamik atau visual bergerak semasa pemanduan dilakukan. Di
dalam laporan ini, Sistem Paparan Isyarat dalam Kenderaan menggunakan RFID
akan dibincangkan. Projek ini merekabentuk sistem yang akan memaparkan isyarat
jalan di dalam kenderaan menggunakan teknologi Radio Frequency Identification
(RFID). Sistem ini dibina bertujuan untuk memastikan pemandu kenderaan sentiasa
dalam keadaan berwaspada dalam mematuhi had laju yang telah ditetapkan
terutamanya di kawasan-kawasan berkelajuan rendah seperti kawasan sekolah,
kampus universiti dan kawasan selekoh tajam. Sistem paparan isyarat papan tanda
ini direkabentuk bergantung kepada data yang disimpan dalam tag RFID. Paparan
isyarat papan tanda di dalam kenderaan dihasilkan dalam bentuk imej visual dan
berpenggera menggunakan perisian Visual Basic 6 (VB6) sebagai grafik antaramuka
atau GUI. Dalam perisian VB6, perkakas Microsoft Comm. Control 6.0 digunakan
untuk menghubungkan perisian dengan RFID. Proses merekabentuk dan
pengaturcaraan dalam perisian VB6 akan menghasilkan GUI bagi sistem ini. GUI
berhubung dengan pangkalan data menggunakan perkakas Microsoft ActiveX Data
Object (ADO) yang terdapat pada perisian VB6. Sebagai hasil, sistem ini dapat
memastikan pemandu lebih berwaspada ketika pemanduan terutamanya di kawasan
berkelajuan rendah. Sistem Paparan Isyarat dalam Kenderaan menggunakan RFID
TABLE OF CONTENTS
CHAPTER TITLE PAGE
PROJECT TITLE i
REPORT STATUS VALIDATION FORM ii
DECLARATION iii
SUPERVISOR DECLARATION iv
DEDICATION v
ACKNOWLEDGEMENT vi
ABSTRACT vii
ABSTRAK viii
TABLE OF CONTENTS ix
LIST OF TABLE xii
LIST OF FIGURE xiii
I INTRODUCTION 1
1.1 Problem Statement 2
1.2 Objective 2
1.3 Scope 3
1.4 Report Outlines 3
II LITERATURE REVIEW 5
2.1 Radio Frequency Identification (RFID) 6
2.2 Software 9
2.2.1 Visual Basic 9
2.2.2 Microsoft Access 10
2.3.1 Dedicated Short Range Communication (DSRC) 11
2.3.2 Image Processing 13
2.3.3 Global Positioning System (GPS) 15
2.3.4 RFID 17
2.4 Summary of previous study 19
III PROJECT METHODOLOGY 21
3.1 Phase 1: Preliminary Investigation 22
3.2 Phase 2: Analysis and Identifying 22
3.3 Phase 3: Design 24
3.4 Phase 4: Implementation and Development 27
3.4.1 RFID Reader 27
3.4.2 Software Development 30
3.4.3 RFID with PIC 16F877A 35
3.4.3.1 PCB Development 36
3.4.3.2 Mounting Component and Soldering 37
3.4.3.3 Interface RFID reader (RFID-IDR-232N) with
PIC16F877A 38
3.5 Phase 5: Maintenance and Troubleshooting 40
IV RESULTS AND DISCUSSION 42
4.1 Testing Equipment 43
4.2 RFID reader configuration 43
4.3 Communication between the RFID and Hyper Terminal 46
4.4 Tag Position 49
4.5 Software Results 51
4.5.1Graphical User Interfaces (GUI) as Display Unit 51
4.5.2 Communication between RFID and GUI 54
4.5.3 Database in MS Access 56
4.5.4Relationship between the Visual Basic and Database 57
V CONCLUSION AND RECOMMENDATION 61
4.1 Conclusion 61
4.2 Recommendation 63
REFERENCES 64
APPENDIX 67
Appendix A 68
Appendix B 70
LIST OF TABLE
NO TITLE PAGE
2.1 Comparison of the specification of passive RFID and active RFID 8
2.2 Specification for DSRC 12
2.3 Comparison of previous projects 20
LIST OF FIGURE
NO TITLE PAGE
2.1 The Components Block of RFID Systems. 6
2.2 System Overview RFID with PIC 16F877A 7
2.3 The Layout of the Beacons 12
2.4 Process of Image Processing 13
2.5 Overall System Configuration 14
2.6 The basic function of GPS 15
2.7 The information flow between the vehicle and the traffic control centre 16
2.8 Usage for an active attendance system when entering school 18
2.9 Configuration System “Transportation Quality Monitor Using Sensor Active
RFID”by Kohei Mizuno and Masashi Shimizu 19
3.1 Flowchart of Project Developing 23
3.2 Flowchart of Design System 25
3.3 The overall of the system 26
3.4 System Overview 27
3.5 RFID reader and RFID tag 28
3.6 Architecture of RFID reader 28
3.7 Configuration of RFID tag 29
3.8 Framework of MS Access 2007 30
3.9 Framework of Visual Basic 6 31
3.10 The main window of Visual Basic 6 32
3.11 The Toolbox of Visual Basic 6 34
3.13 Circuit design using Proteus 36
3.14 Output Pin Configuration 39
3.15 Pin Connection from RFID reader to PIC circuit 39
3.16 The block diagram for this system 40
4.1 Cable Configuration 43
4.2 USB Configuration 44
4.3 Female Configuration 44
4.4 DB9 Configuration 45
4.5 Female Socket Configuration 45
4.6 RJ11 male pin Configuration 46
4.7 Selection terminals communication in the hyper terminal 47
4.8 COM3 Properties Configuration 48
4.9 Display ID tag through the proper configuration 49
4.10 Position of tag 50
4.11 Project Overview 50
4.12 Programming in Error 51
4.13 Main Frame 52
4.14 Connection Frame 53
4.15 (a) & (b): Flows of In-Vehicle Signing System that will display in terminal53
4.16 MSCOMM connection 55
4.17 Database System 56
4.18 Database Summary 57
4.19 Controls in the dialog box ADO components 57
4.20 Links program for VB and database 58
CHAPTER 1
INTRODUCTION
1.0 Introduction
Traffic signs visually provide drivers with regulatory, warning and guide
information. Vehicle drivers are requested to collect dynamic visual information such as
traffic signals and static visual information including traffic signs. However, traffic signs
and other static visual information are having less benefit and tendency to be overlooked
than dynamic visual information during driving are higher. The traffic signing system
The RFID technology is a wireless sensor technology which is based on the
detection of electromagnetic signals [1]. Electromagnetic passive RFID tags require no
power source, are highly resistant to dust or obstacles and of very small size. Tags are so
cheap that they can be installed in large numbers [2]. An in-vehicle signing system is
built and assessed that uses general-purpose RFID tags as digital traffic signs and
communications between the road surface and vehicle equipment.
1.1 Problem Statement
Nowadays, too many accident happened because of lose control of the vehicle
due to over speed driving. Besides that, drivers are lacking of concentration during
driving, their comfortable vehicle and does not notice and realize about the traffic
signing especially speed limit signboard. This contributed to increase the number of
vehicle accidents from time to time. In addition, many drivers are not focuses on their
driving because of not aware of the traffic signs, especially speed limit signs. As a
solution to this problem, the signal display system in a vehicle has been built to make
driver more alert on every condition when their driving. The system will display traffic
signs in the vehicle using RFID technology as an alternative to replace the signal board
on the existing road.
1.2 Objective
i. To study and understand the RFID system and implementation
ii. To create a system that aims to make drivers be more cautious when approaching
the sign board area.
iii. Design interface of traffic signal display system in the car.
1.3 Scope
The scope of work in this project is:
i. Build an interface and assessed an in-vehicle traffic signing system using passive
frequency identification (RFID) tags. For example accessed in vehicle speed
limit, especially in low-speed areas such as area schools, hospitals, university
campuses and the sharp bend / hill.
ii. Build a database by using Microsoft Access 2007 to store RFID tag data and data
on the signal board
iii. GUI is developed by using Visual Basic 6 that connected with RFID
iv. Design circuit using PIC 16f877A and connected with RFID
v. Testing display systems in vehicles that have been designed
1.4 Report Outlines
This thesis is a written documentary that contains records such as the idea
generated, concepts applied, activities done and the final year project product itself. It
consists of five chapters. Following is a chapter-by-chapter description of information
in this thesis.
In Chapter 1, discussion on what the project is really all about, such as the
introduction of the project, the project objectives, problem statement and the scopes of
project that been elaborated.
Chapter 2 looks into the literature review that has been done especially on the
theoretical concepts on the various methods and applications in stability monitoring
systems of high rise buildings currently being practiced. This chapter discusses the
Besides that, this chapter provides the preview on the concepts and fundamentals of
Radio Frequency Identification (RFID), Image Processing, Global Positioning System
(GPS), Dedicated Short-Range Communication (DSRC) and the basic concepts of the
system applicable to achieve the objectives of the project.
Chapter 3 is regarding the project methodology that involves the necessary tasks
and activities to be undertaken to complete the project such as hardware development
and software development that form the major bulk of the project. Besides that, this
chapter also describes how to integrate the hardware and software to function as complete system.
Chapter 4discusses about the results from the research and literature review and
the option that is suitable for the project development. It also discusses on the
improvement that can be done in this project.
Finally, Chapter 5 contains the summary of the final year project. Problems
encounter during progress of the project will also be discussed in this chapter. The
conclusion, suggestions or recommendations for improvements can be implemented in
CHAPTER 2
LITERATURE REVIEW
2.0 Literature Review
This chapter will be focusing on the technology and software that can be used in
this project. The previous studies or project that has been done by previous researcher
2.1 Radio Frequency Identification (RFID)
Radio-frequency identification (RFID) is a technology that uses communication
via electromagnetic waves to exchange data between a terminal and an object such as a
product, animal, or person for the purpose of identification and tracking. Some tags can
be read from several meters away and beyond the line of sight of the reader.
Radio-frequency identification involves interrogators (also known as readers) and tags (also
known as labels) [3]. RFID systems can be classified into two categories according to
the tags power supply: active RFID systems or passive RFID systems. In passive RFID
tags require no power source, are highly resistant to dust or obstacles and of very small
size. Tags are so cheap that they can be installed in large numbers.
RFID tags store information by a small integrated circuit that will communicate
via antennas that located on the tag reader. RFID readers are capable to reading
information on the tag and send the information to a computer terminal [5].It will
receive a radio frequency from RFID tag before it sends to computer. RFID reader and
tag must follow the same standard to make a communication between readers and tag
successfully Figure 2.1 shows the components block of RFID systems.
Figure 2.2: System Overview RFID with PIC 16F877A
RFID tag also can be read and display using microcontroller (PIC 16F877A). RFID-IDR-232N can be connected to PC or microcontroller as part of embedded
system. In this project as shown in figure 2.2, the reader will be interface to a
microcontroller. Assembly language or C compiler (depending on microcontroller type)
can be used to write program in microcontroller. RFID-IDR-232N will read the ID from
RFID tag if the tag is near enough to RFID Reader. The ID is normally 10 digit of
number. RFID-IDR-232N will automatically send this ID with 1 byte of Start of heading
(0x01), followed by 10 byte of ASCII character (ID) and 1 byte of Start of text (0x02).
When the RFID tag is place near the RFID reader, the RFID reader read the
RFID tag, further sends the tag ID to the PIC microcontroller. PIC microcontroller
process the tag ID, the user name and the tag ID will be display on the LCD display.
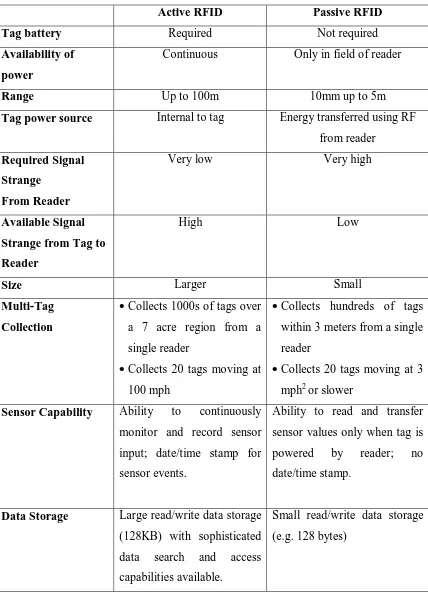
In general, low frequency RFID passive tags have the capability of
communication distance of about 30cm. While high frequency passive tags within 1m
and Passive Ultra High Frequency tags (UHF) have an effective range of 3-5m.
Comparison of the specification of passive RFID and active RFID are shown in table
Table 2.1: Comparison of the specification of passive RFID and active RFID
Active RFID Passive RFID
Tag battery Required Not required
Availability of
power
Continuous Only in field of reader
Range Up to 100m 10mm up to 5m
Tag power source Internal to tag Energy transferred using RF
from reader
Required Signal
Strange
From Reader
Very low Very high
Available Signal
Strange from Tag to
Reader
High Low
Size Larger Small
Multi-Tag
Collection
Collects 1000s of tags over a 7 acre region from a
single reader
Collects 20 tags moving at 100 mph
Collects hundreds of tags within 3 meters from a single
reader
Collects 20 tags moving at 3 mph2 or slower
Sensor Capability Ability to continuously
monitor and record sensor input; date/time stamp for
sensor events.
Ability to read and transfer
sensor values only when tag is powered by reader; no
date/time stamp.
Data Storage Large read/write data storage (128KB) with sophisticated
data search and access
capabilities available.
Small read/write data storage
2.2 Software
Nowadays, various applications are available for building and managing
databases system. There are ranges of database management software that can be
used. Each software comes with different features and used for different
applications. The database management software that is usually used is MS Access, SQL
Server, and Oracle. Studies are done in choosing database management software to be
developed accordance with the In Vehicle signing Systems. The criterions for identified
software are choosing the best software and compatible with the system. Among the
criteria to be considered are:
i. The database can accommodate the number of total number of data is high.
ii. User-friendly GUI.
iii. Reasonable prices for commercial purposes.
2.2.1 Visual Basic
Visual Basic (VB) is a software and programming language developed by
Microsoft Company. It is derived from the BASIC and can be used in Rapid Application
Development (RAD) for advanced graphical interface or Graphical User Interface
(GUI). VB on the database is using tools such as Data Access Objects (DAO), Remote
Data Objects (RDO), or ActiveX Data Objects (ADO) and ActiveX objects.
Writing programming languages such as VBA and VBScript is commonly used
in VB through in different methods. Programming in VB is a combination of a visual
component parts or control over the form, setting properties and actions of each
component. Lines are addition to writing code for the display system of multiple
functions. Because of the properties and actions have been determined for each component, it can facilitate the process manual for the construction of more simple
Due to its advantages, the use of Visual Basic development system has been
applied extensively in various fields such as project "Development of a Modern Control
System Analysis Package Using Visual Basic Programming" by M. F. Khan Rahmat and
Shu, Lee [4].
2.2.2 Microsoft Access
Microsoft Access (MS Access) is a database management system from Microsoft
that can connect to the Microsoft Jet Database Engine with a GUI interface and tools for
software development. MS Access is one of the software in Microsoft Office 2007
system.
MS Access software to use and retrieve data stored in Access or Jet, Microsoft
SQL Server, Oracle and others. MS Access is usually used in small businesses,
departments within large companies, and the programmers to design ad hoc customized
desktop systems in handling and manipulating data [6].
From the perspective of the functions that programmers, one of the advantages of
this software are comparable to the Structured Query Language (SQL). Queries can be
displayed graphically or edited as SQL statements and SQL statements can be used
directly in Macros and Visual Basic Applications (VBA) Modules to manipulate tables
in MS Access. Other than that; it allows the data to be viewed and modified easily at any
time. It can create different types of interface objects that allow working with the data in
the databases become simple and efficient. Users can combine and use both VBA and
MS Access is software that is most suitable for use in accessing the database
from VB6. By using the relationship Jet 4.0, MS Access database from VB6 to be linked
with more easily. Thus, MS Access was chosen for use in the construction of a database
for the development for the In Vehicle Signing System.
2.3 Previous work
There are several hardware and technologies that has been used in line to in
vehicle signing system. Several of those technologies that have been implemented are as
follows:
i. Digital Short Range Communication (DSRC)
ii. Image processing
iii. Global Positioning System (GPS)
iv. Radio Frequency Identification System (RFID)
2.3.1 Dedicated Short-Range Communications (DSRC)
Dedicated short-range communications (DSRC) are one-way or two-way short-
to medium-range wireless communication channels specifically designed for automotive
use and a corresponding set of protocols and standards. It offers communication between
the vehicle and roadside equipment. It is a sub-set of the RFID technology. This
technology for Intelligent Transporting System (ITS) applications is working in the 5.9
GHz band (U.S.) or 5.8 GHz band (Japan, Europe). Table 2.2 below shows the
Table 2.2: Specification for DSRC
Carrier frequency 5.8Ghz-band
Modulation method Amplitude shift keying (ASK)
Transmission bit rate 1024 kbps
Communication type Broadcast and two way
Communication zone 30m or less
The project by Hiroshi et. al. proposed for The Japanese Advanced Cruise-assist
Highway System (AHS).This system provides driving support services through
collaboration between the system and vehicle. AHS used Dedicated Short-range
Communications (DSRC) for road to vehicle dialog that requires real time and high
reliability operation. AHS-DSRC constitutes a small radio zone that provides driving
support information. DSRC incorporates a marker beacon and an information beacon
that are successively positioned at the roadside. The marker beacon is located at the
starting point of the service area, while the information beacon is located at the
information-provision point. The combination of marker beacon and information beacon
lets the vehicle know the direction of driving and decides whether the service is
required. Figure 2.3 shows the layout of the beacons [7]
The studies also have been made of traffic signing systems using DSRC and
systems using digital road data. The project by Oki et. al. [8] describes a verification
system for roadside-to-vehicle communications by the Dedicated Short Range
Communication (DSRC) system for prevention of vehicle overshooting on curves. It
also describes the results of AHS service effectiveness verification, drivers' evaluations,
and verification of the reliability of the AHS support system. This system help the driver
safely maneuver through a curve by providing such messages to the driver as "No over
speeding" and "Slow down" before the vehicle enters the curve via 5.8-GHz short range
communications. Systems using DSRC offer reliable communications but involve
problems of cost and space if they are to be installed on ordinary roads.
2.3.2 Image Processing
Image processing is any form of signal processing for which the input is an
image, such as photographs or frames of video. The output of image processing can be
either an image or a set of characteristics or parameters related to the image. The
recognition process, the camera captures the scene images continuously and forwarded
the captured image to the computer for further processing. The process of image
[image:27.612.264.395.483.691.2]recognition is shown in figure 2.4.
Studies have also being carried out on image processing in which traffic signs are
automatically detected by camera captures the scene images continuously and forwarded
the captured image to the computer for further processing. Khairul, Salina, and Aini [9]
have made possible the recognition of traffic signs and signals based on the data on their
color and shape by eliminating from the image other types of data that are not to be
recognized. Figure 2.5 illustrates the overall system configuration. Allow cost web
camera is mounted on the driver’s side roof rack, looking outside to road. This position
was chosen to allow the camera to share the same viewpoint as the driver. In this way,
both the camera and driver will have nearly the same visibility of speed limit signs that
are placed beside a don the road. During the recognition process, the camera captures the
scene images continuously and passes the captured image to the computer for further
processing.
Figure 2.5: Overall System Configuration
Detecting and recognizing road sign objects in an image frame involves a wide
range of operations and algorithms. The speed limit sign recognition system will
perform two major tasks: detecting speed limit sign and digit recognition. The speed
limit sign detection module is the primary engine of the system. It receives an input
image, performs noise filtering, object segmentation and localizes the object. Note that,
the input data are the colored video taken from a moving vehicle. The object of interest
is extracted from the original image. The next phase is handled using the post-processing
.Lastly, each digit will be fed to the digit recognition module for the classification
process. This project proposed a system to alert drivers with a speed limit sign
recognition process. The system notifies the drivers the allowable speed limit. This will
alert them to reduce their driving speed [9].
Kohashi et. al. [10] have made possible the recognition of traffic signs and
signals based on the data on their colour and shape by eliminating from the image other
types of data that are not to be recognized. Makanae and Kanno [11] have proposed
traffic signs designed to be recognized by computer and evaluated their visibility. Image
processing systems are inapplicable where visibility is poor because of the weather or
the visibility ahead of the vehicle is deteriorated by large vehicles.
2.3.3 Global Positioning System (GPS)
Jean Marie Zogg [12] state that GPS is a process used to establish a position at
any point on the globe The following two value can be determine anywhere on earth:
i. One’s exact location (longitude, latitude and height co-ordinates)
ii. The precise time (Universal Time Coordinated, UTC)
GPS receivers are used for positioning locating, navigating, surveying and
determining the time and are employed both by private individuals (e.g. for leisure
activities, such as trekking, balloon flight and cross-country skiing etc.) and companies
(surveying, determining the time navigation, vehicle monitoring etc.)[12].The latter
systems by Uchimura et. al. [13] extract positions of traffic signs from an image of a
road scene incorporate the position data into digital road data and present traffic sign
data with geographic information using a GPS-based car navigation system.
Figure 2.7: The information flow between the vehicle and the traffic control center
Intelligent Transportation Systems (ITS) and Traffic Management Systems try to
provide passengers with efficient instructions, in order to avoid congested roads and
reach their destination sooner. Traffic Management Systems (TMS) are an ITS’s
functional area that is responsible for gathering information about traffic and deliver it to
drivers. TMS involve detection, communication and control. The main idea is a
surveillance system that detects traffic conditions and transmits the information to a
traffic management center. The traffic management center processes the real-time traffic
data and sends them to the drivers. The contribution of Global Positioning System
(GPS), which give the position of the vehicle with accuracy of a few tens of meters, is of
great importance for the development of ITS. The information flow between the vehicle
GPS-based systems do not provide for dynamic update of signs on the map and
provide less accurate position data in places where GPS is unavailable such as tunnels
and other structures.
2.3.4 Radio Frequency Identification (RFID)
Nowadays, the RFID technology has been widely used such as medical surgeries,
animal identification, baggage handling, library service and real time location tracking.
Referred to Yoon, Chung and Lee [14] , RFID is an automatic identification method,
whereby identification data are stored in electronic devices, called RFID tags
(transponders), and these data are retrieved by RFID readers (interrogators) using radio
frequencies. RFID systems can be classified into two categories according to the tags
power supply: active RFID systems or passive RFID systems.
The specification project and configuration policy of RFID tag system which is
to be an infrastructure for pedestrian navigation applications. These project systems
combined with various kind of information provision function contribute to helping
those who have, so-called, “digital-divide” such as elderly and disable people, overseas
and domestic visitors etc.
Based on the studies of M. K. Yeop Sabri, M. Z. A. Abdul Aziz, M. S. R. Mohd
Shah and M. F. Abd Kadir, RFID has been used as a web-based attendance record for
attendance problems among students [15].This system receives 5 different levels for
each accessed the Administration, Student, Lecturer, and University Administration and
accessed, where each guest has access to a limited extent on the level of a consumer. In
addition, Whai-De Chen and Hsuan-Pu Chang also applying RFID technology in the
development of projects related to recording the presence and traffic problems [16].The
system will send information to parents of student attendance through mobile phones in the morning and monitor the traffic situation around the nursery, especially when parents
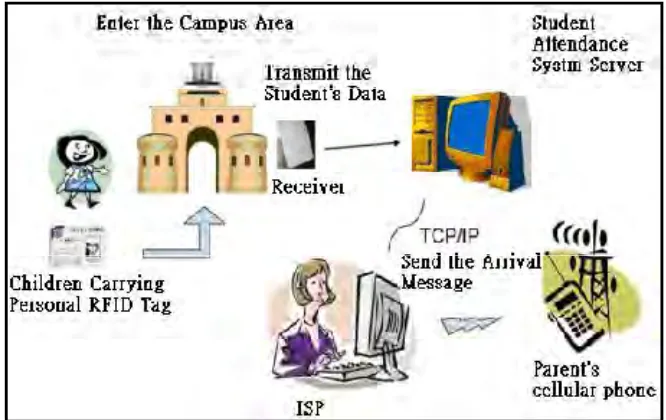
The flow of this project is illustrated in Figure 2.8. When a student goes into the
school, the reader will respond the student’s tag and write his/her information into the
roll file. At the same time, the system reads the information of the student and sends
message to his/her parent through the massage sender. It proves that the student has
[image:32.612.162.495.189.399.2]reached school safely, and let his/her parent work without worry.
Figure 2.8: Usage for an active attendance system when entering school
Other than that, RFID technology also has been used to monitor transportation
systems which refer to project of Transportation Quality Monitor Using Sensor Active
RFID [18]. Active RFID has been used to monitor the container tracking from
Yokohama Port to Kobe Port with our active RFID Systems.
Active RFID tags are constantly powered, whether in range of a reader or not,
and are therefore able to continuously monitor and record sensor status, particularly
valuable in measuring temperature limits and container seal status. Additionally, active
RFID tags can power an internal real-time clock and apply an accurate time/date stamp
to each recorded sensor value or event. The results show that our active RFID system
has the capability to acquire a movement history and sensor data easily with low power
Figure 2.9: Configuration System “Transportation Quality Monitor Using Sensor Active
RFID”by Kohei Mizuno and Masashi Shimizu.
For this project the RFID technologies is been chosen because RFID tags are
therefore free from the problems related to the cost and location of installation of DSRC,
accuracy of position data provided by GPS or visibility where image processing is
adopted. RFID offers communications only in a limited area because it uses feeble radio
waves. RFID can provide information in specified areas, so it can identify positions
highly accurately. Electromagnetic passive RFID tags require no power source, are
highly resistant to dust or obstacles and of very small size. Tags are so cheap that they
can be installed in large numbers.
2.4 Summary from Previous Study
This indicates that the methodologies and technologies have been used and a
summary of previous projects that have been made. The summation is shown in Table
Table 2.3: Comparison of previous projects
This project by Hiroshi et.al. (2003)[3]
This project
by John
Fawcett et. al (2000) [5]
This project by Uchimura et. al (2002) [4]
This project by Kohei et. al (2007)[6]
Technology Dedicated Short Range Communication (DSRC) Global Positioning System (GPS) Image Processing Radio Image Processing (RFID) Project Purposed
System help the driver safely through a curve by providing such messages to the driver as "No over speeding" and "Slow down"
before the
vehicle enters the curve
System attract positions of traffic signs from an image of a road scene, incorporate the position data into digital road
data and
present traffic sign data with geographic information
using GPS
based car
navigation system
To recognition of traffic signs and signals based on the data on their
colour and
shape.
Used to monitor the container tracking from Yokohama Port to Kobe Port with active RFID Systems.
Range 30m or less - - Up to 100m
Disadvantage DSRC offer reliable
communications but involve problems of cost and space if they
are to be
installed on ordinary roads
Do not provide for dynamic update of signs on the map and provide less accurate
position data in places where
GPS is
unavailable such as tunnels
and other
structure
inapplicable where visibility is poor because of the weather or the visibility ahead of the
vehicle is
deteriorated by large vehicles
CHAPTER 3
METRODOLOGY
3.0 Methodology
The project is to design a system that will display the signal path in the vehicle
using Radio frequency identification technology. The entire system is divided into five
main phases in order to complete the design requirements. The phases are preliminary
investigation, analysis and identifying, design, implementation and development and
maintenance and troubleshooting. These projects are divided in two methods, namely
software development and hardware development. And both methods will be combined
3.1 Phase 1: Preliminary Investigation
For this stage the problem from traffic sign is identified. Traffic sign are more
likely to be overlooked than dynamic visual information during driving especially at low
speed area. This project is designed to display the sign and present the data as alarm and
image data on vehicle terminal screen and can alert the driver about the speed limit a
low speed area. To accomplish the preliminary investigation phase involves on:
1) List problems, directives and opportunities
2) Negotiate preliminary scope
3) Assess project worth
4) Plan the project
3.2 Phase 2: Analysis and Identifying
In-vehicle signing system using RFID will be created in software and hardware.
In software, the system is created that analyzed to use a passive RFID as hardware
because of its benefits such as cheap, small in size and can be installed in large numbers
.Visual Basic 6 interface is used as a display unit. . All the programming will be stored
in Visual basic. This system has two main hardware components which are reader
including tags and circuit. The tag ID will be stored in the database include the data of
speed limit at certain area. The tag will be detected by the reader and the speed limit sign
will displayed at terminal using Visual Basic 6 as user interface. In hardware, circuit are
include in this project by using PIC 16F877A that be connected to RFID reader. ID will
be stored in the program that been stored in PIC 16F877A.The tag will be detected by
Figure 3.1: Flowchart of Project Developing
Development of Software
Install Coding Development of
Hardware
Install Coding
Testing Testing
Combined with RFID
Final Testing and Maintenance
Final Testing and Maintenance
End Start
Study and research
Combined with RFID
No No
No No
Yes Yes
3.3 Phase 3: Design
This is a phase to determine system design’s specifications. For this project, the
developing flows as shown in figure 3.2. The developing flow are important to make
sure the project will be done as planning especially on part of the integration between
hardware and software.
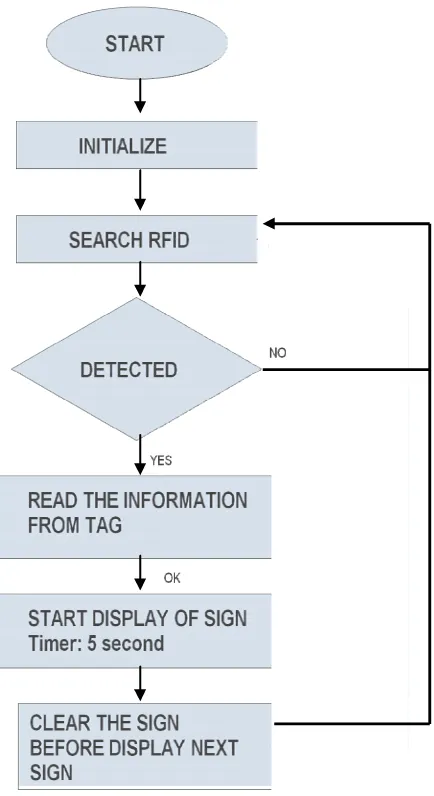
The overall of the system will be designed which started with detecting of RFID
tags until system displaying the sign data in vehicle terminal. The development
flowchart illustrate that when a RFID tag is detected or identifying, tag data are read to
determine the type of tags. RFID reader will be connected to the computer using a serial
interface base (Serial Port) and will be converted using USB converter. Tags will be
placed in the road surface in areas such as school, university, sharp bend and hump.
When the vehicle through the tag ID, the RFID reader will detect the frequency
of tag in 125kHz. The program will pass and can continue with combination within
hardware and software. RFID reader will send the signal to the display unit that is
constructed using VB6. If tag cannot be detected, process must be repeated until it
passes. Display of data on the traffic sign before will terminated automatically depend
on the tag ID detected by the reader.
No No
Yes Yes
No No
Yes Yes
No No
[image:39.612.111.569.68.675.2]Yes Yes
Figure 3.2: Flowchart of Design System
Combine with database
Error? Compile with coding
to PIC
Test Test
Pass? Test Pass? Test Compile Interface Error? Test Etching and Solder
Figure 3.3: The overall of the system
RFID reader need to be configured and +5V power supply before it can be
function properly. The LED will indicate green RFID reader ready locate the ID tag
frequency 125kHz. Display system alerts the vehicle is urged to use RFID to replace
traffic signal in the roadside. RFID tag will be placed on the surface of the road in three
areas of low speed limit within the scope of the project at area UTEM which is have
crossing path, sharp bend and hump. The RFID reader will be placed in the car as
illustrated in figure 3.4. As a result, the traffic sign and sound will be appearing at the
Figure 3.4: System Overview
3.4 Phase 4: Implementation and Development
3.4.1 RFID Reader
RFID readers are antenna that will receive a radio frequency from RFID tag before it sends to computer. The RFID reader is a device that transmit radio frequency
when powered ON. When the RFID tag is place near the RFID reader, the RDIF tag will
receive the radio frequency via the antenna inside RFID tag. The radio frequency
received will be converted into electrical power that is enough for the RFID tag to
transmit the data back to the RFID reader. Further, the RFID reader will transmit the tag
ID to PIC or PC via serial communication. Figure 3.5 shows example of passive RFID
reader used in this project. Effectiveness depends on the RFID reader which is:
1. The power output and cycle time
2. Subsystem interface project
`
Figure 3.5: RFID reader and RFID tag
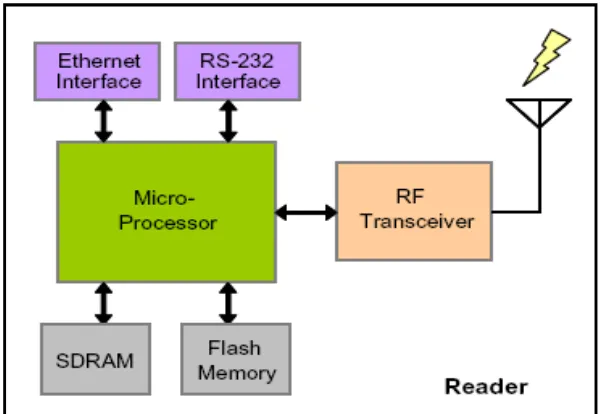
Referring to figure 3.6, the reader microcontroller controls the radio frequencies
in the communication that receives from the tag and will process all the tasks such as
communication protocols and responses from tag.
This system reader has 125 KHz operating frequency with 9600 baud rate and
using RS232 serial interface (output only) to PC. It fully operated with 5VDC power
supply. RFID-IDR-232N will read the ID from RFID tag if the tag is near enough to
RFID Reader. The ID is normally 10 digit of number. RFID-IDR-232N will
automatically send this ID with 1 byte of Start of heading (0x01), followed by 10 byte of
ASCII character (ID) and 1 byte of Start of text (0x02). This protocol is only valid for
RFID-IDR-232N.
Figure 3.7: Configuration of RFID tag
Different types of RFID reader sometimes have different protocol. The 1st byte
will be read is “Start of heading” followed with 10 bytes of RFID Identification number.
The last 1 byte is “Start of Text”. This system RFID reader was installed on the vehicle
at height of 5cm from the ground surface. The reader will detect the tag ID and
connected the data stored in database to the display unit. The buzzer will sound and LED
will turn to green when the tag has been detected. Display of data on the traffic sign
3.4.2 Software Development
The implementation of software development was carried out using two
computer software that is, MS Access 2007 and Microsoft Visual Basic6 (VB6). MS
Access 2007 is used in creating the database that will store all information on traffic
signal signs. Graphical Interface or Graphical user interface (GUI) is built using VB6 to
create programme and simulation. This software is selected in the traffic signing system
because it’s providing the easy and simple programming language and it is more users
friendly. Therefore, it is suitable for used in enhancing this traffic signing system.
[image:44.612.125.528.280.543.2]i. Database using MS Access 2007
The database can store information on traffic signal signs that built using MS
Access 2007. Figure 3.8 shows the main frame and the data information based on tag ID.
We can see the information on traffic signal stored in third column of tag ID, area and
speed limit. In the first column shows the data of RFID tag ID while the second column
is area of low speed data and hence the last column shows the speed limit of traffic sign.
[image:45.612.215.463.213.471.2]ii. Graphical User Interfaces (GUI)
Figure 3.9: Framework of Visual Basic 6
VISUAL BASIC is a VISUAL and events driven Programming Language. These
are the main divergence from the old BASIC. In BASIC, programming is done in a
text-only environment and the program is executed sequentially. In VB, programming is
done in a graphical environment. In the old BASIC, you have to write program code for
each graphical object you wish to display it on screen, including its position and its
color. However, In VB, we need to drag and drop any graphical object anywhere on the
form, and can change its color any time using the properties windows. The display unit
of is using the Visual Basic 6 software as a GUI to display the sign data to the driver at
the computer. The interface will be connected with database that stored the displayed
present different sign at the computer terminal. Figure 3.9 shows the main frame of VB6
software that been used as a GUI. By using this software, the interfaces will more
attractive to built. This software also provide a simple programming language that uses
the BASIC language and has the function of the system more user friendly and suitable
for enhancing the traffic signing system.
Figure 3.10: The main window of Visual Basic 6
Figure 3.10 shows the main window in VB6. The items available in this
window are the title bar, menu bar and bar equipment. The title bars shows the name
of the project, the operation mode and form the basis of the current Visual Basic.
Each menu bar is available in other menus, which allow the user to control the
operation of this software environment. In the menu bar there are buttons to devices
that provide shortcuts to some menu options. In the main window also shows the
location of the relevant form at the top, left corner of the screen and
the width and length of the current form. Docked on the right side of the screen, just
under the toolbar, is the Project Explorer window. The Project Explorer as a quick
reference to the various elements of a project namely FORMS, CLASSES and
MODULES. The entire object that makes up the application is packed in a project. A
program, although a program may consist of a single form. In addition to forms, the
Project Explorer window also lists code modules and classes.
In properties window for a form, we can rename the form caption to any name
that we like best. In the properties window, the item appears at the top part is the object
currently selected. At the bottom part, the items listed in the left column represent the
names of various properties associated with the selected object while the items listed in
the right column represent the states of the properties. Properties can be set by
highlighting the items in the right column then change them by typing or selecting the
options available. We also change the properties at runtime to give special effects such
as change of color, shape, animation effect and so on. For example the following code
will change the form color to red every time the form is loaded. VB uses hexadecimal
system to represent the color. You can check the color codes in the properties windows
which are showed up under Fore Color and Back Color.
The Object Browser allows us to browse through the various properties, events
and methods that are made available to us. It is accessed by selecting Object Browser
from the View menu or pressing the key F2. The left column of the Object Browser lists
the objects and classes that are available in the projects that are opened and the controls
that have been referenced in them. It is possible for us to scroll through the list and
select the object or class that we wish to inspect. After an object is picked up from the
Classes list, we can see their member (properties, methods and events) in the right
column. A property is represented by a small icon that has a hand holding a piece of
paper. Methods are denoted by little green blocks, while events are denoted by yellow
Figure 3.11: The Toolbox of Visual Basic 6
The Toolbox contains a set of controls that are used to place on a Form at design
time thereby creating the user interface area. Additional controls can be included in the
toolbox by using the Components menu item on the Project menu. A Toolbox is
represented in figure 3.11. In the display system of signs in the vehicle, the equipment
plays an important role is a command button, text box, list box, combo box and the
timer.
Command button in this system acts as a button to get out into the system as the
'ENTER' to enter the system and the 'EXIT' to exit the system. In addition, Button
command also serves as a link and decided to switch the line of communication
between RFID and GUI display system. Showing the speed and the area of speed
traveled by the vehicle will be displayed in text boxes that have been designed.
Timer in the system acts in determining the time of the alarm signal is sounded, to clear
the history of data in list box and to display form in the system that been in terminal
the vehicle. Timer for the alarm system is set to read in 5 seconds, while the visual
signal speed limit signs will be displayed on the terminal is a vehicle within 5 seconds.
Figure 3.12: Interface design
3.4.3 RFID with PIC 16F877A
The designation of the circuit is developed based on the research and information
that being were made and after discussion with the supervisor. After that, all the
components and parts that meet the specifications and requirement were purchased. The
specifications and requirement of the components and parts have to be identified
carefully in order to avoid non-compatible and redundant parts. The functionality of the
circuit has to be tested, analyzed and determined using circuit simulation. This is to
ensure that it fulfill the requirements of the project and to avoid problem while
developing the real circuit.
However, a comprehensive simulation is not possible as there is no such software
available in the laboratory for optical circuits. The nearest to doing is the testing using
Proteus, Protel and etc. Figure 3.13 shows the circuit design using Proteus by applying PIC16F877A. This project will use PIC16F876A and the RFID reader (IDR-232) to
Figure 3.13: Circuit design using Proteus
3.4.3.1 PCB Development
After the simulation is done, it is time to develop the real circuit. However, the
connections of the components have to be tested first by connecting the circuit on the
breadboard before it was transferred to the PCB board. Breadboard is used as the
connection medium since it is easy to replace the components and for easy alteration.
The circuit that been converted into PCB layout design using PCB Wizard is printed
onto transparency paper using laser jet printer.
The printed PCB layout is also called artwork and its line must be dark enough
for the next step purpose. Make sure the board that is used is a positive type and from
the right type. After that, they are then been exposed to the ultraviolet light. The UV
Expose machine is set to 25 second. Then, put the laminated board onto the artwork.
Make sure that the artwork is put correctly due to the right position of the real circuit.
The board that been exposed to UV Ray light is put in the Developing machine for at
least 2 to 4 minutes.
Next insert the board in the Etching machine with the printed part of the board or
the circuit is on the top. The etching process took about 4 minutes. This process is
necessary to remove the uncovered cuprum layer to form a perfect circuit board. Put the
board in resist strip tank to removes the hard polymerize resist from the remaining
copper foil circuit pattern. Leave it there for about 5 to 10 minutes. Then take it out and
rinse it with water and it is now ready to be cut.
Cut the board according to the circuit size by using cutter. This process is to
separate the circuit part from the unwanted part on the board. Besides, it is to make the
circuit board to look neat. Lastly, the board is ready to be drilled to make holes. Drilling
is a process to make holes on the PCB before the components can be mounted on it.
Holes through a PCB are typically drilled with tiny drill bits made of solid tungsten
carbide. The drilling is performed by electric PCB drilling machines in a stand
3.4.3.2 Mounting Component and Soldering
The most important thing that has to be done before mounting the components on
the PCB is to recognize its polarity by referring to the schematic circuit and schematic
layout. They also can be identified by using equipment such as multimeter. This is
necessary because a mistake in arranging the component as example wrong polarity arrangement will damage the component itself and the circuit will probably not
functioning. After we place the component, we can solder it to the PCB. Soldering is a
method of joining metal parts using a filler material (solder). In soldering component on
3.4.3.3 Interface RFID reader (RFID-IDR-232N) with PIC16F877A
The RFID reader comes with a cable for data communication. The cable is
consist DB9 serial port for data communication to PC, RJ-11 connector to connect to
RFID Reader and a USB connector to supply 5V for the reader. For this project, user has
to cut the wire of the DB9 Serial Port and connect the wire to a 2510-04 female
connector. Table below is example of output wire when user cut the wire of female DB9
Serial Port. The display unit of traffic sign is using LCD to display the sign data to the
driver that are located inside the car. Sign display depends on the tag ID that stored in
program that be burned in PIC. Different tag ID will present different sign at the LCD.
Example of wire color output shown as table 2.4:
However, user need to refer color Figure 3.14 and table of output pin
configuration for output color function. It is because different types of RFID reader
sometimes have different color of output wire. Orange is not necessarily Vcc, red; brown
and black also are not necessarily Tx, Rx and GND pin.
Figure 3.14: Output Pin Configuration
After cut the female DB9 Serial Port, connect four of the wire to 2510-04 female
connector according to the color of the wire on figure 3.14 and pin configuration. For
example, from figure 3.15 pin 1 which is orange color will connect to Vcc of PR8, pin 4
[image:53.612.238.414.436.614.2]which is red color will connect to data pin of PR8.
3.5 Phase 5: Maintenance and Troubleshooting
This phase is focused on two of testing part. One is the GUI and database and
second is testing coding of PIC with RFID. During design the GUI for each form, there
will use a lot of programming. For every button in form, it will test to make sure its
work. The test of the database with the system is very importance. The link of the ADO
that connect the database and the location of the database and table must same. For
every time of system been upgrade, it must be run to make sure there no problems
occurred. Then system is combined with the hardware. The test done to checked for any
connection problems between the RFID and the system. The troubleshooting is done for
errors occurred that happened in test. If there is an error or problem it will try to solve
and run to make it better.
The In-vehicle signing system using RFID that contains three main parts which
are RFID tags RFID reader and computer as a display unit. The block diagram for this
system is shown in Figure 3.16
Figure 3.16: The block diagram for this system
To testing program with PIC, we apply MPLAB software with PICkit2
programmer to download the program into PIC. To turn the source code into something
that can be programmed into the actual PIC microcontroller chip, we need to assemble
the code. When the program is done, we can compile the program and make sure no
folder that been created. We need to download the HEX file and program it. When the
program already burn into PIC, we can test to circuit. The test done to checked for any
connection problems between the RFID and the circuit. The troubleshooting is done for
errors occurred that happened in test. Also check the connection between circuits with
RFID, make sure the wire are solder properly in the right position. Refer table if not
CHAPTER 4
RESULTSAND DISCUSSION
4.0 Results
This section discusses the results and analysis for the whole of this project. The
system is built to read traffic sign and signal data stored in RFID tags placed on the road
by an in-vehicle RFID reader. The tag data is stored in database and presented as alarm
and image data on vehicle terminal screen. By using the Visual Basic 6 software and
RFID, this system will be able to alert the driver about the speed limit at the low speed
area and capable of displaying signing on a terminal in the vehicle. In the future
in-vehicle signing system can replacing the existing static traffic sign that located at the
road side. This project is done in two parts, hardware and software. Description of the
4.1 Testing Equipment
In this system, the hardware is tested and configured with set of specifications so
that can operate within the system that is design using VB. This section is divided into
several sub-topics of configuration and testing of the RFID reader and tag position.
4.2 RFID reader configuration
RFID readers in the vehicle signing system in this vehicle should
be configured to activate it. Figure 4.1 show that there are two cables on RFID to
be configured with the RS232 cable and pin DB9 (female) cables. The communication
line has to be connected to serial port of PC. RS232 cable on RFID is used to
communicate with a computer or communications system. RFID-IDR-232N power
source is from USB connection, it shows as figure 4.2. 5V are needed to ON the RFID
reader. After providing power to RFID-IDR-232N, the LED will light ON with the RED
[image:57.612.231.422.442.603.2]color and buzzer will beep.
Figure 4.2: USB Configuration
Once RFID is supplied with power supply, the LED on the RFID reader will be
colored red. These marks the RFID readers are ready to locate the ID tag passive 125
kHz frequency. The LED on the RFID reader will turn green after a tag is detected.
For this project, RFID readers will be put in the car model. For RFID systems that do not
use a computer (PC), modifications to the hardware and the interface is needed. USB
connector 5V supply cable and grounding to RFID. For more detail about the
configuration of each pin on DB9, USB and RJ11, it will discuss as below.
If RFID-IDR-232N is require on embedded system where no PC is available,
hardware modification and interface is necessary. USB will provide 5V and ground to
RFID-IDR-232N, while female DB9 is communication line to PC. Below show the pin
configuration of USB, RJ11 and DB9 of RFID-IDR-232. The pin in USB that most
important for the system is on the USB cable pins VCC and GND while for the DB9
cable pin RD, TD and GND. It shows in figure 4.3 and 4.4 as below.
Note: TD-receive data from RFID to the terminal
RD-send data from PC to RFID
SG-giving the signal logic 0
[image:59.612.206.451.66.285.2]Figure 4.4: DB9 Configuration
Figure 4.6: RJ11 male pin Configuration
Referring toDB9 cable in Figure 4.4, the reader only receives data from RFID
tags to be sent to the system via pin number 2. The Response back from the RFID
system via pin 3 does not apply. This is because the traffic signal display system in this
vehicle is only using one-way communication system. This system only can receives
signals from RFID signals to display Traffic sign unit. Figure 4.5 shows output pin
configuration for output color function. It is because different types of RFID reader
sometimes have different color of output wire. Orange is not necessarily Vcc, red, brown
and black also are not necessarily Tx, Rx and GND pin. Location 1 and 6 of RJ11 is
show as figure 4.6. It’s important to allocate the wire accordingly as figure 4.5. In
hardware configuration between circuit and RFID, we can refer Interface RFID reader
(RFID-IDR-232N) with PIC16F877A that been discussed in chapter 3.
4.3 Communication between the RFID and test computer with Hyper Terminal
Hyper Terminal is used to test the existence of communication between RFID
readers and a computer via RS232 cable. This is used to determine whether a
computer can receive the ID tag that was traced by the reader to be used for further
processing. It’s important to check whether the RFID reader is function correctly r
Figure 4.7: Selection terminals communication in the hyper terminal.
Starts with Hyper Terminal on the computer is set to use COM3 (terminal
numbers that have been used) as shown in Figure 4.7. To check what the available port
that been used in RFID, we can check it by right click on Computer then
select->Properties->Device Manager->Ports. Further, the COM3 port is configured to ensure
that the received signal corresponding to the RFID reader in terms of speed, data bits,
stop bits and flow control to ensure that RFID readers are willing to read the address on
the ID tag 125 kHz passive. Then configure the properties of COM3 as below that show
in figure 4.8:
i) Baud rate (Bits per second) = 9600
ii) Data bits = 8
iii) Parity = None
iv) Stop bits = 1
Figure 4.8: COM3 Properties Configuration.
Baud rate is set according to the specifications of the RFID reader. 9600 baud
rate (bits per second) is the third highest attainable by the system. Baud rate is the
number of elements or pulse input or output that sent on a communication line in a
moment. While the data bits have been set to 8 bits per second of data bits transmitted
over communication lines. Parity has also been configured to none (no) is used to detect
certain er