7-1953
Kinetics of the reaction between lithium and water
vapor
Bruce E. Deal
Iowa State CollegeH. J. Svec
Iowa State CollegeFollow this and additional works at:http://lib.dr.iastate.edu/ameslab_iscreports Part of theChemistry Commons
This Report is brought to you for free and open access by the Ames Laboratory at Iowa State University Digital Repository. It has been accepted for inclusion in Ames Laboratory ISC Technical Reports by an authorized administrator of Iowa State University Digital Repository. For more information, please contactdigirep@iastate.edu.
Recommended Citation
Deal, Bruce E. and Svec, H. J., "Kinetics of the reaction between lithium and water vapor" (1953).Ames Laboratory ISC Technical Reports. 70.
Abstract
A critical examination of the reaction between lithium and water vapor has been made at 35.0°, 45.0°, 55.0°, 65.0°, and 75.0°C. Analyses of the products have indicated that LiOH and H2 are the species formed corresponding to the equation
2Li + 2H2O -> 2LiOH + H2.
Keywords Ames Laboratory
Disciplines Chemistry
UNITED STATES ATOMIC ENERGY COMMISSION
ISC-390
KINETICS OF THE REACTION BETWEEN
LITHIUM AND WATER VAPOR
By
Bruce E. Deal
H.J.
Svec
July 1953
Ames
Labora~ory..
i1
I. ABSTRACT II. INTRODUCTION
III. HISTORICAL AND REVIEW 0~ LITERATURE A. Lithium
B. Rate Laws for Gas-metal Reactions IV. EXPERIMENTAL INVESTIGATION
A. Apparatus B. Procedure
V. EXPERIMENTAL RESULTS VI. BmLIOGRAPHY
CHEMISTRY
This report has been reproduced direct from copy as submitted to the Technical Information Service. Since nontechnical and nonessential prefatory ma-terial has been deleted, the first page of the report
b page 5.
Work performed under Contract No. W-7405-eng-82 •
Arrangements for reproduction of this document in whole or in part should be made directly with the author and the organiza-tion he represents. Such reproducorganiza-tion is encouraged by the
United States Atomic Energy Commission.
lSC-390
5 5 6 6 10 15 15 16 20 31
KINETICS OF THE REACTION BETWEEN
LITHIUI•1 "-\.ND WATER VAPOR*
by
Bruce E, Deal and H. J, Sv.ec
I. ABSTRACT
A critical examination of the reaction between lithium and water
vapor has been made at 35.0°~ 45.0°,
55.0°,
65.0
°,
and75.0°C.
Analyses of the products have indicated that LiOH and H2 are the species
formed corresponding to the equation
Three rate variables have been examined for this reaction: time~ pressure~ and temperature. The reaction data have been found to obey the
logarith-mic rate lavJ w = k log(l + 0.45t), where w =weight of water reacted per
unit area of lithium surf~ce, t
=
time, and k is the rate constant. Ithas been shown that the reaction rate decreases as a function of pressure
at any particular temperature, becoming independent of the water vapor
pressure ~Then the pressure is reduced belovJ a certain limit. This limit~ ing pressure was found to be approximately
50
mm. of Hg at 45. 0°C. and60 mm. of Hg at
55.0°C.
No investigation was made to determine the minimumlimiting pressure belovl which the reaction rate would again decrease.
The Arrhenius equation ln k
=
-E/RT + c, where k=
reaction rate constant~E
=
activation energy, T=
absolute temperature, and R and c are constants3was used to determine the activation energy. Values for the activation
energy of the lithium-water vapor reaction were estimated to be 6.2 kcal./ mole when the 1..rater vapor pressure was about
50
mm. Hg and5.5
kcal./molewhen the water vapor pressure was approximately 100 mm. Hg.
II. INTRODUCTION
During the first 100 years following its discovery in 1817, the
alkali element lithium remained a laboratory curiosity and was
essentially neglected by the chemical indust~. Elemental lithium is
very reactive and difficult to prepare in pure form. A freshly exposed
metal surface tarnishes in moist air at ordinary room temperatures with the formation of a dark metallic-appearing film. This film turns white after the reaction proceeds eno~gh for the film to have considerable thickness. It adheres to the metal surface acting as a protective layer.
This process of film formation is similar to that which occurs when many metals react with oxygen gas or corrode in various liquid
medium. Considerable interest is attached to a better understanding of
these processes, since they have such vast economic influences on our lives. For this reason a program has been initiated to stuqy the reaction of an active metal, lithium, with water vapor. This program includes a close examination of the rate at which the reaction occurs, the identification of the reaction products, and an attempt to
correlate the results of the study with those found for other gas-metal reactions. From the conclusions of such a study should come the guide-posts for studies with less active metals.
III. HISTORICAL AND REVIE1f OF LITERATURE
A. Lithium
In 1817, August Arfvedson (1), a Swedish scientist, discovered lithium. This came as a result of analyzing the mineral petalite, an aluminum-lithium silicate, now known to have the formula LiAl(Si205)2, found in the iron mines of Sweden. During his analysis, Arfvedson . observed a 4 per cent loss in weight in the mineral which he was unable to account for. A sulfate w:as prepared which, although similar in some properties to the other alkali sulfates, did not show reactions typical
of sodium or potassium. Furthermore, the carbonate was only slightly
soluble in water, and this fact lead him to believe he had found a new alkali element. The new element was called 11Lithium11 (from the Greek word A 1. 9os , meaning stone). Since it occurred in minerals, it
was thus distinguished from the alkali elements sodium and potassium which
at that time were thought to be found only in plants. ·
Other chemists soon started working on the preparation of pure ·• ·
lithium, and in 1818 Sir Humphry Davy (2, p. 8) prepared a minute amount of lithium metal by electrode composing moist lithium oxide. However, it was not until 1854 that any appreciable amount of lithium -..Tas produced.
Bunsen and Hatthiessen (2, p. 8) electrolyzed fused lithium chloride and obtained enough pure metal to enable them to determine some of its
physical and chemical properties. It remained until 1893, When
Lithium constitutes about 0.004 per cent of the earth's crust and
is found widely distributed. It occurs mainly as silicates, phosphates~
fluorides~ and chlorides. The United States possesses the richest
deposits of known lithium minerals in the world. The most important of these minerals are spodumene [LiAl(Si03 ) ~, lepidolite (a
lithium-ortho-silicate), kryolithionite (Na1Li1(AlFnJ?l' amblygonite (Li(Al,F)P04), and petalite, the lithium-aluminum siiic~te studied by Arfvedso~.
Lithium is extracted from its ores according to severaL methods.
The phosphate ores are decomppsed by either aqua regia or hydrochloric acid, and the lithium chlor1de formed is extracted qy suitable methods. Silicate ores were formerly treated qy a fusion method involving the
addition of various carbonates and sulfates, but at present a process
developed
qy
the Metallgesellschaft A. G., Frankfurt-am-Main, Germany,is used. In this process the finely ground ore is mixed with excess
K2so4~ and the mixture heated to a temperature just below the lowest
melting point of any component or possible product. UsuaLly this minimum temperature is about 720°C., which is the melting point of KLiS01,. One
of the final products of this process is Li2
so
4, which is extrac~ed from the mixture with water.Reduction of the oxide with silicon under a vacuum will produce
lithium metal. However, a more practical method is the electrolysis of
a fused mixture of LiCl and KCl. KCl is added to increase the
conducti-vity of the melt and to lower t~e melting point of the fused chlorides.
Both the molten LiCl and molten lithium metal are extremely reactive~
but despite this the metal is now being produced with a purity of
99.5 per cent metal and an efficiency of above 95 per cent, based on the
amount of LiCl used.
Lithium is the first of the Group Ia elements in the periodic table. It displays properties similar to the elements in this group. However,
some of its properties are more similar to the elements in Group IIa than
they are to the alkali metals. At room temperatures, lithium met~l can
be handled as easily as calcium. It is not necessary to observe the
extreme precautions required to manipulate the more active metals such
as sodium, potassium, rubidium, and cesium. While these latter elements
sometimes react violently in air, lithium reacts Slowly. The primary
reaction is probably with nitrogen to form Li3N if enough water vapor is present to catalyze the reaction (2, p. 14). In an atmosphere of helium,
argon, or low-molecular weight hydrocarbons, lithium can be melted and
poured into molds without great difficulty. Lithium reacts with water
to displace hydrogen rapidly, but not so violently as do the other
alkali metals. Spontaneous combustion of the hydrogen or the metal does not occur, since lithium does not become molten (melting point l86°C.)
as do Na, K, Rb, and Cs. The similarity of the basicity of lithium to the alkaline earths, rather than to the other alkali elements, is
A stable compound, LiH, is formed when lithium and hydrogen react at elevated temperatures. It is ionic in character and very similar in properties to the halogen salts. The halides also are formed by direct union of the elements at high temperatures. The properties of the halides generally resemble the alkaline earth halides. Lithium reacts slowly with nitrogen to form the nitride which gives off NH when allowed to react wi. th water. It is a black compound mel
tin~
at 845°c. Lithium oxide (Li20) is formed by direct union of the elements at high temperatures, and snall amounts of Li202 are also found to be present in the product. The color of most lith!um compounds is white.Lithium hydroxide is less hygroscopic than either NaOH or KOH.
A finely powdered mono-hydrate, LiOH·H2
o,
crystallizes from aqueous solution. Lithium hydroxide is approx~mately one fifth as solubleqy
weight in water as -NaOH and ltoH. It is nearly one hundred times moresoluble in water than
cao.
LiOH melts at 445°c., and its vapor pressure is 760 mm. of Hg at 925°C. Lithium metal alloys readily with Ag, Al, Cd, Bi, Hg, Mg, Pb, Sn, Tl, andZn.
A great many intermetallic compounds are formed in the alloys. It is the only alkali element that alloys with silicon.Osborg (2, p. 17) listed some physical and chemical properties of lithium metal, and these agree 'vith an AEC publication on lithium prop-erties prepared by Jesseman (3). The main properties of the metal are listed in Table 1.
No large quantities of lithium compounds or the metal were used commercially before 1941. Since that time, however, many uses have been found. In the chemical industry many of its compounds now have wide application. One of the more recent applications is the use of organa-lithium compounds in organic syntheses. The alloys formed by lithium are of considerable importance in today's metallurgical industry.
Lithium performs the function of degassing, deoxidizing, desulfurizing, and in general, purifying many commonly used non-ferrous alloys. At this time, however, the largest user of lithium is the ceramic
industry (4).
Walter M. Fenton of the Metalloy Corporation (5) summarizes the commercial uses of lithium and its compounds.
Ceramic industry
Lubricating grease
Pharmaceuticals
- low-melting porcelain enamels
- multipurpose greases
- production of synthetic vitamin A and other ap plica-tions of the "Lithium Grignard reaction"
Table 1
Physical and Chemical Properties of Lithium Metal
Atomic number
Isotopes
Atomic weight
Specific gravity at 20°C.
C~stal structure
Color
Hardness, Mohs• scale
Melting point
Boiling point
Specific heat at 0°C
Average specific heat, 0° - 157°C
Heat of fusion
Heat of vaporization
Coefficient of thermal expansion (cubic)
between 18° and 180°C
Electrical Conductivity
· Characteristic spectrum lines
3
7 and 6 (Li 7
/Li
6 : 12/1)6.940
0.534
body centered cubic
silve~ white
0.6
186°c
13J6°c ~
5°
0.7951
1.3215
32.81 cal./gm.
35.4 kcal./gm. atom
1.8o1 x lo-4
11.7 recip. ohm/cu. em.
Metallurgy - use of lithium copper
cartridges for degasification and scavenging of oopper and copper alloys
Metallurgy (light metals) -use of lithium halides in braz-ing fluxes and weldbraz-ing rods for brazing and welding alumina
Electronics -use of lithium in the formation of ferrites
B. Rate Laws for G~s-metal Reactions
In studying the reactions occurring between metals and gases,
correlation of many variables is necessary to explain the reaction rates observed. These variables involve the characteristics of the metal and
particularly the nature of the reaction-product film which is deposited
on the metal surface. Many reactions between metals and oxygen have been reported in the literature. As a result of these studies, an extensive theory has developed to explain the observations made. The reaction between lithium metal and water vapor takes place with the formation of a reaction-product film on the metal surface, and thus rate observations should be explainable b,y the same laws governing reactions involving oxygen and metals.
Gulbransen (6) listed the following variables as being important in any systematic study of the kinetics of the aocidation process for a particular metal or alloy:
(1)
time,(2)
temperature, (3) gas pressure,(4)
surface preparation, including chemical treatments,(5)
composition of the oxidizing atmosphere, (6) concentration of the inert gas in the lattice of the metal, (7) crystal orientation in the metal surface, (8) surface area, (9) cycling procedures in temperature, (10) rate of gas flow, and (11) vacuum effect. However, he stated that the three most important variables from the point of view of reaction kinetics are time, temperature, and pressure.Several laws have been proposed to explain the time variation of the oxidation of metals. The most important of these are (1) the linear law,
(2) the parabolic law, and (3) the logarithmic or exponential law. In
1922
Tammann and Koster (7) found that the interference color changes on the surface of zinc heated to 400°C in air followed an exponential law. This was statedwhere y
=
film thickness as obtained from the interference color observa-tions, t=
time, and A and b are constants. The following year Pilling and Bedworth in a now classic work (8) proposed the linear and parabolic rate laws to explain the rate of oxidation of copper, cadmium, zinc, and other metals at high temperatures. Which of these laws were applicable to a particular reaction depended upon the ratio of the molecular volume of the metallic oxide to that of the metal. Thus, for values of Md/mD (where M is the molecular weight of the oxide; D, its density; m, the molecular weight of the metal; and d, its density) less than one, the oxide coat is porous or may not adhere to the metal; and a linear law,y : kt + A,
is followed. When this ratio is greater than one, an adherent oxide film is formed, and a parabolic rate law,
y2 :
kt+
A,(2)
(J,)
is followed. In equations (2) and (3) "k" is a constant, and the other symbols are the sare as those in equation (1). Pilling and Bed•mrth
were able to explain these laws on the basis of the fact that the rate-limiting step during the reaction was diffusion of some species in the reaction coat. Recently Wagner and Grunewald (9), Mott (10), and ruley (ll) have proposed similar explanations for these two laws.
Bangham and Stafford in 1925 (12) observed that an empirical rate law,
~ - kt-(1-A)
dt - '
fitted the data obtained when zinc reacted with oxygen at temperatures below 400°C. The extensive investigation of this reaction by Vernon, Akeroyd, and Stroud (13) was reported in 1939 for the temperature range 25° to 400°C. These workers found that a logarithmic law,
w
=
k log(at ~ c),best fitted their data, where w
=
weieht gain due to the oxide film; t=
time; and k, a, and c are constants. For c equal to unity, 1/a equal to A, w equal to y, and l/k equal to b, this law is the same(4)
as that of Tammann and Koster. Thus, the logarithmic law was discovered independently by Tammann and Koster in 1922 and by Vernon, Akeroyd, and Stroud in 1939.
Consequently, the work of Vernon attains considerable importance. The logarithmic law was derived by him on the basis of the following
assump-tions. If N0 is the number of oxygen atmos incident on the outer oxide
surface of a metal per second, a certain fraction p of these will succeed in penetrating the first layer of metal oxide molecules. ~f the same fraction penetrates the second layer of oxide molecules, p N0 atoms are
incident on the third layer, and so on. If at any time t there are n layers of oxide, then the number of oxygen atoms reacting at the metal surface per second equals pnN0 • If this oxygen combines with the metal
to form fresh oxide, the weight-increment per second will be proportional
to pnN0 •
Thus, dw
=
kpnNCit
o•Since
dw _ kpk2w N
=
k' k2w dt - 0 p 'dw
~w
=
ktdt,and integrating w
=
k log(at + c). (5a)Since the condition that w
=
0 when t=
0 requires that c - 1, it followsthat
w
=
k log(at ~1).
(5b)More recently Brodsky and Cubicciotti
(14)
have found that the oxidation of silicon at high temperatures follows the logarithmic law. Theseworkers, following the method of Tammann and Koster, derived the
logarith-mic law from Fick's law of diffusion. This law states that
dw de
ctr
=
nax,
where w
=
amount of diffused substance, c=
concentration of the diffusionspecies at a distance x from the starting point, t
=
time, and D=
the diffusion coefficient. If the diffusion of some species through themanner, the concentration of the diffusing species in the coat will decrease exponentially. Stated mathematically,
where c0 and b are constants. Therefore, the concentration gradient will be
Since the total thickness of the oxide, x, is related to w by a gravi-metric factor (w
=
gx),Integrating,
or
~
=
D~
=
-Dc0be-wb/g.W
=
g/b log(-Dc0b2tjg + c•)w
=
k log(at + c•).The condition that when w: 0, t
=
o,
requires that c' : l. Hence, w=
k log(l + at),which is the logarithmic rate law.
At present, the exact mechanisms of the three oxidation laws are still not well established. However, Evans
(15)
summarized the varioustheories of these rate laws in
1943,
and no major changes have as yet beenproposed.
(1) The Linear Law, y
=
kt + A, occurs when the metals are porous or non-continuo~s or in those casesfalls completely away from the metal as it is forma d. renewed metallic surface is available for reaction.
films formed on
mere the film
Thus, a continually
(2) The Parabolic Law,
y2
=
kt + A, is followed when non-porousfilms possessing ionic and electronic_ conductivity are formed and is
governed
qy
ionic.migration under a potential gradient. ,(3) The Logarithmic Law, y
=
k log(at + c), is followed when theabove conditions for the parabolic law are absent, and is believed to be
due to the migration of interstitial matter through flaw-paths or zones of loose structure in the outer part of the oxide film. Thus, the
actual rate of passage along a given path depends upon the rate of
cross-ing a less pervious inner film of constant thickness and is independent
in the path through the outer film. If such an obstruction occurs,
however, passage along the path in question becomes impossible, and the
chance of obstruction of a given path vdll increase with the film thick-ness. It can be shown that the growth rate will fall off with film thickness in accordance with the logarithmic law.
Pilling and Bedworth (8) first formulated an empirical expression
relating temperature and oxidation rate, but it was soon discarded, since no physical significance could be attached to it. Later Dunn (16)
applied the Arrhenius equation to the oxidation of metals as a function
of temperature. The use of this equation,
d ln w _ -Q _ A -Q/RT dT - RT2 or w - e '
where '"
=
oxidation rate, T=
absolute temperature, and A and Q areconstants, was justified by Dunn's work with several metals.
Arrhenium (17) originally derived this equation starting with the vanrt Hoff equation. In the latter the variation of the equilibrium constant lvith temperature was given as
Since Kc is equal to k/k r, it follows that
d ln k - d ln k1 _ 6E
dT dT -
RT2,
•
( 6)
(7)
(8)
where k and k' are the velocity constants of direct and reverse reactions.
Van't Hoff suggested equation (8) could be split up to give
d ln k
dT
E
=
RT2 +A and d ln k' E'dT RT? "' A, (9)
where E - E' is equal to .4E and A is a constant. It was found experi -mentally that A was equal to zero. Thus,
d l n k _ E
dT - RT2 or ln k
=
-E/RT
+
constant. (J.O)Equation (10) is identical ~ith equation
(6),
where E is the energy of activation. E may be determined by plotting ln k against 1/T and solving for E from the slope, which is equal to -E/R. It is, therefore, possibleThe influence of pressure on the oxidation rate has been studied by several ~TOrkers, but no general laws have been proposed as was the case
with time and temperature. Wilkins (19) suggested the idea of limiting
pressures, both minimum and maximum, outside of which no definite rate
la~v is followed. He proposed that outside of this range the rate would depend on other factors, such as the rate at which the gas molecules are impinging onto the surfaqe, the accommodation coefficient of the gas molecules on the surface, the rate of diffusion of metal ions, the evaporation of gas molecules from the surface, and the mobility of the
absorbed gas molecules on the surface.
IT. EXPERIMENTAT .. INVESTIGATION
A. Apparatus
It was found that the reaction between lithium metal and water vapor could be followed by measuring the pressure increase due to hydrogen in
a closed system. This fact follows from the reaction
2Li + 2H20 --~ 2Li0H •
H2'
-
-which indicates that hydrogen is produced quantitatively. The rate of the
above reaction vJas determined by introducing water into a suitable
evacuated vessel containing lithium metal and measuring the pressure
change due to evolved hydrogen. The apparatus is shovm in Figure 1.
The reaction vessel w~s constructed of 45-mm.-outside-diameter pyrex
tubing and was approximately 15 em. in height. Its volume was about 250 ml. Connected at the bottom of the flask was a water-inlet tube which extended above taper B. At the top of the inlet tube was a serum bottle rubber stopper, covered with a pool of rrercury, through which water could be injected into the system by means of a hypodermic syringe.
The taper B was a 29/26 ground glass joint, the outer member o.f which was
sealed off to s.erve as a cap. A elass hook extended down into the
reaction vessel from inside the cap. The lithium sample could thus be
suspended in the vessel as shmm in the diagram. At C was a 10-mm.
high-vacuum stopcock. This lead to a vacuum pump through a dry-ice trap.
Below stopcock C a recording mercurial manometer F was connected to the system. This manometer, following the design of Svec and Gibbs (18),
was used to measure continuously the total gas pressure in the system.
It consi.sted of a large bulb mercury manometer with a length of resistance
wire (No. 30 Chromel A) placed concentrically in the mercury column. The
resistance wire was included in a direct current bridge circuit, and the
degree of unbal ance of the bridge 1vas follmved with a recording
potentio-meter. Operation of the device required that the bridge first be
balanced when the pressure in the apparatus was zero. Then, as the mercury
column rose due to increasing pressure, the resistance of the concentric
From a sui table calibration curve, chart readings were converted to pressure. A slowly increasinG Gas pressure could thus be followed over a period of several hours.
During any particular experil'!Bnt the entire reaction system was placed in a constant temperature water bath, with the water level being
just up to the vacuum stopcock C (see Figure 1). Included in the bath were a stirring motor, two 750-watt heating units connected to auto transformers, one 250-watt knife-type intermittent heater controlled by a mercury to tungsten thermo-reeulator and relay, a constant level float connected to an overhead water reservoir, and a 0° to 100°C thermometer calibrated in tenths of degrees. The bath could be controlled to
O.Ol°C over a range of 30° to 80°C.
Experiments were carried out to determine the time required for thermal equilibrium to be obtained bet'-veen the lithium and the water bath. This was accomplished by placing the bulb of a thermometer in an aluminum cylinder having the same dimensions as the lithium cylinders used and sealing the cylinder and the thermometer into the reaction apparatus. It was found that with a gas present in the apparatus, thermal equilibrium was reached vlithin 5 to 15 minutes, depending upon the initial temperature difference betr.v-een bath and metal and upon the gas pressure. A relationship was also found for the time of temperature equilibration when the reaction vessel was evacuated. The results of these experiments showed that under any conditions keeping the vessel containing the lithium in the water bath for 30 minutes was sufficient for the metal to attain the bath temperature. Therefore, in all
experiments described in this thesis, 30 minutes were allowed for temperature equilibration of the metal samples before water was intro-duced into the reaction vessel to initiate the metal-water vapor reaction.
B. Procedure
Lithium metal vras obtained from the Metalloy Corp., Minneapolis, Minn., in the form of extruded rods one-half inch in diameter and about 6 inches in length. Spectrogra?hic analysis made by the analytical section of the Ames Laboratory indicated that the total impurities were less than 0.1 per cent, occurring as Al, Ba, Ca, Hg, Mn, and Si.
FOR
lNG
WATER
TO VACUUM
HIGH \aCUUM F
STOPCOCK
VESSEL TO RECORDING POTENTI-OMETER
normally used in the experirents as soon as possible after the machining
operation, it was observed that 1i thium metal stored under these
conditions would maintain its metallic appearance for as long as
24
hours.All handling of the cylinders was by means of rubber-tipped forceps or
surgical gloves which had been dipped in dry turbine oil. This precaution
was necessary to obviate the formation of active centers on the metal
surface.
Immediately preceding the experimental reactions, the dimensions of
the cylinders were measured using machinists• calipe~s. The oil was
re-mi ved, from the lithium using a rinse of sodium-dried' Skelly B followed by
one in sodium-dried diethyl· ether. During this latter rinse operation,
a stainless st~.el hook was fastened to the top of the cylinder, by means
of which it could be hung vertically in the reaction vessel as shown in Figure 1. Apiezon W was applied along the lower part of the inner
member of .taper B, and the vessel was .flushed with argon gas. The lithium
cylinder was attached to the hook connected to the outside member of
taper B, and the latter was placed in position on the· vessel as shown in
Figure l.
Evacuation of the apparatus was begun immediately while the taper and
wax were warmed to insure a vacuum-tight seal. The evacuation was
con-tinued for at least 30~ minutes. During thi,s tire the apparatus was
partially lowered into the water bath to bring the lithium to thermal
equilibrium with the bath. After the .3d-minute interval, stopcock C was
closed and the system lowered the rest
of
the way into the bath. Theposition of the system was· adjusted until the manometer was perfectly
vertical as determined with a spirit level. The chart switch of the
recording potentiometer was turned on, and the potentiometer pen was
zeroed at a chart reading previously selected when calibrating the mano-meter. Two ml. of
an
aqueous solution of lithium chloride were thenintroduced into the vessel through the serum bottle stopper. As the
reaction between water vapor and lithium then proceeded, the pressure
of the hydrogen evolved was recorded. Observations were made at
35.0°,
45.0°,
55.0°,
65.0°,
and75.0°C.
Because two of the rate variables, vapor pressure and temperature, are not independent, a method was needed fo.r varying one and holding the
second variable constant for a set of reactions. The lowering of the
vapor pressure of the water used in the reactions with an electrolyte,
lithium chloride, proved to be satisfactory for the purpose •. It was possible, by the addition of this salt~ to 'lower the vapor pressure of
water to about
40
per cent of that of pure water. One series of aqueoussolutions was prepared having varying vapor pressures at any particular temperature. Other solutions were prepared, by means of which i~ was possible to vary the temperature and maintain a constant vapor pressure. The vapor pressures of these solutions were determined at the various temperatures by introducing 2 ml. of solution into the evacuated system
Table 2
Vapor Pressures of LiCl Aqueous Solutions
Li.Cl cone., Temp •. , Measured v .p., Literature v.p.,
*
gms Li.Cl/100 gms H20 oc. mm. Hg mm. Hg
0 35.0 42.2 42.2
0 45.0 72.5 71.9
20 45.0 52 •. 0
40 45.0 34.0
55 45.0 22.0
0 55.0 118.0 118.04
40 55.0 58.0
55 55.0 39.0
0 65.0 184.0 187 ·~54
55 65.0 58.0
0 75.0 285.0 289.1
55 75.0 100.0
*
Lange, N.A.,
"Handbook of Chemistry, 11 7th ed., Handbook Publishers, [image:19.567.67.505.167.548.2]V. EXPERIMENTAL RESULTS
As each reaction between lithium metal and water vapor proceeded, it was observed that a definite trend was followed. The film formed on the
surface of the cylinder appeared first to be black or very dark and metallic, changing to white as the reaction proceeded. The pressure due to the liberated hydrogen increased slowly, and it appeared that a p rotec-tive coat was being formed. In order to know th~ composition of this coat, samples of lithium r"rith flat surfaces were prepared. They were allowed to react with water vapor in the system as in regular runs. The
black and vJhi te compounds -vrhich formed on the surfaces "lrere then analyzed
by means of a recordinc X-ray diffract0meter. The or.1~r compour"cls of
lithiur1 ::>rc:r-m,t as indicated by the diffraction patterns were LiOH and
a small amount of Li0H•H2
o.
No lines ascribable to oxide or nitride werepresent. Another check on the productr of the lithium-water vapor
reac-tion was an analysis of the gas produced. This was done by allowing the gas in the reaction system afte~ a reaction had been completed to expand
into an evacuated sample bulb. The Hater vapor present in the sample
v.ras frozen out with dry ice, and the remainder vJas analyzed by means of
a mass spectrometer. Only hydrogen was found to be present in the gas
except for a trace of residual water vapor.
Since the reaction of lithium \iith water vapor proceeds with the
formation of a LiOH surface film, the reaction rate data are expected to
fit one of the three gas-solid rate la:.;s stated in equations (2), (3),
or (4). A comparison of these three laws is presented in Figure 2 to
determine which law best describes the data obtained from a t~ical
experiment. The weight of water vapor in mg. reacted per em. of lithium
surface is plotted against the appropriate function of the time. The water-vapor weight values were obtained from hydrogen pressures by
deter-mining the total volume of the reaction system, the volume and surface
area of the lithium cylinders, nnd by then utilizing the ratio of
hydrogen produced to water vapor reacted as determined from the chemical equation involving the reaction of litl-J.ium with water vapor. The hydrogen
pressures were obtained by subtracting the vapor pressures of water at the temperature being studied from the total pressure. It was assumed that the surface areas used for these calculations were only minimum areas and
could well have. had actual values equal to twice those of the calculated areas. This could be due to surface unevenness formed in the machining
process and to the nature of th9 metal. It ~vas assumed, however, that
the true surface areas were proportional to the calculated areas by a
fairly constant factor. This was substantiated by the reproducibility of the data obtained from the experiments. From Figure 2 a straight line is observed for the logarithmic treatment of the data. The curves, concave
upv1ard for the parabolic plot and concave dmvnward for the linear plot,
emphasize the conclusion that a logarithmic rate law is followed. Similar
3
~.
E
u ... 2. 0
~
%
:I
.
A 0 8
c
A -LOGARITHMIC
B -PARABOLIC
C- LINEAR
6 7 B
40 60 T
c
IN HRSJ IN MIN.) IN MIN.)
The value of the constant a in the logarithmic equation was set equal to 0.4 by Brodsky and CUbicciotti (14) in silicon-oxygen reaction rate studies, but its m':lgni tude under the conditions of this research was empirically determined by finding that value which best fitted the
experimental data. Different values of a, ranging from 0.2 to 0.8, were applied in a series of plots involving the weight of water reacted
versus the logarithmic time function. A value of 0.45 provided the best of the straight lines obtained, although the function is relatively insensitive to the value of a.
Graphs were prepared for each reaction with rng. H20 reacted per cm. 2 plotted against log(l + 0.45t), where t is time in hours. Values of the logarithmic rate con~tants k were found as the slopes of the initial part of the curves, where definite straight lines were evident. Table 3 lists the slopes in mg./cm.2-hr. for each run and lists the average slopes at each temperature and vapor pressure. Typical examples of the plots are ffimm in Figures 3 and 4. Figure 3 contains plots of the reaction data obtained using pure water in each case in the temperature range
35.0°
to 75.0°C. It should be noted that with increasing tempera-ture the water vapor pressure is also increasing. Figure 4 showsreactions in the tenperature range 45.0° to 75.ooc. using solutions of
55
gms. LiCl/100 gms. H20 as a SOUIWe of water vapor. While the vapor pressures· of these solutions still increase as the temperatures increase, much lower values for the vapor pressure are· obtained than for pure water. It should be noted that on extending the data in Figures 3 and 4 over a longer time, definite changes or breaks were observed in the slopes of the curves, appearing at a time corresponding to a certain coat thick-ness. These rudden breaks seemed to be dependent on the temperature and pressure, but nothing definite can be said about the rate law after these periods.In order that the vapor pressure effect on the reaction rates might be determined, reactions were run at 45.0°C with varied vapor pressures. Figure
5
shows plots of the data obtained in these experiments. It is clearly indicated that there is a certain pressure below which no further decrease in rate of reaction is observed. This pressure appears to be in the vicinity of50
mm. Hg at 45.0°C. It .can also be observed fromTable
3
that a similar limiting vapor pressure at55.0°C
occurs in the region of 60 mm. Hg. Figure 6 shows the values of the rate constants plotted against temperatures, the la-ver curve being for the55
gms. LiGl/100 gms. H20 solutions and the upper curve being for the reactions,.when~ pure water >vas the source of water vapor. If the limiting
Table
3
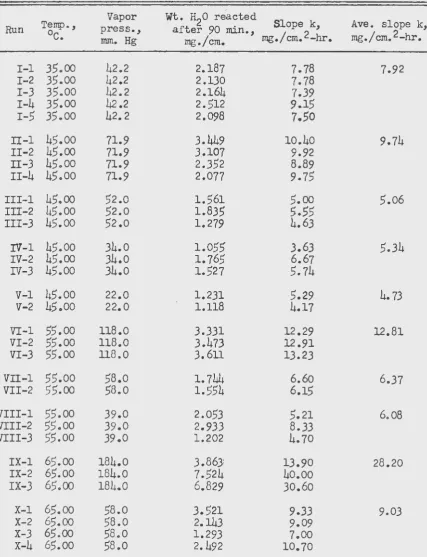
Lithium-water Vapor Reaction Data
Temp.,
Vapor
Wt. H20 reacted Sl
kAve. slope
k,Run
oc.
press.,
a er
f
t
90 ·
~n.,/
ope '
2
mg./cm.2-hr.
mm. Hg
mg./em.
mg. em. -hr.
I
-
1
35.00
42.2
2.187
7.78
7.92
I
-
2
35.00
42.2
2.130
7.78
I-3
35.00
42.2
2.164
7.39
I
-
4
35.00
42.2
2.512
9 •
.
15
I
-
5 35.00
42.2
2.098
7 •
.
5o
II-1 45.00
71.9
3.449
10.40
9.74
II-2 45.00
71.9
3,.107
9.92
II-3 45.00
71.9
2.352
8.89
II-4 45.00
71.9
2.077
9.75
III-1 45.00
52.0
1.561
5.00
5.06
III-2 45.00
52.0
1.835
5.55
III-3 45.00
52.0
1.279
4.63
IV-1 45.00
34.0
1.055
3.63
5.34
IV-2 45.00
34.0
1.765
6.67
IV-3 45.00
34.0
1.527
5.74
V-1 45.00
22.0
1.231
5.29
4. 73
V-2 45.00
22.0
1.118
4.17
VI-1
55.00
118.0
3.331
12.29
12.81
VI-2
55.00
118.0
3.473
12.91
V
I-3
55.00
11
8
.0
3. 611
13.23
VII-1
55
.00
58.0
1.744
6.60
6.37
VII-2
5
5.00
5
8
.0
1.
5
54
6.15
V
III
-
1
55
.00
3
9
.0
2.053
5.21
6.08
VII
I
-
2
55
.00
3
9
.0
2
.933
8.33
VIII-3
55
.00
3
9
.0
1.202
4.70
I
X
-1
65
.00
184.0
3.
8
63
l
13.90
2
8
.20
I
X-
2
65
.00
1
8
4.0
7.524
4o.oo
I
X
-3
65
.00
1
8
4.0
6.
8
29
30.
6
0
X-1 65
.00
58
.0
3.
5
21
9.33
9.03
X-2 65
.00
58.
0
2.143
9.09
X
-3
65
.00
58
.0
1.293
7.00
[image:23.565.71.499.158.716.2]Table 3 (continued)
Temp.~ Vapor Wt. H20 reacted Slope k, ave. slope k,
Run oc. press., after 90 ~n.,
mg./cm.2-hr. mg./em. 2-hr.
nnn. Hg mg./em.
XI-1 7S .oo 285.0 S9.10 61.20
XI-2 75.00 28S.o 63.30
XII-1 7S .oo 100.0 4.348 16.10 14.10
XII-2 7S.oo 100.0 1.891 12.10
extrapolation to 6S.o0c was made. It is slightly more difficult to justify this latter extrapolation, since the pressures are well above So
and 6o mm. Hg. However, the fact that the vapor pressure of water rises
exponentially with temperature and that a sudden deviation is observed in
the graph seems to justify an extrapolation of at least 10 degrees. It is very probable that this pressure-independent region is also bounded at
the lower end at some pressure as has been observed several times in
oxygen-metal studies (6,
8,
and 19), but none of the lithium-water vaporstudies made here were extended to lmv enough pressures to observe this effect.
It was stated that a form of t~e Arrhenius expression, equation
(10), could be used to determine the activation energy for the reaction.
This is accomplished by plotting log k against 1/T and determining the
slope, where k is the rate constant and T, the absolute temperature. E, the activation energy, is equal to -2.303 x R x slope. In order that all
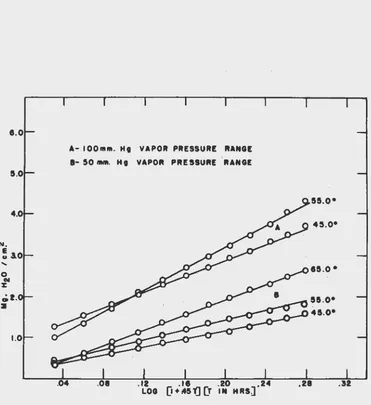
conditions be similar, data from runs at different temperatures, but i.Jith vapor pressures in the same ran:;e, Here used. Figure 7 shows two sets of data for runs which obey the above conditions, one set with vapor
pressures of approximately So mm. of HG and the other set in the 100 mm.
of Hg range. Table 4 lists the necessc1ry values for plotting log k
against 1/T. These plots are shown in Figure 8. It is observed that two straight lines are formed, the slopes of which have similar values.
From Figure 8 values for the activation energy of the reaction bet\.Jeen
[image:24.565.59.497.81.268.2]...
Iu
....
0..
s
..
•
0- 4 !S .0'"
E- 35.0'"
A- 75.
o-FiJ. 4-Logaritbmic plot of the lithium-water vapor data in which 55 p . LiCl/100
""
I·
u
... 3.
0
""
%A
I
c
D
0 0
.08 .11 .1!4
&•
LOG (] + .45
n
(j IN HRSJ.16 .24
A- WATER IOl.UTIOfitS
1- 55giii.UCI/IOOg•.Ha0 SOLUTIONS
0- EXPERIMENTAL VALUES
6- EXTRAPOLATED VALUES
TEMPDATURE , • C.
0 01 % ~2.
a
A-100111111. HI VAPOR PRESSURE RANGE 1-50.111111. HI VAPOR PRESSURE ,RANGE
55.0•
45.0•
Fig. 7-Logaritbmic plot of lithium-water vapor data used 1D calculadai acdvadoa energies.
' ' i '
[image:29.562.113.484.101.506.2]•
!- I.
..
...
=
c
z
0
!
c-0
0
_,
0-EXPUIMENTAL
·-EXTRAPOLATED
100111111. Hg. VAPOR PRESSURE RAN8E
VAPOR PRESSURE
tiT • K
Run
III
VII
X
XII'
II
VI
IX1
Table 4
Lithium-water Vapor Reaction Data for Use in Determining Activation Energy
Vapor pressure, Temp., 1/T., Slope k nun. Hg oA. oA.
52.0 3i8.18 .003143 5.06
58.0
328.18 .003047 6.3758.0
338.18 .0029579.03
348.18 .002872 lLOO*
71.9 318.18 .003143 9.74
118.0 328.18 .003047 12.81
338.18 .002957 16.00*
*Extrapolated values from Figure 6
VI. BIBLIOGRAPHY
Log k
.70424
.80448
.95569
1.94139
.98856
1.10755
L20412
1. vleeks, M. E., "Discovery of the Elements, 11 Journal of Chemical Education, Easton, Pa., 1939, p. 208.
2. Osborg, H., 11Lithium," The Electrochemical Society, New York,
N.
Y.,
1935.3. "Report on Lithium," NEPh 1193-BCR-.53, Atomic Energy Conunission, 1949.
4. Clark, J. D. and Donahey, J. 1rl., Foote Prints ~-~ 7-31 (1950) • .5. Fenton, W. M., Minneapolis, Minn., (Private conununica tion).
[image:31.562.51.502.50.723.2]7. Tammann, G. and Koster, W.,~ anorg. allgem. Chern. 123, 196-224 (1922).
8. Pilling, N. B. and Bedworth, R. E.,
l·
Inst. Metals 29, 529-582 (1923).9. Wagner, C. and Grune~'fald, K., ~· physik. Chern. 40 ~ 455 (1938).
10.. Matt, N. F., ~· Faraday Soc. 36, 472-483 (1940).
ll. Miley, H. A., Trans. Electrochem. ~· 81, 391-411 (194~).
12. Bangham, D. H. and Stafford,
J.,
Nature 115, 83 (1925).13. Vernon,
W
.
H.J.,
Akeroyd, E. I., and Stroud, E. G.,l·
Inst. Metals 65, 301-343 (1939).14. Brodsky, M. B. and Cubicciotti,
n.,
J.
Am. Chern. Soc. 73, 3497-99(1951).
-15. Evans, U. R., Trans. Electrochem. Soc. 83, 335-342 (1943).
16. Dunn, J. S., Proc. Roy. Soc. London~!' 203-219 (1926).
l7. Glasstone,
s.,
"Textbook of Physical Chemistry," 2nd ed.,D. Van Nostrand Company, Inc., New York, N. Y., 1946, p. 1087-91. 18. Svec, H. and Gibbs, D., ~· Sci. Instr. ~ 202-204 (1953).