with special emphasis on leaf lifespan
.
White Rose Research Online URL for this paper:
http://eprints.whiterose.ac.uk/64/
Article:
Osborne, C.P. and Beerling, D.J. (2002) A process-based model of conifer forest structure
and function with special emphasis on leaf lifespan. Global Biogeochemical Cycles, 16 (4).
44-1-44-23. ISSN 0886-6236
[email protected] https://eprints.whiterose.ac.uk/ Reuse
Unless indicated otherwise, fulltext items are protected by copyright with all rights reserved. The copyright exception in section 29 of the Copyright, Designs and Patents Act 1988 allows the making of a single copy solely for the purpose of non-commercial research or private study within the limits of fair dealing. The publisher or other rights-holder may allow further reproduction and re-use of this version - refer to the White Rose Research Online record for this item. Where records identify the publisher as the copyright holder, users can verify any specific terms of use on the publisher’s website.
Takedown
If you consider content in White Rose Research Online to be in breach of UK law, please notify us by
A process-based model of conifer forest structure and function
with special emphasis on leaf lifespan
Colin P. Osborne and David J. Beerling
Department of Animal and Plant Sciences, University of Sheffield, Sheffield, UK
Received 18 September 2001; revised 2 April 2002; accepted 16 May 2002; published 23 November 2002.
[1] We describe the University of Sheffield Conifer Model (USCM), a process-based approach for simulating conifer forest carbon, nitrogen, and water fluxes by up-scaling widely applicable relationships between leaf lifespan and function. The USCM is designed to predict and analyze the biogeochemistry and biophysics of conifer forests that dominated the ice-free high-latitude regions under the highpCO2 ‘‘greenhouse’’ world 290–50 Myr ago. It will be of use in future research investigating controls on the contrasting distribution of ancient evergreen and deciduous forests between hemispheres, and their differential feedbacks on polar climate through the exchange of energy and materials with the atmosphere. Emphasis is placed on leaf lifespan because this trait can be determined from the anatomical characteristics of fossil conifer woods and influences a range of ecosystem processes. Extensive testing of simulated net primary production and partitioning, leaf area index, evapotranspiration, nitrogen uptake, and land surface energy partitioning showed close agreement with observations from sites across a wide climatic gradient. This indicates the generic utility of our model, and adequate
representation of the key processes involved in forest function using only information on leaf lifespan, climate, and soils. INDEXTERMS:1615 Global Change: Biogeochemical processes (4805); 3337 Meteorology and Atmospheric Dynamics: Numerical modeling and data assimilation; 3344 Meteorology and Atmospheric Dynamics: Paleoclimatology; 9609 Information Related to Geologic Time: Mesozoic;KEYWORDS:leaf lifespan, conifer forests, vegetation model, paleoclimate, scaling mechanisms, forest-atmosphere fluxes
Citation: Osborne, C. P., and D. J. Beerling, A process-based model of conifer forest structure and function with special emphasis on leaf lifespan,Global Biogeochem. Cycles,16(4), 1097, doi:10.1029/2001GB001467, 2002.
1. Introduction
[2] The current situation of glaciated polar regions
sur-rounded by sparse, low-stature tundra is unusual in the geologic history of vascular land plants [Frakes et al., 1992]. The plant fossil record demonstrates that tall, productive, conifer forests covered the high latitude land-masses between the Permian and the Eocene, 290 – 50 million years (Myr) ago [Jefferson, 1982; Spicer and
Parrish, 1986, 1990; Spicer and Chapman, 1990; Taylor
et al., 1992]. These ancient polar forests provide tangible evidence for a major poleward advancement of the tree line, and flourished under a high pCO2 [Crowley and Berner, 2001] and a warm, ice-free climate [Frakes et al., 1992], despite extended periods of continuous summer daylight and winter darkness [Read and Francis, 1992;
Beerling and Osborne, 2002]. One of the most intriguing
features of these ecosystems was the distinctive biogeog-raphy of their leaf habit, with a mixture of evergreen and deciduous species in Arctic forests, and evergreens pre-dominating in Antarctica [Falcon-Lang, 2000a, 2000b;
Falcon-Lang and Cantrill, 2000, 2001]. Contemporary
evergreen and deciduous forests alter the seasonal course of vegetation-climate feedbacks, particularly at the regional scale [Bonan et al., 1992; Sellers et al., 1996;Betts et al., 1997;Levis et al., 1999;Douville et al., 2000]. The action of forest feedbacks on climate, through changes in land surface energy, moisture, and momentum fluxes, are espe-cially strong in the mid- to high-latitude regions, and presumably operated in the distant past [Otto-Bliesner
and Upchurch, 1997]. However, paleoclimate modeling
studies have tended to uncouple land-atmosphere energy exchanges from physiological processes and their responses to the global environment.
[3] Just how the polar climate influenced the
biogeog-raphy of these ancient forests [Axelrod, 1966, 1984;
Doug-las and Williams, 1982; Creber and Chaloner, 1985] and
how, in turn, the forests affected regional climates, contin-ues to remain uncertain. Conifer forests are optically darker than other vegetation types, allowing them to absorb more solar radiation, with a greater potential for evaporating water and heating the air and soil [Jarvis et al., 1976]. They are also aerodynamically rougher, enhancing the transfer of mass and energy through increased turbulence. These feedback characteristics therefore represent a
‘‘miss-Copyright 2002 by the American Geophysical Union. 0886-6236/02/2001GB001467$12.00
ing link’’ in palaeoclimate modeling studies [Otto-Bliesner and Upchurch, 1997; Beerling, 2000], which consistently produce high-latitude winter temperatures far below freez-ing [Markwick, 1994; Greenwood and Wing, 1995]. This result is incompatible with corresponding biotic indicators of climate that suggest the existence of mild high-latitude winters [e.g., Markwick, 1994; Greenwood and Wing, 1995].
[4] New techniques in paleobotany [Falcon-Lang, 2000a,
2000b], and novel observations from global-scale plant physiological studies [Reich et al., 1992, 1997, 1998a, 1998b, 1999], now offer the potential to develop a new mechanistic approach for investigating these issues. In the paleobotanical realm, Falcon-Lang [2000a, 2000b] has established an important quantitative technique for deter-mining leaf lifespan from cellular analyses of fossil conifer woods. His approach utilizes the inverse correlation between growth ring markedness (defined as the percentage of late wood and decline in cell size within a given ring) and leaf lifespan across a wide range of contemporary northern
and southern hemisphere conifer taxa. Initial studies on tropical (2 – 13S) Carboniferous gymnosperm woods and high latitude (72S) early-Cretaceous fossil conifer woods indicate evergreen forests in both cases, in agreement with more traditional palaeobotanical approaches [Falcon-Lang and Cantrill, 2001]. Interestingly, leaf retention times of the Antarctic species were estimated to be 5 – 13 years, values approaching the upper limit in modern conifers [Chabot and Hicks, 1982].
[5] Alongside these developments in paleobotany, Reich
et al. [1992, 1997, 1998a, 1998b, 1999] reported, from a
[image:3.610.153.457.66.438.2]global set of observations, that leaf lifespan was strongly related to carbon uptake (by photosynthesis) and loss (by respiration), transpiration, and nutrient content. The rela-tionships between leaf form, function, chemistry, and lon-gevity are remarkably robust and hold for terrestrial plants with contrasting evolutionary and climatic histories [Reich et al., 1997]. In general, longer-lived leaves are mechan-ically tougher [Coley, 1988], have a lower nitrogen content, stomatal conductance, and rates of photosynthesis and
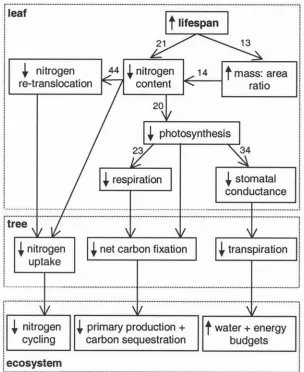
respiration than their shorter-lived counterparts (Figure 1) [Reich et al., 1992, 1998a, 1998b, 1999]. These traits slow ecosystem cycling of carbon and nutrients by leading to high biomass canopies with longer residence times, and by retarding rates of soil nutrient release by litter decomposi-tion (Figure 1) [Schlesinger, 1997]. Collectively, the func-tional interactions between leaf lifespan and key plant traits govern major components of conifer forest ecology and biogeochemistry, and offer great scope for numerically modeling these processes.
[6] Building on this research, we describe a generic
process-based model of conifer forest structure and function (University of Sheffield Conifer model, USCM), which emphasizes leaf lifespan through the fundamental relation-ships reported byReich et al.[1992, 1998a, 1998b, 1999]. The objective of this paper is to examine the hypothesis that a conifer model, using leaf lifespan as the driving physio-logical variable, can explain large-scale distribution patterns of leaf area index and net primary productivity. The work is developed with the long-term research objective of recon-structing high-latitude forests that existed 290 – 50 Myr ago, and their interactions with the greenhouse climate that prevailed at the time.
2. Model Description
[7] Our model focuses on the large-scale implications of
variation in leaf lifespan (Figure 1), and is designed for
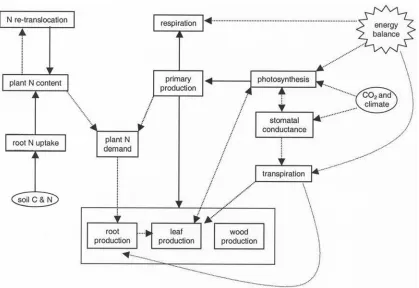
application at scales ranging from local to global, both in the present and geologic past. Four important aspects of forest function and their coupling are considered in relation to leaf lifespan: carbon exchange with the atmosphere, fluxes of water through the soil-plant-atmosphere contin-uum, limitation of growth by nitrogen, and land surface-atmosphere energy exchange (Figure 2 and Table 1). Leaf lifespan is a key input to the model and is integrated so that its impacts on the carbon, nitrogen, water, and energy budgets cascade to progressively larger scales (Figure 1 and Table 1). Inclusion of leaf lifespan and conifer-specific environment responses provide a more direct means of scaling from fossil wood analyses [Falcon-Lang, 2000a, 2000b;Falcon-Lang and Cantrill, 2000, 2001] than might be achieved using generic global vegetation models [e.g.,
Cramer et al., 2001;McGuire et al., 2001].
2.1. Carbon Balance
[8] The net primary productivity of vegetation Pnis the
[image:4.610.97.516.65.353.2]annual balance between net canopy photosynthesis Acand respirationR. Respiration produces the energy for two main groups of processes, and these are divided for the purposes of modeling, although they share a number of biochemical pathways [Amthor, 2000]: first, the maintenance of existing plant tissues via the processes of repair, turnover, acclima-tion, and active transport RM; secondly the growth of leaf bud, root tip, and woody cambium meristems, accounting for energy expended in the nutrient uptake and transport required
to supply these processes [Lambers et al., 1983]. Growth respiration is expressed as the efficiency of dry matter production from fixed carbonYG[Thornley, 1970], giving
Pn¼mCYG X12
m¼1
AcRM
ð Þ; ð1Þ
whereAcandRMare calculated for each monthmto give an annual net carbon balance, andmC converts moles of fixed carbon to mass of sugars.
[9] Net canopy photosynthesis Ac is simulated using a biochemical model of leaf photosynthesis, by treating sunlit and shaded fractions of the canopy as a ‘‘big-leaf’’
[Farquhar et al., 1980; de Pury and Farquhar, 1997].
Photosynthesis is sensitive to canopy temperature, incident solar radiation, and the diffusion of atmospheric CO2 and
O2 into leaves. It is therefore closely coupled with both
canopy energy balance and resistance to gaseous diffusion imposed by stomata (Figure 2). The impacts of leaf life-span on these canopy processes are exerted through its relationship with photosynthetic capacity, respiration rate, stomatal conductance, and the mass:area ratio (Figure 1). The control of photosynthesis and respiration by leaf lifespan operates through its relationship with nitrogen content (Figure 1).
[10] Canopy photosynthesis is the sum of rates for sunlit As and shaded Ash populations of leaves [de Pury and Farquhar, 1997], calculated for each hour of the day h, and summed for the days in each monthd
Ac¼d X24
h¼1
3600ðAsþAshÞ: ð2Þ
[11] The 3600 term integrates Acfrom seconds to hours.
BothAsandAshdepend on the balance between respiration
Rd, and CO2 fixation, which is determined by either
regeneration of the CO2-accepting molecule
Ribulose-1,5-bisphosphate (RubP)Aj, or activity of the primary
carboxy-lating enzyme RubP carboxylase/oxygenase (Rubisco) Av
[Farquhar et al., 1980]
A¼min Av;Aj
Rd; ð3Þ
where ‘‘min’’ denotes ‘‘the minimum of.’’ Rubisco-limited photosynthesis is governed by: the partial pressures of CO2
and O2within the leaf,CiandOi, respectively; the enzyme’s
temperature-sensitive affinities for these gases, KcandKo, respectively [Bernacchi et al., 2001]; and its carboxylation capacity Vc,max, such that
Av¼Vc;max
CiCp CiþKcð1þOi=KoÞ
; ð4Þ
whereCpis the CO2compensation point [von Caemmerer,
2000]. Regeneration of RubP in the Calvin Cycle is limited by light-dependent electron transportJ, so that
Aj¼
J CiCp
4Ciþ8Cp
; ð5Þ
where
J¼ ffiffiffiffiffiffiffiffiffiffiffiffiffiffiffiffiffiffiffiffiffiffiffiffiffiffiffiffiffifQ
1þf2Q2=J2 max
q : ð6Þ
[12] The latter is an empirical function of the electron
transport capacity Jmax, the quantum flux Q of photosyn-thetically active radiation (PAR) absorbed by canopy leaves, and the quantum efficiency of electron transport f. Values of Vc,max and Jmax are closely coordinated [de Pury and Farquhar, 1997]
Jmax¼2:1Vc;max; ð7Þ
[image:5.610.110.504.84.283.2]but each responds independently to canopy temperature [Harley et al., 1992; Walcroft et al., 1997]. In addition to CO2, O2, and climate data, calculation of Ac therefore
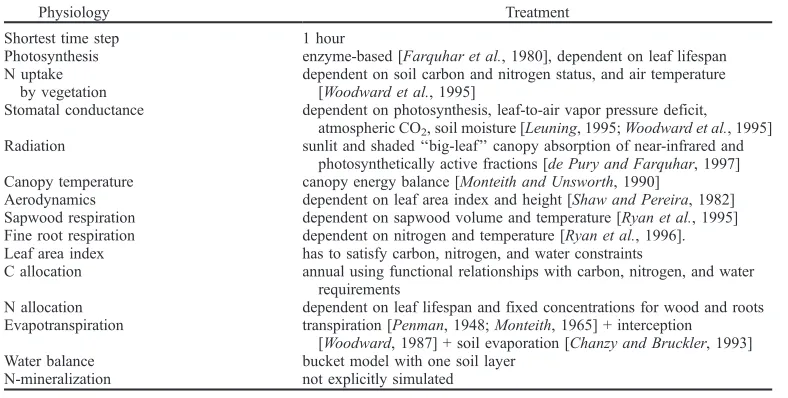
Table 1. Treatment of Ecosystem Physiology in the University of Sheffield Conifer Model (USCM)
Physiology Treatment
Shortest time step 1 hour
Photosynthesis enzyme-based [Farquhar et al., 1980], dependent on leaf lifespan N uptake
by vegetation
dependent on soil carbon and nitrogen status, and air temperature [Woodward et al., 1995]
Stomatal conductance dependent on photosynthesis, leaf-to-air vapor pressure deficit, atmospheric CO2, soil moisture [Leuning, 1995;Woodward et al., 1995]
Radiation sunlit and shaded ‘‘big-leaf’’ canopy absorption of near-infrared and photosynthetically active fractions [de Pury and Farquhar, 1997] Canopy temperature canopy energy balance [Monteith and Unsworth, 1990]
Aerodynamics dependent on leaf area index and height [Shaw and Pereira, 1982] Sapwood respiration dependent on sapwood volume and temperature [Ryan et al., 1995] Fine root respiration dependent on nitrogen and temperature [Ryan et al., 1996]. Leaf area index has to satisfy carbon, nitrogen, and water constraints
C allocation annual using functional relationships with carbon, nitrogen, and water requirements
N allocation dependent on leaf lifespan and fixed concentrations for wood and roots Evapotranspiration transpiration [Penman, 1948;Monteith, 1965] + interception
[Woodward, 1987] + soil evaporation [Chanzy and Bruckler, 1993] Water balance bucket model with one soil layer
requires only an estimate ofQ,Vc,max, andRdfor each of the
sunlit and shaded portions of the canopy.
[13] Canopy absorption of PAR is strongly influenced
by the positioning of leaves, which are aggregated into whorls or clumps in conifers. This aggregation can be represented with a foliage-clumping index (Table 2), to estimate the canopy leaf area that is effective in intercept-ing radiation Le [Chen and Black, 1992] from the actual leaf area index La
Le¼ La
c : ð8Þ
[14] The meanfor ten species (Table 2) is defined as the
ratio ofLetoLa, assessed experimentally using a combina-tion of optical and destructive methods [Chen, 1996]. Vegetation cover c allows for incomplete coverage of the land surface by trees, and is calculated using the methods given byBetts et al.[1997]. UsingLeandc, absorption of PAR by the whole canopyQc, and its sunlitQsand shaded
Qsh fractions, each may be calculated on a land area basis following the study byde Pury and Farquhar[1997]:
Qc¼c ZLe
0
Qbkbsð1rbÞexpðkbsLÞdL
þc ZLe
0
Qdkdsð1rdÞexpðkdsLÞdL; ð9Þ
Qs¼c ZLe
0
QbkbapexpðkbLÞdL
þc ZLe
0
Qdkdsð1rdÞexpfL kð bþkdsÞgdL
þc ZLe
0
Qb½kbsð1rbÞexpfL kð bþkbsÞg
apkbexpð2kbLÞ dL; ð10Þ
and
Qsh¼QcQs: ð11Þ
[15] The canopy extinction coefficients for beam and
scattered PARkbs, diffuse and scattered PARkds, and beam PAR kb, vary with the solar zenith angle q [de Pury and Farquhar, 1997]. Similarly, the canopy reflection coeffi-cients for beam PARrband diffuse PARrddepend onqand
leaf PAR absorptanceap(Table 2) [de Pury and Farquhar,
1997]. We estimate the incident beam Qb and diffuse Qd
PAR using solar geometry and the empirical formulae of
Weiss and Norman [1985], by assuming a well broken low
cloud cover [Lumb, 1964].
[16] The vertical canopy profile of leaf physiological
[image:6.610.59.555.83.360.2]properties is derived from the area-based decline in nitro-gen content Nawith depth in the canopy, and integrated to obtainVc,maxfor sunlit Vsand shadedVshcanopy fractions
Table 2. Core Constants Distinguishing Conifers From Other Woody Speciesa
Constant Value Units Sources
a1, Sensitivity of stomatal conductance to
photosynthesis
28 mol H2O see Figure 3
d1,d2, Empirical descriptors of the stomatal
response to atmospheric vapor pressure
1199, 566 mmol1CO2Pa see Figure 3
gcut, Leaf cuticular conductance 3 mmol H2O m2s1 Korner[1994]
Hr, Activation energy for respiration at 293 K (l, leaves;
s, sapwood;r, coarse and ephemeral roots)
l= 9593;s= 42850; r= 54110
J mol1 Walcroft et al.[1997],
Ryan et al.[1995], andMurty et al.[1996] kM, Rate of decrease in leaf mass-to-area
with canopy area
9.65 . . . see Figure 3
Ns, Sapwood nitrogen content;
Ner, ephemeral root nitrogen content;
Ncr, coarse root nitrogen content
1.8; 10.0; 3.0
mg g1DM
Ryan[1991] and
Gordon and Jackson[2000]
rN, Nitrogen-based root maintenance respiration rate 0.8 nmol CO2mg 1
N s1 Ryan et al.[1996] rv, volume-based sapwood maintenance respiration rate 15.6 mmol CO2m3s1 Ryan et al.[1996]
s1,s2, Empirical descriptors of the stomatal
response to soil drying
0.016;4.27 d’less see Figure 3
smin, Relative stomatal conductance in a dry soil 0.05 d’less Korner[1994]
YG, Growth efficiency (l, leaves;s, sapwood;
r, coarse and ephemeral roots)
l= 0.63;s= 0.68; r= 0.66
g DM; g1CH2O Chung and Barnes[1977],
Carey et al.[1997], and Szaniawski[1981]
ap, Leaf PAR absorptance 0.90 d’less Gates[1979]
an, Leaf NIR absorptance 0.10 d’less Gates[1979]
jr, Ephemeral fraction of roots 0.25 d’less Vogt et al.[1996]
, Canopy clumping factor 0.55 d’less Chen[1996],
Chen and Black[1991], Chen et al.[1991], Fassnacht et al.[1994], andWeiss[2000]
aNotation: CH
[de Pury and Farquhar, 1997]. In a number of contrasting woody species, including conifers, the bulk of the decrease in Na is attributable to a reduction in the leaf mass-to-area ratio, rather than any significant change in nitrogen concentration Nl [Hollinger, 1989;Ellsworth and Reich, 1993; Rambal et al., 1996; Bond et al., 1999]. The leaf mass-to-area ratio M declines at a constant rate with depth in the canopy (Figure 3), from a value in the uppermost leaf positions M0that correlates with Zl [Reich et al., 1999]:
ML¼M0kML; ð12Þ
log 1ð =M0Þ ¼2:430:46 logZl; ð13Þ
whereMLis the value ofMbeneath a leaf area index ofL,
[image:7.610.69.545.68.380.2]andkMis the rate of decrease, derived from observations of three conifer species with contrasting shade tolerance (Figure 3). Equation (12) was fitted by setting M0 to the observed mean value of each species. The canopy profile of
Vc,maxtracks ML
Vc;max¼svVmðM0kMLÞ; ð14Þ
whereVmis the Rubisco carboxylation capacity on a foliage mass basis, and sv accounts for the decline in Vc,maxwith
leaf age. Field evidence from a wide range of conifer species demonstrates a decline in photosynthetic capacity with leaf age, from a maximum shortly after full leaf
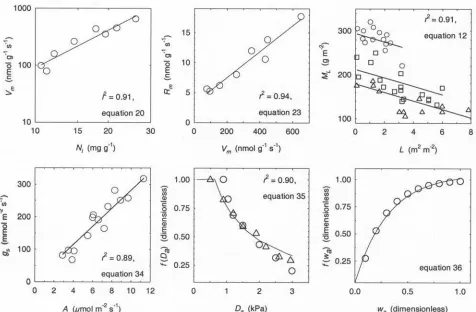
Figure 3. New model functions, based on field observations of contemporary species. The plotted line in each panel was obtained by fitting model equations to the published data shown as symbols. Equation numbers used in the text and ther2for fits are indicated for each. Upper left panel, the dependence of leaf in vivo carboxylation capacityVmon nitrogen contentNl(equation (20)) using mean biome observations fromBeerling and Quick[1995] andReich et al.[1999]. Upper middle panel, the relationship between leaf dark respirationRmandVm(equation (23)), with mean biome observations fromReich et al.[1999]. Upper right panel, the decline in the leaf mass:area ratioMLwith depth into the leaf canopy, as indicated by the overlying leaf area index L (equation (12)): circles, Pinus ponderosa; squares, Pseudotsuga menziesii; triangles, Tsuga heterophylla[Bond et al., 1999]. Lower left panel, the correlation between stomatal conductancegsand net leaf photosynthesisA(equation (34)) in 13 conifer species [Reich et al., 1999]. Lower middle panel, the relative decline in canopy stomatal conductancef(Da) with atmospheric vapor pressure deficitDa(equation (35)) resulting from stomatal closure inPinus pinaster(triangles) and
expansion to a minimum of around zero at leaf abscission [Reich et al., 1995]. This decline may be mechanistically linked with seasonal variation in soil nitrogen availability
[Thornley, 1998]. However, it occurs continuously over
several growing seasons in the case of an evergreen leaf [Reich et al., 1995], and is poorly correlated with nitrogen in some deciduous species [Wilson et al., 2000a], high-lighting important uncertainty in the underlying mechanism. We therefore use the empirical factorsv, and integrate this
important effect to the canopy scale by simulating a single cohort of leaves each year, which emerges from buds located throughout the canopy. For deciduous trees, the canopy Vc,max declines from its maximum value to zero within a single growing season, giving
sv¼
Zlt
ð Þ
Zl
; ð15aÞ
wheretis the time elapsed since leaf budburst. The average canopy value ofsvfor evergreens must account for multiple
cohorts of leaves, each separated by a year in age
sv¼ð1sminÞ Zlt
ð Þ
Zl
þsmin; ð15bÞ
where smin is the minimum canopy value of sv,
immedi-ately before the flush growth of new leaves, given by
smin¼ Zl12
Zl
: ð16Þ
[17] The values ofVsandVshare obtained by integrating
equation (14) for sunlit and shaded canopy fractions as described byde Pury and Farquhar[1997]
Vc¼csv
ZLe
0
VmðM0kMLÞ
½ dL; ð17Þ
Vs¼csv
ZLe
0
VmðM0kMLÞexpðkbLÞ
½ dL; ð18Þ
Vsh¼VcVs: ð19Þ
The value ofVmis calculated fromNl(Figure 3)
logVm¼2:22 logNl3:28: ð20Þ
[18] The close correlation between these variables
(Fig-ure 3) was obtained using paired observations of mean photosynthesis and leaf nitrogen for eight diverse biomes
[Reich et al., 1999], with Vm calculated following the
method of Beerling and Quick [1995]. Since Nl is also correlated with leaf lifespan Zl [Reich et al., 1998a], canopy photosynthesis ultimately depends on this trait (Figure 1):
logNl¼1:570:34 logZl: ð21Þ
[19] Leaf respiration is sensitive to temperature and
strongly inhibited by light [Atkin et al., 2000]. Although
some evidence points to a direct repression of activity in key respiratory enzymes by elevated pCO2, this remains
con-troversial, and is not considered at present [Drake et al., 1999]. Leaf respiration is thus
Rd¼rTrQRa; ð22Þ
whereRaisRdunder standard conditions of temperature and
light. The response of Rdto absorbed PAR rQ follows the
work ofAmthor[1994], and its temperature sensitivityrTis
described by an Arrhenius response with an activation energyHr(Table 2) [Walcroft et al., 1997]. Values ofRafor
sunlit and shaded portions of the canopy are obtained by substitutingVmwith mass-based canopy dark respirationRm
in equations (equations 17 – 19). The relationship between
RmandNl is similar to the correlation between VmandNl
(equation (20)), because the turnover of nitrogen-rich proteins such as Rubisco is metabolically expensive [Reich et al., 1998b;Amthor, 2000]. Without compelling evidence for a shift in the balance between photosynthesis and respiration with leaf lifespan [D. S. Ellsworth, personal communication; Reich et al., 1998b, 1999], we adopted a direct relationship between RmandVmderived from mean observations for eight diverse biomes [Reich et al., 1999] (Figure 3)
Rm¼0:022Vmþ3:1: ð23Þ
[20] This method is supported by a mechanistic link
between the energy requirements of Rubisco turnover and respiratory activity [Penning de Vries, 1975].
[21] Maintenance respiration of non-photosynthetic organs RMoccurs largely in the rootsRr, and living cells of the sap-woodRs
RM¼d Rð rþRsÞ: ð24Þ
[22] Root respiration is sensitive to temperature and
closely correlated with the nitrogen concentration in coarse
Ncr and ephemeral Nerroots (Table 2), because of a tight coupling between nitrogen, protein content, and metabolic activity [Ryan et al., 1996]
Rr¼243600rTrN½NerjrþNcrð1jrÞWr109; ð25Þ
where rN is the sensitivity of respiration to root nitrogen content,Wris the total root mass, andjris the fraction ofWr
comprising ephemeral roots (Table 2). The temperature-sensitivity of root respiration follows an Arrhenius response (Table 2). Field evidence suggests that root respiration is negligible during the period of winter dormancy [Striegl and Wickland, 1998], when physiological activity approaches a minimum. We therefore consider fine root respiration to be zero during leafless periods in deciduous trees.
[23] The maintenance respiration of sapwood is more
closely related to its volumevs, than nitrogen concentration
Ns [Ryan et al., 1995], giving
Rs¼rTrVvs; ð26Þ
the cross-sectional area of sapwood [Osborne and Beerling, 2002].
[24] The growth efficiency YG is insensitive to
environ-mental conditions, but differs between different plant tissue types according to their chemical composition (Table 2). It is weighted byPn
YG¼ X
i
Pi
Pn YGi
; ð27Þ
where the subscriptidenotes leaves, roots, or sapwood, for
PnorYG. The cost of leaf growth increases on an area basis becauseMrises with lifespan (equation (13)), but the mass-based YG remains unchanged [reviewed by Poorter and Villar, 1997]. Field evidence demonstrates that this occurs because a decline in energetically expensive proteins with lifespan is paralleled by a decrease in energetically cheap minerals [Poorter and de Jong, 1999].
2.2. Energy and Water Budgets
[25] Net radiation at the canopynand soilssurfaces is
dissipated by latentlE, sensibleH, and soil Gs heat fluxes [Monteith and Unsworth, 1990]
nþs¼lEþHþGs: ð28Þ
[26] The influx of energy to the canopy from absorbed
PARPc and near infrared radiation (NIR)Nc is calculated using equation (9), with appropriate values for leaf absorp-tance (Table 2). Downward flux of longwave radiation from the skyLdis an additional energy source, which varies with air and cloud temperature [Jones, 1992], and the cloud cover (assumed to be 50%). Longwave radiation is also emitted upward and downward Lc from the canopy, and upward from the soil Ls, tracking the temperature of each according to Stefan’s Law [Monteith and Unsworth, 1990]. Net canopy radiation is thus
n¼PcþNcþLd2LcþLs: ð29Þ
[27] The value of s depends on PAR and NIR
penetra-tion of the canopy, and the extent to which this energy is absorbed by the soil and woody parts of trees, described by the absorptance of each,asandaw, respectively
s¼as½cð1awÞ þð1cÞðPIPcþNINcÞ þLcLs:
ð30Þ
[28] The soil warms during summer, and cools over the
winter following observations [Williams et al., 1992], and we therefore approximateGsas 10% ofs[Clothier et al.,
1986], as an influx in summer and efflux in winter. [29] Latent heat flux from a forest comprises transpiration
by vegetationlEt, evaporation of rainfall intercepted by the leaf canopylEi, and evaporation from the soil surfacelEe.
These are governed by physical properties of the atmos-phere and water, aerodynamic characteristics of the vegeta-tion, and stomatal conductance of the canopy [Penman, 1948;Monteith, 1965]
lEi¼
snþracpgaDa sþg
I >0; ð31Þ
lEt¼
snþracpgaDa sþgga=gW
I¼0; ð32Þ
lEe¼b
ssþracpgfDa sþg
; ð33Þ
whereIis the quantity of precipitationpintercepted by the canopy [Woodward, 1987] and b is the ratio of actual to potential lEe, which increases with soil water content and wind speed [Chanzy and Bruckler, 1993], although the latter tends to be very low at the forest floor [Wilson et al., 2000b]. The aerodynamic conductance for evaporation from the forest floorgf[Jones, 1992] is estimated by assuming a roughness length of 0.01 m [Shuttleworth and Wallace, 1985] and wind speed of 0.4 m s1at 1 m above the ground [Woodward, 1987]. The temperature dependences of s, the rate of change of saturation vapor pressure with tempera-ture;g, the psychrometer constant;ra, the density of dry air;
andDaare accounted for followingJones[1992].
[30] Total canopy conductance to water vapor flux gW
comprises aerodynamic ga and stomatal gs conductance in series, by analogy with Ohm’s Law [Jones, 1992]. Aerody-namic properties of the canopy depend on: tree height; the density of foliage, as represented by La; the characteristic dimension of leaves; and wind speed, assumed to be 20 m s1at 200 m above the ground [Shaw and Pereira, 1982;
Jones, 1992;Woodward et al., 1995]. Stomatal conductance is correlated with photosynthetic rate and leaf lifespan [Reich et al., 1999], and regulated in response to atmos-pheric CO2 partial pressure Ca, Da, and soil water
avail-abilitywa[Leuning, 1995]
gsM¼gcutþ
36:5Cp CaCp
f Dð aÞf wð aÞa1A; ð34Þ
where gsMisgson a molar basis [Woodward et al., 1995],
gcut is the cuticular conductance, and a1 the stomatal sensitivity to photosynthesis (Table 2 and Figure 3). The latter was fitted to paired values ofAandgsobtained from published measurements for 13 species of conifer in four biomes (Figure 3) [Reich et al., 1999]. The stomatal conductance in tree canopies declines with increasing Da, following a well conserved relationship across a range of diverse species [Leuning, 1995;Granier et al., 1996]. This relationship (Figure 3) was fitted to observed values of stomatal conductance [Granier et al., 1996], obtained from sapflow measurements of water flux in two conifer species
f Dð aÞ ¼ d1 d2þDa
; ð35Þ
whered1andd2are fitted constants (Table 2). Chemical and hydraulic signals from the root system also induce stomatal closure in response to soil drying (Figure 3)
f wð aÞ ¼1s1exp½s2wa þsmin; ð36Þ
wheresminis the minimum value off(wa) in the field, while
Values of gsM are calculated independently for sunlit and shaded populations of leaves by coupling with the photosynthesis model, and summed to obtain a whole-canopy conductance for the transpiration model.
[31] The balance between atmospheric pCO2,
photosyn-thetic CO2 demand, and canopy conductance to the gas
gives a value of Ci for sunlit and shaded populations of canopy leaves
Ci¼CaP
1:6A
103g sM
; ð37Þ
wherePis the atmospheric pressure. Air temperatureTaand the canopy exchange of sensible heat H govern Tc in an analogous manner [Monteith and Unsworth, 1990]
Tc¼Taþ H racpga
; ð38Þ
whereHis obtained by re-arranging equation (28)
H¼nþslEGs: ð39Þ
[32] These calculations ofTcandCiallow the coupling of
carbon, water, and energy flux models following a well established approach [Collatz et al., 1991]. Briefly:As and
Ashdepend onCiandTc;gsis sensitive toAsandAsh;nis
a function of Tc; Et is regulated by n and gs; Tc is
determined bynandEt; andCibyAs,Ashandgs.Osborne et al. [2000] describe this canopy-scale coupling in more detail.
2.3. Nitrogen Cycling
[33] The annual demand for nitrogen by vegetationNpis
Np¼103 X
iNiPi; ð40Þ
where the subscripti denotes values for leaves, roots, and sapwood. Re-translocation of the nutrient from senescing leaves to the meristemsNt meets part of this demand, but the remainder must be extracted from the soil by root uptakeNu
NpðNuþNtÞ: ð41Þ
[34] Mineral nitrogen availability is a primary limitation
on plant growth in natural ecosystems because soil reser-voirs are highly mobile, and regulated by the biological mineralization of organic matter [Vitousek and Howarth, 1991]. Increasing reliance on organic nitrogen in mineral-poor soils [Nasholm et al., 1998] reduces rates of plant nitrogen uptake and growth, requiring tighter symbiotic root associations with mycorrhizas [Read, 1990].Nuis therefore regulated by soil availability of the nutrient, and calculated by using soil carbonsCand nitrogensNas indicators of soil organic matter and plant mycorrhizal status [Woodward and Smith, 1994a, 1994b]
Nu¼ X12
m¼1
120dmin 1f ;sN=600gexp 8105sC
jrWr; ð42Þ
Wr¼ Pr Zr
; ð43Þ
where Pris the net annual production of fine roots, andZr
their lifespan. We adopt the approach of Woodward et al.
[1995] in accounting for the temperature-limitation of Nu, and the immobilization of organic matter by freezing.
[35] Re-translocation of nitrogen occurs principally from
leaves, and this nitrogen recovery is correlated strongly with
Nlin both evergreen (equation (44a)) and deciduous (equa-tion (44b)) species [Reich et al., 1992]
Nt¼
12Wl Zl
0:585Nl0:30
½ ; ð44aÞ
Nt¼Wl½0:585Nl0:30; ð44bÞ
whereWlis the total leaf mass, obtained by integratingML
for the canopy Mc
Mc¼ ZLa
0
M0kML
½ dL: ð45Þ
[36] Thus the dependence ofNtonZlmay be both direct
(equation (44a)) and indirect, via its relationship with ML
(equation (13)). Current evidence on the recovery of nutrients from senescent roots is conflicting [Ferrier and
Alexander, 1991; Gordon and Jackson, 2000], and we
have therefore adopted a conservative approach, with no significant root re-translocation [Gordon and Jackson, 2000].
2.4. Vegetation Structure
[37] The leaf area index La is constrained by carbon,
water, and nitrogen. First, Lamust allow shaded leaves at the base of the canopy to maintain a positive annual carbon balance, after accounting for YGl[Woodward et al., 1995]. This carbon limitation ofLais thus dictated by canopy light penetration, leaf photosynthetic, and respiratory capacities. Secondly,Lais regulated so that the annual water consump-tion by plants matches the recharge of soil water by precipitation [Woodward, 1987]
Etot X12
m¼1 pI
ð Þ; ð46Þ
[38] Long-lived leaves are more conservative in their
water-use than short-lived leaves, having lower gs (Figure 1), with the potential to develop larger leaf canopies given the same water availability. Finally, the nitrogen required to produce new foliage must be met by root uptake (equations (41 – 43)); if not, Pl is reduced and Princreased until this condition is satisfied. As with water-use, La tends to increase with leaf lifespan because bothNland the fraction of the canopy replaced each year decline withZl, lowering canopy nitrogen requirements. Additionally, La is con-strained by Pn, which must be sufficient to meet Pl after deductions for roots (equation (48)). Annual leaf production
Pl in evergreen (equation (47a)) and deciduous (equation (47b)) species is
Pl¼
12
Zl
LaML; ð47aÞ
[39] An initial value for net root productionPris set using
a functional approach [Givnish, 1986; Woodward and
Osborne, 2000], by correlation with annual water use by
vegetationEtotusing global observations of a range of forest biomes [Lee, 1997]
Pr¼ Etot
6:03; ð48Þ
and assuming that roots turn over annually, i.e., root lifespan
Zrequals unity, in agreement with observations summarized for the world’s needle-leaved temperate and boreal forests [Vogt et al., 1986]. SinceNu is critically dependent on Wr
(equation (42)) and therefore Pr (equation (43)), the latter must also be sufficient to meet vegetation demand for nitrogen Np, and is increased from its initial value at the expense ofPluntil (equation (41)) is satisfied. This increase inPrrelative toPl(the ratio of root:shoot production) alters the primary limitation of vegetation structure from water supply (equations (46) and (48)) to nitrogen availability and uptake (equations (41) and (42)).
[40] Net sapwood production Ps is the remainder of Pn
(equation (1)) after the growth of rootsPr(equations (43) and (48)) and leavesPl(equation (47))
Pn¼PlþPrþPs; ð49Þ
although a minimum quantity of wood must be produced as twigs to support new foliage. If Ps cannot meet this twig production, forest growth is limited by the availability of fixed carbon, andPlandPrare reduced accordingly.
3. Model Tests
3.1. Leaf Area Index (La)
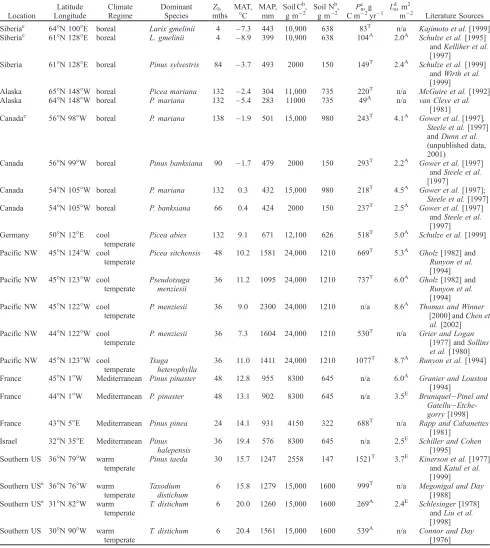
[41] We compiled a database of observations from 23
conifer forests, encompassing a diverse set of climatic regimes and leaf lifespans (4 – 138 months, Table 3), to assess the accuracy of simulated La and Pn. The data set represents a gradient from boreal conifer sites, where mean annual temperatures are extremely low and the growing season is short, through to warm sub-tropical sites in Florida with year-round warmth and high precipitation. It also includes forests in the Pacific Northwest and southern France where rainfall is highly seasonal, being greatest during the winter and limiting in the summer [Mu¨ller, 1982]. At each site, equilibrium model solutions were obtained using inputs of leaf lifespan for the dominant tree species, and soil carbon and nitrogen data (Table 3). To enable accurate simulations of La, we used site-average climatologies (1961 – 1990) [New et al., 1999, 2000], since leaves at the majority of our test sites are retained for several years (Table 3), and canopy structure reflects the cumulative effect of interannual climatic variability.
[42] Simulations ofLaby the USCM for 16 sites generally
show close agreement with observations (Figure 4, r2 = 0.63). The model overestimatesLafor boreal forests domi-nated byPinusspecies on nutrient-poor, free-draining sandy soils in Siberia and Canada (Figure 4 and Table 3). Here, forest stand density is regularly thinned by wildfires, which limit aboveground biomass and cover [Wirth et al., 1999].
Without an explicit consideration of disturbance regimes, we would therefore expect to overestimateLain these ecosys-tems. By contrast, we underestimateLafor sites dominated by a mixture of Pseudotsuga menziesii andTsuga hetero-phylla in the Pacific Northwest (Figure 4). Field observa-tions reveal that foliage in these deep forest canopies is more highly aggregated than in other conifers, with measurements yielding a clumping-index of 0.40, compared with the 0.55 used here (Table 2). Simulations with= 0.40 for these sites increase La in line with observations (Figure 4), markedly improving the regression between simulated and observedLa(Figure 4,r2= 0.88). This suggests that greater accuracy in USCM simulations ofLa for the geologic past might be obtained by estimatingfrom fossil plant remains, particularly its needle-to-shoot area ratio component [Chen, 1996].
3.2. Net Primary Productivity (Pn)
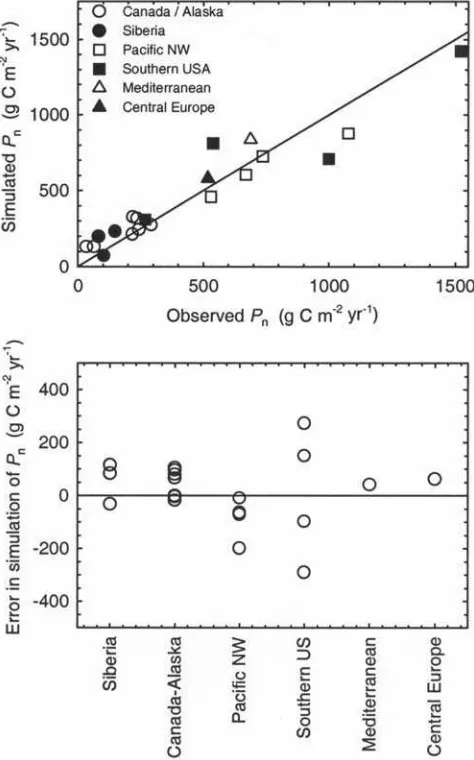
[43] Simulations for Pn used the same leaf lifespan and
soils data as the test forLa, but a climatology for the year matching observations. Across 19 sites, these showed a good correlation (r2= 0.91) with observations (Figure 5), with no major systematic bias apparent across geographical regions or leaf lifespan (Figure 5). Agreement between observations and predictions indicates that the USCM realistically reproduces the interspecific and geographical variation in conifer productivity using only climatic, soil, and leaf lifespan information. We recognize that field observations, especially those of belowground productivity, are subject to significant uncertainty and so this test of our model is imperfect. Nevertheless, the observed errors are comparable to those of process-based vegetation models designed to predict the terrestrial biosphere response to future changes in pCO2, climate, atmospheric nitrogen
deposition, and land use [Cramer et al., 2001;McGuire et al., 2001]. For these models, the published correlations between observed and predicted Pnare:r2= 0.95, n= 15 sites for the Sheffield Dynamic Global Vegetation Model described byWoodward et al.[1995];r2= 0.72,n= 19 sites for the Integrated Biosphere Simulator, IBIS version 1.1 [Foley et al., 1996]; andr2= 0.74,n= 61 sites for Biome3 [Haxeltine and Prentice, 1996].
3.3. Carbon Partitioning, Transpiration, and Nitrogen Budgets
[44] Four intensively studied reference sites in our
data-base, indicated by asterisks in Table 3, were selected for testing plant carbon allocation between leaves, stems, and roots, leaf area index (La), transpiration, and nitrogen uptake. These represent a diversity of leaf lifespans and climatic regimes, including boreal sites in Siberia and Canada, a southern US swamp forest and a site in the maritime Pacific Northwest (Table 3). All data were extracted directly from the sources given in Table 3, except annual ecosystem evapotranspiration which was compiled either from half-hourly average water vapor fluxes measured using eddy covariance [Chen et al., 2002;A. L. Dunn et al., BOREAS CO2flux, temperature, and meteorological data, 2001
Table 3. Sites Used in Model Testinga
Location
Latitude Longitude
Climate Regime
Dominant Species
Zl,
mths MAT,
C MAP,
mm Soil Cb,
g m2 Soil N b
, g m2 Pn
c
, g C m2yr1 La
d
, m2
m2 Literature Sources
Siberiae 64N 100E boreal Larix gmelinii 4 7.3 443 10,900 638 83T n/a Kajimoto et al.[1999] Siberiae 61
N 128E boreal L. gmelinii 4 8.9 399 10,900 638 104A 2.0A
Schulze et al.[1995] andKelliher et al. [1997]
Siberia 61N 128E boreal Pinus sylvestris 84 3.7 493 2000 150 149T 2.4A Schulze et al.[1999] andWirth et al. [1999]
Alaska 65N 148W boreal Picea mariana 132 2.4 304 11,000 735 220T n/a McGuire et al.[1992]
Alaska 64N 148W boreal P. mariana 132 5.4 283 11000 735 49A n/a
van Cleve et al. [1981] Canadae 56
N 98W boreal P. mariana 138 1.9 501 15,000 980 243T 4.1A
Gower et al.[1997], Steele et al.[1997] andDunn et al. (unpublished data, 2001)
Canada 56N 99W boreal Pinus banksiana 90 1.7 479 2000 150 293T 2.2A Gower et al.[1997] andSteele et al. [1997]
Canada 54N 105W boreal P. mariana 132 0.3 432 15,000 980 218T 4.5A Gower et al.[1997]; Steele et al.[1997] Canada 54N 105W boreal P. banksiana 66 0.4 424 2000 150 237T 2.5A Gower et al.[1997]
andSteele et al. [1997] Germany 50N 12E cool
temperate
Picea abies 132 9.1 671 12,100 626 518T 5.0A Schulze et al.[1999]
Pacific NW 45N 124W cool temperate
Picea sitchensis 48 10.2 1581 24,000 1210 669T 5.3A Gholz[1982] and
Runyon et al. [1994] Pacific NW 45N 123W cool
temperate
Pseudotsuga menziesii
36 11.2 1095 24,000 1210 737T 6.0A
Gholz[1982] and Runyon et al. [1994] Pacific NW 45N 122W cool
temperate
P. menziesii 36 9.0 2300 24,000 1210 n/a 8.6A Thomas and Winner [2000] andChen et al.[2002] Pacific NW 44N 122W cool
temperate
P. menziesii 36 7.3 1604 24,000 1210 530T n/a Grier and Logan
[1977] andSollins et al.[1980] Pacific NW 45N 123W cool
temperate Tsuga
heterophylla
36 11.0 1411 24,000 1210 1077T 8.7A
Runyon et al.[1994]
France 45N 1W Mediterranean Pinus pinaster 48 12.8 955 8300 645 n/a 6.0A
Granier and Loustou [1994]
France 44N 1W Mediterranean P. pinaster 48 13.1 902 8300 645 n/a 3.5E Bruniquel
Pinel and Gatellu Etche-gorry[1998] France 43N 5E Mediterranean Pinus pinea 24 14.1 931 4150 322 688T n/a Rapp and Cabanettes
[1981] Israel 32N 35E Mediterranean Pinus
halepensis
36 19.4 576 8300 645 n/a 2.5E
Schiller and Cohen [1995] Southern US 36N 79W warm
temperate
Pinus taeda 30 15.7 1247 2558 147 1521T 3.7E
Kinerson et al.[1977] andKatul et al. [1999] Southern USe 36N 76W warm
temperate
Taxodium distichum
6 15.8 1279 15,000 1600 999T n/a Megonigal and Day [1988] Southern USe 31N 82W warm
temperate
T. distichum 6 20.0 1260 15,000 1600 269A 2.4E Schlesinger[1978] andLiu et al. [1998] Southern US 30N 90W warm
temperate
T. distichum 6 20.4 1561 15,000 1600 539A n/a Connor and Day [1976]
aDetails for each of its geographical location, latitude and longitude, climatic zone, dominant species, leaf lifespan (Z
l), and observations of leaf area
index (La), and net primary productivity (Pn) with literature sources. Climatic and soils data inputs are summarized by mean annual temperature (MAT),
mean annual precipitation (MAP), soil carbon, and nitrogen contents for each. n/a = data not available.
bSoil carbon and nitrogen data from the study ofWoodward and Smith[1994b] orGower et al.[1997, 2000]. c
Productivity values either:Aaboveground growth; orTtotal production.
dLeaf area indices either:Aactual (L
a) determined by destructive or allometric methods; orEeffective (Le) determined by an optical method. e
[45] Simulated partitioning ofPnbetween leaves (Pl) and
wood (Ps) closely matches observations at all four sites (Figure 6). Predictions of root production (Pr) show some discrepancies with observations for sites in Siberia and the Pacific Northwest (Figure 6). For the Siberian site, over-estimation ofPrmay arise because we assume a complete annual turnover, whereas observations suggest root life-spans exceeding 20 years [Kajimoto et al., 1999]. In the case of the Pacific Northwest forests, Pr was determined
[Raich and Nadelhoffer, 1989; Runyon et al., 1994] by
correlation with aboveground litter production for other vegetation types, a procedure likely to introduce some error into the estimate.
[46] We acknowledge that the physiological mechanisms
underpinning carbon allocation in plants are inadequately understood at present [Woodward et al., 1995; Woodward and Osborne, 2000]. However, this model test, undertaken
at the four reference sites, demonstrates that our scheme of medium complexity, based on the functional requirements of leaves and roots [Givnish, 1986], provides a realistic approximation to observations in forests (Figure 6). A similar scheme successfully describes shoot and root allo-cation for forests along productivity gradients at the global scale [Friedlingstein et al., 1999]. We therefore regard it as adequate for our modeling purposes.
[47] At the canopy scale, simulations ofLafor each forest
[image:13.610.60.302.65.403.2]type closely reproduce observations (Figure 6), supporting the general applicability of the relationships between can-opy productivity and leaf area (equations (12) and (13)). Accurate representation ofLain the USCM is important in
Figure 4. Leaf area index La. Upper panel, simulated values are compared to observations in conifer forests from a range of geographical regions, distinguished by different symbols (Table 3). The solid line shows exact agreement, while the dashed line is a regression of simulated values against observations withr2= 0.63. Lower panel, as upper panel, using a clumping factor value of 0.40 for sites where dominant vegetation is a mixture ofPseudotsuga menziesii
andTsuga heterophylla (see text for details). Regression is improved so thatr2= 0.88.
[image:13.610.313.550.247.627.2]simulations of vegetation-climate feedbacks in high-lati-tudes, because it influences albedo, surface roughness, and the partitioning of energy fluxes at the land surface. Evap-otranspiration is also important in this context, integrating the effects of canopy structure, climate, and stomatal physiology. For this variable, simulated values for all sites fall within the 20% range of uncertainty inherent in eddy covariance measurements (Figure 6), arising from missing data, instrument error, variation in the terrain, and meteoro-logical conditions [Goulden et al., 1996; Moncrieff et al., 1996].
[48] Nitrogen availability for growth, the sum of root
uptake, and re-translocation from senescing tissues, is well described by the USCM (Figure 6), and is important because it frequently limits productivity in conifer forests [Bonan and van Cleve, 1992;Schulze et al., 1999]. Some of the small differences between predicted and observed nitro-gen fluxes may be associated with the assumption of constant nitrogen concentrations for roots and sapwood (Nrand Ns, Table 2). It is possible that errors in observa-tions, caused by the difficulty in estimating nitrogen re-translocation from long-lived foliage, also contribute to this discrepancy [Gower et al., 2000].
3.4. Partitioning of Energy Fluxes
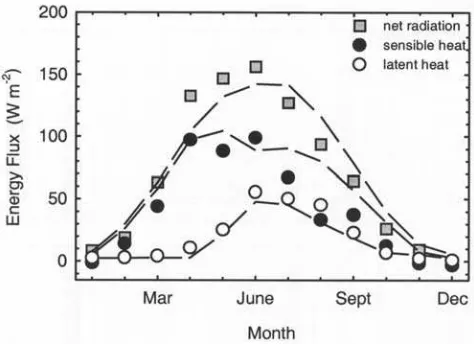
[49] Realistic representation of energy exchange between
the forested land surface and the surrounding atmosphere is an essential component of the biogeophysical effects of vegetation on climate [Bonan et al., 1995], and therefore an important element of the model to examine. We tested predictions of the land surface energy balance over the
boreal landscape, and its partitioning between fluxes asso-ciated with evapotranspiration (latent heat), sensible heat, net radiation, and soil heat flux, with data reported from the Boreal Ecosystem-Atmosphere Study [Sellers et al., 1995; A. L. Dunn et al., unpublished data, 2001]. Although other sites have also been subject to similar intensive measure-ment campaigns, these data are not yet available. For this test, the USCM was forced with observations of monthly climate (temperature, precipitation, and humidity). It repro-duces with reasonable accuracy the seasonal course of net radiation, latent, and sensible heat fluxes shown by field measurements for the Canadian boreal forest (Figure 7). Moreover, the magnitude of all three terms is in general agreement with observations, indicating a suitable treat-ment of the land surface energy balance. Since we have independently validated predictions of canopy structure and transpiration (Figure 6), this result supports our scheme for energy balance, canopy aerodynamics, and conductance. 4. Model Sensitivity Analyses
4.1. Northern Hemisphere Simulations of Leaf Area Index (La) and Productivity (Pn)
[50] We evaluated the effects of leaf lifespan on northern
hemisphere patterns ofLaandPnto assess the sensitivity of the USCM to large-scale variation in climate and soil properties. Analyses were restricted to the northern hemi-sphere because it encompasses the most extensive distribu-tions of contemporary conifers [Olson et al., 1983]. Simulations were performed with leaf lifespans of 6 months (deciduous habit) and 120 months (evergreen habit),
[image:14.610.68.545.69.317.2]senting the extremes shown by modern conifers (Table 3). The results are not intended to reflect actual or potential contemporary vegetation patterns, which are determined by climatic extremes and competition between life forms [Woodward, 1987]. Instead they allow assessment of model sensitivity for contrasting lifespans to a wider range of climate and edaphic conditions than represented by the reference sites (Table 3). We forced the model with inter-polated sets of global climate observations averaged for the period 1961 – 1990 [New et al., 1999, 2000], an atmospheric
pCO2of 35 Pa and soil carbon and nitrogen contents from
an interpolated global data set [Global Soil Data Task, 2000].
[51] Figure 8 displays the broad-scale geographical
pat-terns ofPnandLaresulting from the prescription of two leaf lifespans throughout the Northern Hemisphere. These reflect climatic variations (precipitation, humidity, and land surface temperature) and differences in soil nutrient avail-ability, and are in general agreement with the simulations of global vegetation models [Woodward et al., 1995;Foley et al., 1996; Cramer et al., 1999], indicating consistency between the alternative approaches.
[52] Trees with short-lived leaves show greater variability
in La than those with longer-lived leaves (Figure 8), because they have a higher nitrogen and carbon cost of annual canopy replacement (equations (41) and (47a)), making La more sensitive to climate and soil nutrient uptake. Despite this, the deciduous habit leads to a
margin-ally greater La (by 1 – 1.5 m2 m2), by achieving higher photosynthetic rates under temperate conditions with adequate water and soil nutrients. Two exceptions to this general trend are apparent. First, in high-latitudes, where low temperatures limit soil nutrient supply and the length of the growing season. Secondly, in the dry tropics typical of modern savannahs and steppe vegetation [Mu¨ller, 1982], where the long leaf lifespan achieves a higher La than its shorter-lived counterpart because its stomatal conductance to water vapor are lower (Figure 1) and water-use is more efficient.
[53] Simulated spatial patterns ofPnfor leaf lifespans of 6
and 120 months are similar and tend to track those of La
(Figure 8). The shorter lifespan results in a higherPn(by up to 200g C m2yr1) because higher leaf nitrogen contents (equation (21)) lead to higher maximum photosynthetic rates (equation (20)), when soil nitrogen content is adequate for the annual demand. As for La, the exception to these trends occurs in the high latitudes, but is more extensive in low latitude areas throughout equatorial South America and Africa, as well as southern and southeast Asia (Figure 8). Evergreen vegetation is more productive in these aseasonal, moist tropical regions because the capacity of deciduous trees to exploit the environment is constrained by a short leaf lifespan. All of these differences follow the well-characterized global ecological contrasts between evergreen and deciduous trees [Chabot and Hicks, 1982; Schulze, 1982; Hollinger, 1992], indicating that the USCM may be of use for investigating the climatic and edaphic controls on the leaf habit of modern vegetation.
4.2. Sensitivity to Atmospheric CO2, Climate Warming, and Solar Energy
[54] Our model has been designed for analyzing polar
forest biogeography and biogeochemistry between 290 and 50 Myr ago. It should therefore include appropriate sensi-tivity to a variety of past environmental conditions. Critical among these are CO2, climate, and solar energy, which
influence plant processes from the scale of individual leaves to whole ecosystems [Beerling, 1994, 1997, 2000]. Long-term carbon cycle models [Berner and Kothavala, 2001] and isotopic evidence from fossil soils [Ekart et al., 1999] indicate pCO2 levels several times higher than
current ambient during past greenhouse episodes [Crowley
and Berner, 2001]. Additionally, many of these episodes
are characterized by intense volcanic activity resulting from continental rifting. Volcanism itself exerts an influence on atmospheric CO2in the short-term [McElwain et al., 1999; Jones and Cox, 2001; Beerling, 2002], and on the quality of incoming solar radiation, as seen following the ejection of aerosols by the eruptions of El Chichon in 1982 and
Figure 8. (opposite) Sensitivity of simulated leaf area index (La) and net primary productivity (Pn) to leaf lifespan and the geographical variations in climate and soils. Maps are polar projections of model simulations for the northern hemisphere made using climatic data fromNew et al.[1999, 2000] and soils from theGlobal Soil Data Task[2000]. Upper left panel,La
[image:15.610.61.298.69.241.2]for a leaf lifespan of 6 months; upper right panel,Pnfor a leaf lifespan of 6 months; middle left panel,Lafor a leaf lifespan of 120 months; middle right panel,Pnfor a leaf lifespan of 120 months; lower left panel, the difference in Labetween simulations for 6 and 120 months; lower right panel, the difference inPnbetween simulations for 6 and 120 months. In the lower panels, positive numbers indicate higher values for the 6 than the 120 month leaf lifespan simulation, while negative numbers indicate lower values.
Mount Pinatubo in 1991 [Olmo et al., 1999]. Instrumental records showed attenuation of direct, and enhancement of diffuse, solar radiation, and a peak global cooling of 0.4 K after the Pinatubo eruption [McCormick et al., 1995]. Coupled ocean-atmosphere climate simulations of this event, with an interactive carbon cycle, indicate an impact of the cooling on the terrestrial biosphere, with significant net uptake of carbon by ecosystems in the tropics, but no major variations in oceanic carbon cycling [Jones and Cox, 2001].
[55] We therefore performed a series of model
experi-ments assessing the sensitivity of Pnat our four reference sites (Table 3) to a rise in atmosphericpCO2from 30 to 100
Pa, a range representing variations over the past 100 Myr [Ekart et al., 1999;Berner and Kothavala, 2001]. At each site, three experiments were performed to simulate episodes of global warming and volcanism: ‘‘control,’’ using unmodified climate; ‘‘warming,’’ with a 4.8 K rise in mean monthly temperature; ‘‘warming’’ + an ‘‘aerosol’’ term, defined from observations [Olmo et al., 1999] as a 10% reduction in direct and 33% enhancement of diffuse solar radiation. This change in the quality of solar radiation has little impact on total radiation, which changes by less than ±5% depending onq. The 4.8 K warming is equivalent to the radiative forcing effect from an increase inpCO2to 100
Pa, calculated according to the method described by
Kotha-vala et al. [1999]. Reductions in temperature following
volcanic eruptions have not been investigated in this sensi-tivity analysis because they are within the range of uncer-tainty for paleotemperature proxies [Crowley and North, 1991].
[56] A rise in atmosphericpCO2increasesPnin an
asymp-totic manner at all sites (Figure 9). However, the asymptote differs between sites, with stimulation ofPnbetween 35 and 60 PapCO2of 28% in the southern US forest, 38% in Siberia,
45% in the Pacific Northwest, and 56% in Canada (Figure 9). In support of the predicted Pnincrease for the southern US forest, we note that DeLucia et al. [1999] reported a 25% stimulation in a young Pinus taeda plantation in the Duke Forest after two years’ free-air CO2 enrichment to 56 Pa.
With a warming,Pnincreased further for any givenpCO2at
all sites (Figure 9). As yet, no information has been reported from similar experiments with CO2enrichment and warming
applied together, but other vegetation modeling studies sup-port our findings for boreal conifer forests [Beerling et al., 1997;White et al., 2000].
[57] In the USCM, the CO2response ofPnis mediated by
the net effect of several interacting factors. Rising pCO2
[image:17.610.67.548.68.359.2]competitively inhibits the oxygenase activity of Rubisco and relieves substrate limitation of photosynthesis [Drake et Figure 9. Sensitivity of simulated net primary productivityPntopCO2, elevated air temperature, and a
al., 1997]. The stronger increase ofPnwithpCO2at higher
temperatures results from the synergistic interaction of these environmental variables on the photosynthetic system [Long, 1991]. A feedback also operates between the stim-ulation ofPnbypCO2and carbon allocation to roots. AsPn
increases, there is an associated rise in the demand for nitrogen, which is met by a proportional increase in root growth (equations (42) and (43)). This allocation of carbon to roots, away from leaves and wood, offsets the CO2
enhancement of Pn, because of their high maintenance respiration costs and turnover.
[58] CO2-saturated Pnvalues for all but the southern US
site are constrained by the mean annual temperature (Figure 10), highlighting the significance of synergism between pCO2 and temperature. Imposition of warming
in our model simulations shifts the CO2-saturated Pn so
that all follow a common trajectory given the prescribed soil characteristics, matching experimental evidence [ Rus-tad et al., 2001]. At the southern US swamp forest site, annual demand by the deciduous canopy for nitrogen in high pCO2 outstrips the rate of uptake from the
carbon-rich soil, where the decomposition of organic matter is retarded by a high water table [Schlesinger, 1978]. When this constraint is alleviated, CO2-saturated Pn rises to
conform with the temperature-limited rates of other sites (Figure 10), demonstrating the importance of coupling the above- and below-ground nitrogen cycles [cf. Bonan and van Cleve, 1992].
[59] The simulated effect of an increase in diffuse relative
to direct radiation was typically an enhancement of Pn
(‘‘warming + aerosols,’’ Figure 9), due to enhanced and more uniform light penetration into the leaf canopy, result-ing in more efficient photosynthetic CO2uptake [Roderick
et al., 2001]. This increase in Pn could strengthen the
terrestrial carbon sink following volcanic eruptions, with
an effect on the atmospheric CO2record [Roderick et al.,
2001], and occurs in addition to the large decline in global respiration and smaller decrease in tropical gross primary production induced by surface cooling [Jones and Cox, 2001; Rustad et al., 2001]. For the Pacific Northwest site, enhancement of diffuse radiation increasesLaby 1 m2m2 across all pCO2 values, leading to higher maintenance
respiration costs of this already deep canopy under the mild winter climate of the region, and a net decrease in Pn
(‘‘warming + aerosols,’’ Figure 9).
[60] At present, the simulated response of Pn to these
environmental perturbations excludes any feedback between plant litter and soil nutrient status [Bonan and van Cleve, 1992], a feature shown to be important in CO2-enrichment
experiments with conifer forests [Oren et al., 2001]. Changes in Pn and leaf lifespan affect the quantity and quality of surface litter and roots, key controls over rates of nutrient cycling through their effects on soil organic matter dynamics [Raich et al., 1991;Schlesinger, 1997;Parton et al., 1998]. Leaf lifespan is strongly linked with the rate of decomposi-tion because trees with long-lived foliage produce recalci-trant litter, slowly releasing nutrients over long periods and ultimately generating a nutrient-poor soil. Leaves with a long lifespan are well adapted for such a soil, and their persistence is encouraged via this positive feedback [Aerts, 1995]. A major future development of our model will therefore be its coupling with a model of soil carbon and nitrogen dynamics [e.g.,Raich et al., 1991;Parton et al., 1998].
5. Conclusions
[61] Ever since the important recognition, nearly a century
ago, that the polar regions were once covered by forests [Halle, 1913; Nathorst, 1914; Seward, 1914] debate has continued regarding the nature of their interaction with climate, especially survival during the mild, dark polar winters of the Mesozoic [Douglas and Williams, 1982;
Chaloner and Creber, 1989]. Furthermore, the question of how the biogeochemical and biophysical characteristics of these unusual forests influenced regional climate in an ancient high CO2 ‘‘greenhouse’’ world remains uncertain.
To address these issues in a predictive, quantitative manner, we designed a process-based model of conifer function and structure, emphasizing the influence of leaf lifespan and its interactions with the environment.
[62] Overall, a wide range of simulated vegetation
proper-ties validated well against observations from different taxonomic groups (Abies,Larix,Picea,Pinus,Pseudotsuga,
Taxodium,Tsuga) with varying geographical ranges [Olson et al., 1983], indicating adequate representation of conifer functioning. We recognize that uncertainty exists regarding whether the plant-environment relationships seen in modern conifers are applicable to those growing in the distant past. However, the discovery of general leaf trait relationships across diverse terrestrial ecosystems, for plants with differ-ent evolutionary histories [Reich et al., 1997], provides the most secure basis yet for dealing with this issue.
[63] The model can be used in a stand-alone mode to
[image:18.610.62.298.69.235.2]reconstruct polar forest properties at specific sites, based on leaf lifespan estimates from fossil woods [Falcon-Lang Figure 10. Relationship between CO2-saturated net