White Rose Research Online URL for this paper:
http://eprints.whiterose.ac.uk/1407/
Article:
Rees, M., Kelly, D. and Bjørnstad, O.N. (2002) Snow tussocks, chaos, and the evolution of
mast seeding. American Naturalist, 160 (1). pp. 45-59. ISSN 0003-0147
https://doi.org/10.1086/340603
eprints@whiterose.ac.uk https://eprints.whiterose.ac.uk/
Reuse
Unless indicated otherwise, fulltext items are protected by copyright with all rights reserved. The copyright exception in section 29 of the Copyright, Designs and Patents Act 1988 allows the making of a single copy solely for the purpose of non-commercial research or private study within the limits of fair dealing. The publisher or other rights-holder may allow further reproduction and re-use of this version - refer to the White Rose Research Online record for this item. Where records identify the publisher as the copyright holder, users can verify any specific terms of use on the publisher’s website.
Takedown
If you consider content in White Rose Research Online to be in breach of UK law, please notify us by
Snow Tussocks, Chaos, and the Evolution of Mast Seeding
Mark Rees,1,*Dave Kelly,2 and Ottar N. Bjørnstad3
1. Biological Sciences and Natural Environment Research Council Centre for Population Biology, Imperial College, Silwood Park, Ascot, Berkshire SL5 7PY, United Kingdom;
2. Department of Plant and Microbial Sciences, University of Canterbury, Christchurch 8001, New Zealand;
3. Departments of Entomology and Biology, Pennsylvania State University, University Park, Pennsylvania 16802
Submitted October 26, 2001; Accepted January 10, 2002
abstract:One hitherto intractable problem in studying mast seed-ing (synchronous intermittent heavy flowerseed-ing by a population of perennial plants) is determining the relative roles of weather, plant reserves, and evolutionary selective pressures such as predator sati-ation. We parameterize a mechanistic resource-based model for mast seeding inChionochloa pallens(Poaceae) using a long-term individ-ually structured data set. Each plant’s energy reserves were recon-structed using annual inputs (growing degree days), outputs (flow-ering), and a novel regression technique. This allowed the estimation of the parameters that control internal plant resource dynamics, and thereby allowed different models for masting to be tested against each other. Models based only on plant size, season degree days, and/ or climatic cues (warm January temperatures) fail to reproduce the pattern of autocovariation in individual flowering and the high levels of flowering synchrony seen in the field. This shows that resource-matching or simple cue-based models cannot account for this ex-ample of mast seeding. In contrast, the resource-based model pulsed by a simple climate cue accurately describes both individual-level and population-level aspects of the data. The fitted resource-based model, in the absence of environmental forcing, has chaotic (but often statistically periodic) dynamics. Environmental forcing syn-chronizes individual reproduction, and the models predict highly variable seed production in close agreement with the data. An evo-lutionary model shows that the chaotic internal resource dynamics, as predicted by the fitted model, is selectively advantageous provided that adult mortality is low and seeds survive for more than 1 yr, both of which are true forC. pallens. Highly variable masting and chaotic dynamics appear to be advantageous in this case because they reduce seed losses to specialist seed predators, while balancing the costs of missed reproductive events.
* E-mail: m.rees@ic.ac.uk.
Am. Nat. 2002. Vol. 160, pp. 44–59.䉷2002 by The University of Chicago. 0003-0147/2002/16001-0004$15.00. All rights reserved.
Keywords: synchrony, predator satiation, resource matching, seed bank, time-series analysis.
Mast seeding—synchronous highly variable seed produc-tion among years by a populaproduc-tion of perennial plants (Jan-zen 1971; Kelly 1994)—is a widespread, much discussed, but still puzzling phenomenon. Questions still remain at both the evolutionary and mechanistic levels. From an evolutionary viewpoint, mast seeding carries certain in-escapable costs. Principal among these are higher density-dependent mortality (e.g., Hett 1971), lost opportunities for reproduction (Waller 1979), and lower population re-productive rates. Therefore, to counter these costs, we should expect to find some economy of scale, which makes occasional large reproductive efforts more efficient than smaller more regular efforts (Norton and Kelly 1988). In-triguingly, however, while masting is prevalent in nature, the null hypothesis that there is no evolutionary benefit from masting but plants merely mirror fluctuation in the environment (Busgen and Munch 1929) has proved hard to refute. This null hypothesis (also known as resource matching [RM]; Kelly 1994) posits a link between re-sources available to plants each year (determined by fa-vorable conditions such as warm, sunny, moist weather) and flowering effort in that year. The difficulty in refuting RM is that adaptive explanations of masting may require some cue from the environment to synchronize repro-duction among plants (although synchronization through pollen limitation is a possible alternative; Satake and Iwasa 2000). The best candidate cues are weather variables that correlate with resource abundance and primary produc-tion (Norton and Kelly 1988).
Mast seeding is also puzzling on a mechanistic level. The problem is to understand how plants can vary their reproductive effort widely among years in a synchronized way across individuals. The variation in population-level reproduction (as measured by the coefficient of variation [standard deviation/mean] of total population flowering or seed crop, CVp) is affected by both the variation among
years by each individual plant (the CV for each plant, CVi)
and the synchrony among plants, S (Herrera 1998). For plants to increase their CVi, some form of internal resource
then expended in large intermittent flowering efforts (Jan-zen 1971). Flowering is reduced or absent in the years following the depletion of individual’s energy reserves until resources are built up again. Previous findings of negative lag 1 or 2 autocorrelations in seed production time series (Norton and Kelly 1988; Sork et al. 1993; Koenig et al. 1994; Koenig 1999) suggest that internal resource dynam-ics are important in nature, yet as discussed above, evi-dence is equivocal.
Several recent articles have modeled the internal re-source dynamics of plants to understand masting dynamics (Yamauchi 1996; Isagi et al. 1997; Satake and Iwasa 2000). Internal resource dynamics can produce high variability in individual reproductive output (i.e., high CVi) if
in-dividuals deplete a large proportion of their resources upon deciding to reproduce (Isagi et al. 1997; Satake and Iwasa 2000). However, this type of overcompensatory in-ternal dynamics cannot synchronize the behavior of dif-ferent individuals as required, for instance, to satiate pred-ators. To induce the type of synchrony seen in many masting species, one of two additional mechanisms may be invoked: first, synchrony arises from each plant re-sponding to a common weather cue (note that this can either be incidental synchrony, as in the resource-matching hypothesis, or entrainment on a weather cue as a result of selection under an economy of scale); or second, syn-chrony arises as a consequence of internal resource dy-namics interacting with pollen limitation (Satake and Iwasa 2000). To test what conditions are necessary to pro-duce pronounced masting (high CVpand high synchrony),
we thus consider three possible combinations of factors; the first is cueing or resource matching—reproduction is related solely to a cue or some measure of the quality of the environment (Busgen and Munch 1929). There is no requirement for internal resource dynamics to exaggerate reproductive variation. The second is cueing plus energy stores—reproduction is dependent on cueing or resource matching but also dependent on the energy stores of the plant. The third is pollen coupling plus energy stores—reproduction is dependent on the energy stores and is synchronized through pollen coupling (Isagi et al. 1997; Satake and Iwasa 2000).
In this article, we analyze time-series data to test the factors responsible for the masting behavior of the grass Chionochloa pallens. This species from the alpine zone in New Zealand is one of the most dramatic mast-seeding plants (Kelly et al. 2000). The task of understanding its reproductive ecology is simplified by previous studies of wind pollination in this species showing almost no effect of flower crop on seed set (Kelly and Sullivan 1997; Tisch and Kelly 1998; Kelly et al. 2001). Therefore, the pollen-coupling model is not relevant, and the question becomes the relative roles of resource tracking and internal resource
dynamics in the masting behavior. Our task, as well as that of most other masting studies, is complicated by the fact that the internal energy state of individuals is not measured. In order to address the masting dynamics, we therefore develop new methods to reconstruct the internal resource state of individuals, as well as fitting theoretical resource-based models to time-series data on flowering. These methods are likely to prove useful for understanding the factors responsible for masting by other plant species with variable reproduction.
Methods
Biology of Chionochloa pallens
Chionochloa pallens(Poaceae) has a number of advantages as a model system for masting. Plants are long-lived and show extremely variable flowering, yet plants are small enough for complete flower counts to be readily and ac-curately performed. Flowering is strongly correlated with a simple climatic cue, the effects of masting on predator satiation and pollination efficiency are well understood, and good individual plant-level data sets exist.
The genusChionochloaincludes 22 species endemic to New Zealand, most of which are alpine tussocks (bunch-grasses), which variously dominate the vegetation in mountainous regions above the tree line (Connor 1991). For general background to the ecology of the genus and details on their mast-seeding behavior, see Mark (1969), Mark and Dickinson (1997), and Kelly et al. (2000). Most species, including C. pallens, grow as individual tufts around 0.5–1.5 m tall and 15–50 cm in basal diameter. Individuals are discrete with no evidence of rhizomatous spread (Connor 1991) and are very long-lived (1100 yr). Each plant consists of hundreds to thousands of long-lived tillers, each of which grows vegetative leaves for some years before optionally producing a single inflorescence (culm). In a heavy flowering year, a single plant can have hundreds of flowering tillers. The tiller dies after flowering but usu-ally first produces a lateral offshoot to replace itself. This new tiller is not competent to flower for perhaps 3–5 yr depending on resource levels, but even in the heaviest flowering years only a small percentage of tillers (!20%) are consumed by flowering, so a shortage of competent tillers should not limit flowering. However, heavy flow-ering years do deplete the plant’s stores of nonstructural carbohydrates (Payton and Brasch 1978).
Levels of flowering at the population level vary ex-tremely widely from year to year, with 16 published data sets from 11Chionochloaspecies having CVp(using sample
among sites, both within and betweenChionochloaspecies (Kelly et al. 2000). Flower bud initiation is triggered by warm temperatures in the austral summer (January or January to February) the year before flowering; floral buds are recognizable by April, and inflorescences elongate the following December (Mark 1965b, 1968, 1969; McKone et al. 1998, 2001; Kelly et al. 2000). Anthesis occurs around January (McKone et al. 2001). Like other grasses, Chio-nochloa species are wind pollinated, and all eight tested species (includingC. pallens) are self-compatible (Connor 1967; McKone et al. 1997). Seeds take about 6 wk to ripen, and the dry, gravity-dispersed single-seeded caryopsis is shed before winter.
There has been little work on the size of the persistent seed bank inChionochloaspp. Spence (1990) buried to a depth of 1 cm seeds ofChionochloa macracollected during a very low flowering year and found that only 6% were still dormant and viable 1 yr later, whereas 75% had ger-minated. In contrast, Mark (1969) reports that seeds of Chionochloa rigida had an initial flush of germination (20% in the first 50 d) followed by intermittent germi-nation over a period of about 4 yr.
A number of possible economies of scale could provide selective benefits to mast-seeding plant species, of which the most frequently observed are satiation of seed pred-ators and increased pollination efficiency (Kelly 1994). The possible benefits gained byC. pallensas a result of predator satiation and pollination have been well explored. Im-proved pollination efficiency provides very little benefit from mast seeding in C. pallens, mainly because only in the very lowest flowering years does pollination success decrease (Kelly and Sullivan 1997). This lack of effect has been confirmed both by empirical tests that manipulated flower densities in the field (Tisch and Kelly 1998) and by modeling (Kelly et al. 2001). Pollination seems to be ef-ficient even at low flowering densities because plants are capable of self-pollination within a solitary inflorescence. In contrast,Chionochloahas been shown to gain major benefits from predator satiation. Flowers and developing seeds are attacked by three widespread specialist inverte-brates: a chloropid fly (Diplotoxa similis, Diptera: Chlo-ropidae), an undescribed cecidomyiid (Diptera: Cecido-miidae), and a moth (Megacraspedus calamogonus, Lepidoptera: Gelechiidae). All three species of insect have been recorded from a wide range ofChionochloahost spe-cies, including C. pallens (McKone et al. 2001). Each of the insects alone can destroy more than 50% of florets. The three species often co-occur, and total levels of pre-dation can exceed 90% (Kelly et al. 1992; Kelly and Sullivan 1997; Sullivan and Kelly 2000). However, mast flowering is effective in reducing levels of predation in C. pallens from around 80% losses in years with lower flowering effort than the previous year, down to less than 10%
pre-dation in years with much higher flowering effort than the previous year (Kelly and Sullivan 1997).
As well as flowering following warm summers, some Chionochloaspecies also flower heavily after being burned in wildfires (Payton and Brasch 1978; Payton and Mark 1979) despite having reduced carbohydrate levels at that time. Payton and Mark (1979) showed that in C. rigida, plants invariably flowered heavily in the year after fire, and it then took 14 yr of reduced growth and flowering for biomass levels to recover to prefire levels. There are an-ecdotal reports of otherChionochloaspecies also flowering after fire, althoughChionochloa rubradoes not show this response (Bycroft 1999). Flowering postfire could repre-sent an economy of scale that would favor mast seeding (Kelly 1994). However, before the arrival of humans, nat-ural wildfires were extremely rare in New Zealand (McGlone 2001), so we do not consider fire further in this article.
Seedlings can often be found where there has been little disturbance, but growth rates are very slow, with 6-yr-old seedlings being!5 cm tall and having less than seven tillers (Mark 1969). Seedling establishment inChionochloais in-hibited by competition with established vegetation (in-cluding adults) and by introduced mammalian herbivores (Rose and Platt 1992; Lee et al. 1993). Removal of the vegetation cover by fire can enhance establishment (Mark 1965a; Yeates and Lee 1997).
Study Site and Field Methods
Individual plant flowering data were available forC. pallens from Mount Hutt, Canterbury, New Zealand. The site (43⬚32⬘S, 171⬚33⬘E) was at 1,070 m elevation in secondary
subalpine grassland that developed following anthropo-genic fires below the original tree line (∼1,350 m). A num-ber of other studies ofChionochloabiology have used this site (McKone 1990; Kelly et al. 1992, 2001; Kelly and Sul-livan 1997; McKone et al. 1997, 1998, 2001; SulSul-livan and Kelly 2000). The site was a southeast-facing slope domi-nated by a mixture ofC. pallens(94% of the tussock cover) andC. macra(6%). Records ofC. pallensflowering at this site began in 1986, but data on an individual plant level did not commence until 1990. Three permanent transects, each 20 m long, were marked with steel pegs, and all C. pallensthat touched the line were mapped (np81). Each February from 1990 to 2001 the number of inflorescences were counted on each mapped plant.
both cases). However, variation in the number of inflo-rescences per tussock (percentage of tillers that flower) is so much more extreme (11,300-fold) that this latter var-iable accounted for 96% of the variation among years in florets per tussock (Kelly et al. 1992). Therefore, we use the number of inflorescences as our measure of flowering effort.
Mount Hutt experiences a cool-temperate humid cli-mate. Annual rainfall is around 2,000 mm/yr, evenly dis-tributed through the year, so there are probably very few periods when soil moisture is limiting. Air temperatures were measured on theC. pallenssite from May 1995 with a CR21X micrologger (Campbell Scientific, Logan, Utah). Annual mean temperature from 1996 to 2000 was 7.0⬚C;
the warmest month was February (meanp12.6⬚C), and the coldest was July (1.2⬚C). Daily air temperatures at
Mount Hutt were highly correlated with daily values from Christchurch (10 m elevation, 87 km to the east, mean difference of 6.0⬚C); therefore, for periods before May
1995, Mount Hutt temperature was estimated from Christ-church data.
At this moist alpine site, growth and photosynthesis are likely to be limited by temperature. Leaf growth has been shown to increase with temperature inChionochloaspecies (Espie et al. 1992). To estimate accumulation of resources byChionochloa, we used season-growing degree days from mean air temperature data, using a threshold of 6⬚C below which no growth was assumed to occur. This relationship is similar to that used in agricultural settings but with the threshold lowered by 2⬚C to suit the physiology of alpine
plants. The growing season was defined as November to March inclusive, a period that included 180% of the whole-year (July to June) growing degree days.
Description of Time Series
In any masting species, there are two critical aspects of the pattern of reproduction that are of interest. The first is the temporal variability from year to year, while the second is the degree of synchrony in reproduction between individuals within the population. Temporal variability was assessed using the population-level coefficient of var-iationCV pj/m. To assess synchrony, we calculated the
p
average correlation coefficient,ri,j, between the time series of reproductive output of all distinct pairs of individuals within the population,
1
Sp
冘 冘
r . (1)i,j
n(n⫺1) i j(i
This approach has the advantages of being simple to boot-strap and so to obtain confidence intervals (Bjørnstad et al. 1999). We constructed a bootstrapped 95% confidence
interval by randomly selecting individuals with replace-ment and recalculating S. This procedure was repeated 1,000 times to produce the confidence interval.
To explore the cueing or resource-tracking hypotheses, we developed a series of regression models to predict the reproductive output from the average January temperature the previous year and the growing degree days in the pre-vious growing season. The dependence of flowering on January temperature was modeled as either a continuous relationship or a threshold. Plant size was included in all models as a covariate. As reproductive output cannot be negative, a log-link function was used, and to allow for the dispersion in the count data, the negative binomial distribution was used for the error (Lawless 1987). We then simulated the reproductive output of each individual using the appropriate regression model incorporating the estimated error variance. This procedure was repeated 1,000 times to obtain the expected distribution of repro-ductive synchrony,S, and CVp.
Resource-Based Models of Masting: Dynamics and Estimation
Here, we briefly describe the resource-based models of masting (Isagi et al. 1997; Satake and Iwasa 2000). The models assume that an individual hasS(t)energy in store at the beginning of yeart. Each year, plants receivePsunits of energy from photosynthesis. If the resultant energy store (S(t)⫹Ps) exceeds a critical level,LT, then the plant re-produces; otherwise, it saves all its energy for the following year. The energy expended on flowering is assumed to be proportional to the excess, namely a[S(t)⫹Ps⫺LT]. Plants that flower may be pollinated and in turn produce fruit. The cost of fruit is assumed to be proportional to the cost of flowers (by a factorRc). With these assumptions,
the energy dynamics of an individual can be written
S(t⫹1)p
S(t)⫹Ps ifS(t)⫹Ps≤LT. (2)
{
S(t)⫹Ps⫺a(R ⫹1)[S(t)⫹Ps⫺L ] ifS(t)⫹Ps1Lc T T
The associated flowering dynamics is
a(Rc⫹1)[S(t)⫹Ps⫺LT] if S(t)⫹Ps1LT
F(t⫹1)p
{
. (3)0 ifS(t)⫹Ps≤LT
The equilibrium energy budget of a plant is given by
Ps ˜
Sp ⫺Ps⫹L . (4)
T
a(Rc⫹1)
This equilibrium is stable providinga(R ⫹1)!2(Satake
c
the system shows chaotic dynamics but at times with a strong statistical periodicity; the bifurcation diagram is shown in Satake and Iwasa (2000).
The main problem in applying this model is that while reproductive expenditure and energy accumulation are rel-atively easy to measure (at least through proxies such as flower counts and degree days), it is extremely difficult to estimate the energy stores of a plant without destructive sampling. To get around this problem, we need a way of reconstructing the energy budget of a plant given the en-ergy it receives each year,Ps, and its reproductive output. To do the reconstruction, we rewrite the recursive equation (2) as
t t
˜
S(t)pS⫹D(0)⫹
冘
cPs(j)⫺冘
F(j), (5)jp0 jp0
whereD(0)is the unknown deviation from the equilibrium energy budget at time 0. The conversion factor,c, includes the conversion of energy units into “flower units” and the proportion of photosynthate devoted to reproduction (rel-ative to maintenance, etc). Note that we allow the param-eter Ps to vary through time to reflect annual weather variation and that the approach can be extended to allow for fixed rather than proportional maintenance cost (see app. A). We can reconstruct the time series,D(t), of how the energy store deviates from its equilibrium value (D(t)pS(t)⫺S˜) by rewriting (5) as
t t
F(j)pD(0)⫹c Ps(j)⫺D(t), (6)
冘
冘
jp0 jp0
from which it is clear thatD(t) is the residual from the regression of cumulative number of flowers on cumulative energy input. Note that this reconstruction still works if Psis measured through a proxy (in our case, the number of degree days) because the slope, c, will accommodate additional conversion constants.
The reconstruction does not allow us to estimate the equilibrium energy budget, . Fortunately, equation (2)S˜ can be rewritten in terms of the deviations from the energy equilibrium,S˜ , according to
D(t⫹1)p
Ps
D(t)⫹Ps ifD(t)⫹ ≤0
a(Rc⫹1) .
Ps Ps
{
D(t)⫹Ps⫺a(Rc⫹1)[
D(t)⫹]
ifD(t)⫹ 10a(Rc⫹1) a(Rc⫹1)
(7)
From equation (7), it is obvious that the dynamics of the
system are perfectly defined even when S˜ is not known; conditional on reproduction taking place, the reproductive output in year t⫹1is
F(t⫹1)pa(R ⫹1)D(t)⫹Ps, (8)
c
which is a linear function inD(t). The key parameter com-bination of interest for the resource-depletion model is (Satake and Iwasa 2000), which we refer to as a(Rc⫹1)
the resource-depletion coefficient and hereafter label A. From equation (8), it can be seen thatAcan be estimated as the slope of the regression of F(t⫹1)on D(t)for the subset of the data for which the energy store exceeds a critical threshold. Given a known threshold, this is simply a standard linear regression problem. However, since we do not know the threshold, we need to estimate both the threshold and the slope simultaneously. Fortunately, this is a standard piecewise linear regression problem (Tong 1990). We use maximum likelihood to estimate three pa-rameters (threshold, slope, and mean number of inflores-cences produced when a plant is below the threshold) and profile likelihood (e.g., Hilborn and Mangel 1997) to erect confidence intervals (assuming the likelihood is 2
dis-x
tributed with three degrees of freedom). To test whether this approach, first, allows accurate estimation ofA and, second, can distinguish between the resource-based mod-els and RM, we performed an extensive simulation study using both resource-based and RM models (see app. B).
Models for the Evolution of Masting Behavior
To explore how resource dynamics, cueing, and predator satiation interact to determine the optimal flowering dy-namics (as controlled by A), we developed a stochastic simulation model. In the model, each plant has resource dynamics determined by equation (2); the probability that an established plant dies ispd, and following the death of
an established plant, the identity of the successful recruit is determined by lottery competition between seedlings. New recruits are given an initial energy store of LT. We assume there are potentially good years for reproduction (e.g., whether previous year’s summer temperatures were warm enough to allow bud formation), which occur with probability, pgood, and these occur independently at
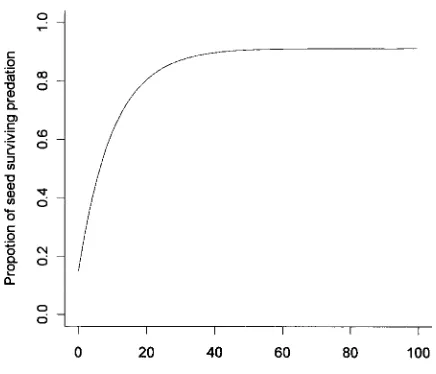
Figure 1:Empirical relationship between the proportion of seed escaping seed predators and the size of successive seed crops, from Kelly and Sullivan (1997).
germinate enter the seed bank where the probability of dying isd (see Rees and Long 1992 for examples of this type of seed bank model). To determine the optimal strat-egy, we competed 50 genotypes with different values ofA equally spaced between 0 and 10. If any genotype had a frequency of!0.001 in the seed bank, it was reintroduced at this frequency to prevent extinction. All simulations were run for 100,000 yr.
Results
Description of the Time Series
Flowering inChionochloa pallensis highly variable between years and synchronized within the population (fig. 2a). The relationship between flowering this year and flowering last year is highly nonlinear and low dimensional, dem-onstrating that plants rarely flower 2 yr in succession, and if they do, the number of flowers produced is low (fig. 2b). The population-level CVpwas 1.88 (bootstrapped 95%
confidence interval: 1.13–2.80), and the estimated level of synchrony,S, was 0.77 (bootstrapped 95% confidence in-terval: 0.69–0.84).
The critical January temperature for flowering was ≈11.5⬚C at Mount Hutt, below which very few
inflores-cences were produced (fig. 3a). There were also positive relationships between plant size, degree days, and the num-ber of inflorescences produced (fig. 3b, 3c). All three re-lationships were highly significant (P!.001, using a neg-ative binomial generalized linear model with log-link
function) when analyzed separately or included in a mul-tiple regression. It is also noteworthy, however, that low flowering can occur in the second warm year if two warm years occur in a row (1998/1999 and 1999/2000 showed this pattern). Using a 59-yr time series of January tem-peratures from Christchurch, we estimated the probability that the temperature would be above the critical value at Mount Hutt; the estimated probability was 0.42.
Regression Models for Cueing and Environmental Quality
None of the estimated regression models was able to ad-equately describe the observed levels of synchrony (table 1). The best model, which included an interaction between a threshold temperature for flowering and degree days, gave a predicted level of synchrony of 0.22, which was significantly less than the 0.77 estimated from the field population. We, therefore, tentatively conclude that simple RM models including cues and/or measures of environ-mental quality are not sufficient to describe the patterns of mast flowering observed inC. pallens.
Reconstruction of the Energy Budget and Predictions of the Resource Model
The fitted model for flowering against the reconstructed energy budget is shown in figure 4. The estimated value of A is 2.34 (profile likelihood 95% confidence interval: 2.20–2.60), which is in the chaotic dynamic regime. Com-parison of the model with data using one-step predictions is potentially misleading because information on flowering is used to reconstruct the energy budget. We therefore further focus on the dynamic behavior of the fitted model (eq. [2]). We first generated 100 yr of data for 81 plants using p p0.42 (to initiate the population). We
sub-good
sequently used the observed time series of January tem-peratures for the next 12 yr and calculated CVpand
syn-chrony, S. This procedure was repeated 1,000 times to obtain the expected distribution ofSand CVp. Using this
procedure, the predicted level of synchrony was 0.79 (stan-dard deviation 0.10) and CVpwas 1.60 (standard deviation
0.44), in good agreement with the data (Sp0.77, ).
CV p1.88
p
consec-Figure 2:Long-term flowering dynamics inChionochloa pallensat Mount Hutt.a, Flowering trajectories for individual plants over the study period, where 1990 refers to the 1989/1990 flowering season.b, Phase-plane plot for individual plants of flowering in yeart⫹1against flowering in yeart.
utive years suitable for reproduction and reproductive plants have energy stores just larger than the reproductive threshold) and is observed in three of the real plants (fig. 2b).
Evolution of Masting Behavior
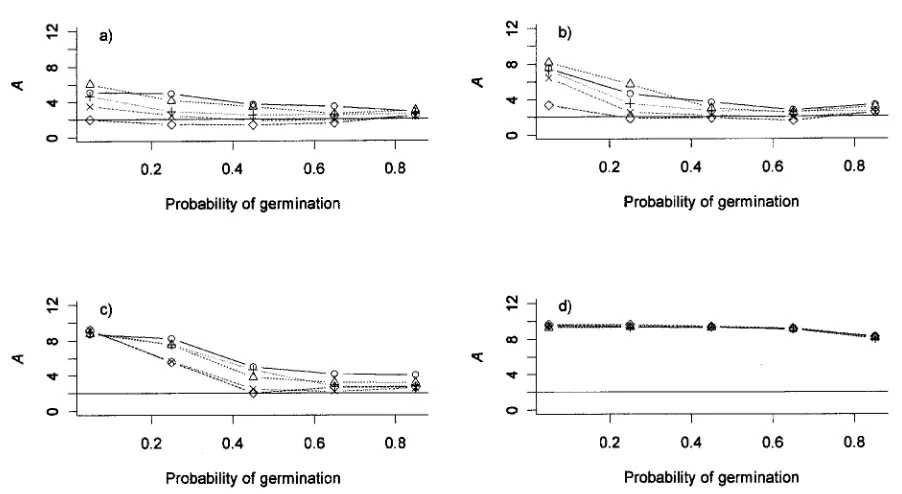
The stochastic simulation models clearly indicate that cha-otic resource dynamics, as predicted by the fitted model, can be selected for under certain circumstances (fig. 6). The optimal value ofA depends largely on the interplay between the advantages of predator satiation, the rates of adult mortality, and the costs of not reproducing every year (notably due to lost opportunities for establishment). When adult mortality is high, we obtain the classical life-history result that high reproductive effort is favored (Bul-mer 1985; Charnov and Schaffer 1973); this leads to cha-otic resource dynamics (fig. 6d). When adult mortality is low (p !0.05), the optimal value ofA depends critically
d
on the carryover of seeds in the seed bank (fig. 6a–6c). If there is little carryover of seeds, selection favors stable dynamics,A!2. This allows plants to reproduce in most years when conditions are favorable and to exploit any establishment sites that become available. When there is substantial carryover of seeds, then chaotic fluctuations in resource dynamics are favored; this reduces seed losses through predation while allowing establishment microsites to be captured even in years when no reproduction occurs. Thus, having a way of storing the gains made when
mast-ing occurs is critical to the success of the mastmast-ing strategy; otherwise, density-dependent mortality during the estab-lishment phase annuls the advantages of predator satiation.
Behavior of Resource Models
To understand in more mechanistic detail why interme-diate values of A are selected, we explored the dynamic behavior of the resource model for a range of values of A, while varying the probability of a year being suitable for reproduction, pgood. For each of the simulations, we calculated the population-level variability, CVp, and
syn-chrony, S. We also studied the nature of the fluctuation using spectral analysis, with particular reference to statis-tical periodicity in the chaotic time series.
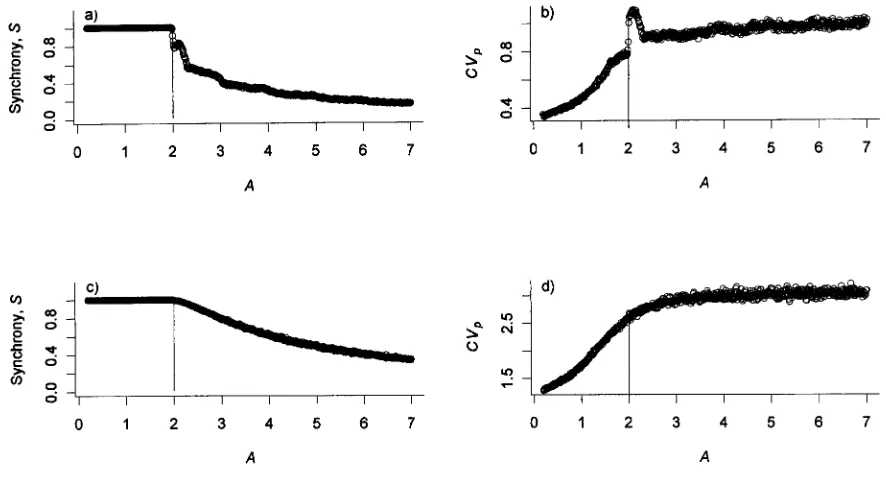
The simulation predicts high levels of synchrony for all values of pgood when the model has a stable equilibrium point, A!2; over this range, CVpalso increases (fig. 7).
When the condition for stability is violated, the levels of synchrony decline, and the CVpincreases as the underlying
dynamics become chaotic. Near the boundary for stability, and most notably for high values ofpgood, there is a peak in synchrony and CVp. This parameter set corresponds
loosely to the estimated values of A. Detailed studies of the model dynamics reveal that this parameter interval is where the proportion of the variance “explained” by a statistical 2-yr cycle is maximized. Indeed, in the interval , the period 2 cycle accounts for180% of the 2.2!A!2.3
[image:8.612.93.515.88.321.2]Figure 3:Relationships between the number of inflorescences produced and (a) January temperature, (b) degree days, and (c) plant canopy area (log scale).
of A, there is also an important 4-yr component to the dynamics. For greater values ofA, the dynamics are in-creasingly chaotic and dein-creasingly periodic. Thus, in the weakly forced (i.e., bad years are very rare) system, syn-chrony is most easily induced and CVpis most easily
max-imized for intermediate (but chaotic) values ofAbecause these are the values for which the statistical spectrum of the dynamics is the simplest (i.e., a single and dominant peak in the power spectrum). This effect becomes weaker aspgoodbecomes smaller because the external cueing will increasingly dominate the flowering dynamics (fig. 7c, 7d).
Discussion
This study leads to five key conclusions that we will con-sider in turn below. First, we can retrospectively recon-struct the internal energy reserves of a mast-seeding plant given a long time series of individual flowering data. Sec-ond, the masting of individualChionochloa pallensplants can only be adequately modeled by including a resource storage component; simple cues or resource matching are insufficient. Third, the estimated parameters ofC. pallens put the internal flowering dynamics significantly in the chaotic dynamic regime. Fourth, evolution selects for cha-otic dynamics because such dynamics reduce losses of seed to seed predators, but only if adults are long lived and
there is some mechanism (such as a seed bank) for mast-seeding individuals to fill gaps that occur in nonmasting years. Fifth, if global climate change alters the frequency of high-temperature signals, the system may break down and seed predation may increase greatly.
Reconstructing Energy Reserves
Table 1: Estimated synchrony, S, and CVp for the data and model
predictions not including an energy store
S CVp
Data .77 (.69, .84) 1.88 (1.13, 2.80)
Model:
Ln (size) ⫺.00015 (⫺.008, .012) .34 (.21, .51) Ln (size)⫹Jan .18 (.14, .23) 1.27 (1.03, 1.58) Ln (size)⫹TJ .13 (.12, .15) .80 (.74, .87)
Ln (size)⫹Ps .042 (.02, .08) .83 (.58, 1.15) Ln (size)⫹Jan⫹Ps .20 (.16, .25) 1.38 (1.13, 1.66) Ln (size)⫹Jan#Ps .20 (.15, .24) 1.32 (1.10, 1.64) Ln (size)⫹TJ⫹Ps .21 (.17, .26) 1.2 (1.03, 1.43)
Ln (size)⫹TJ#Ps .22 (.18, .27) 1.23 (1.05, 1.48)
Note: Figures in brackets are 95% confidence intervals. Predictors: size, plant canopy area; Jan, previous January temperature;TJ, threshold previous January temperature for flowering;Ps, previous growing season degree days. For the data, the confidence intervals were obtained by bootstrapping (see text for details). The confidence intervals on the model predictions were obtained by generating 1,000 sets of model predictions and calculating the synchrony and CVp. Model terms separated by a multiplication cross were fitted as interactions.
Figure 4:Relationship between the number of inflorescences produced and the reconstructed deviations from the equilibrium energy budget. The open circles are from years when the January temperature was above the threshold (11.5⬚C); the filled circles are from years when the January temperature was less than the threshold (11.5⬚C). The fitted lines are from the threshold regression model; see text for details.
to get reasonable estimates of reserves, and that for very high depletion coefficients (A12.5), the regression method that uses reconstructed reserves underestimates the depletion coefficient somewhat. In more general terms, these techniques are potentially useful in many species where an understanding of the internal energy budget is required, for whatever purpose. Finkensta¨dt and Grenfell (2000) used a similar technique to reconstruct the unob-served susceptible class in a time-series analysis of measles epidemics.
Can Resource Matching or Cues Explain Masting?
The statistical analysis shows that the masting flowering observed in Chionochloa is unlikely to be the result of resource matching alone (table 1). Of course it is difficult to refute the resource-matching hypothesis because one could always argue that some complex pattern of yet un-known environmental cues could be responsible for any observed pattern of flowering. However, the most parsi-monious explanation, relying only on known aspects of the biology ofChionochloa, is that flowering is controlled by a simple environmental cue (Mark 1968; McKone et al. 1998; Kelly et al. 2000), and in years suitable for flow-ering, flowering effort is controlled by the plant’s resource status as determined by previous flowering history. A sim-ple yet critical illustration of how simsim-ple cue models fail to match real flowering pattern, even when there is an extremely sharp cue (steep log-linear relationship or on/ off switch), is that resource depletion is essential to explain the absence of consecutive flowering years given consec-utive warm years in a row (as seen in real data in 1998/ 1999 and 1999/2000).
[image:10.612.315.537.432.615.2]Figure 5:Geometry of the estimated dynamical attractor showing the relationship between the numbers of inflorescences produced in succes-sive years for a population of 81 plants. Parameter values used in the simulation are as follows:L p200,p p0.42,Ap2.34, andPsp
T good .
7.78
altering the level of resource acquisition. Only by showing what variables are correlated with flowering, or alterna-tively with growth or resources, can the hypothesis be supported or not supported. Tapper (1996) showed that inFraxinus excelsior, the weather variables associated with greater growth (wider rings in nonreproductive trees) were different from the weather variables associated with heavy flowering, so that the hypothesis was not supported in that case. We can now add a second example. ForC. pallens, we have shown that a simple binary cue (January tem-peratures over a threshold value) is more important than favorable whole-season temperatures. Stored resources are vital, whereas simple accumulation in the current or pre-vious season (resource matching) is of less importance.
What this does not determine is why the cue exists. Why is flowering inC. pallensapparently so sensitive to January temperatures? There could be a simple physio-logical explanation (perhaps some aspect of floral bud ini-tiation or gibberellin synthesis in this genus demands warm temperatures). However, bud initiation is less ob-viously affected than newly opened flowers by cold or inclement weather, and the relationship is extraordinarily sensitive (whether modeled as a steep log-linear relation-ship or a simple binary switch). Since there is a clear predator-satiation benefit to plants of synchronized inter-mittent flowering (Kelly and Sullivan 1997) and since
syn-chrony requires external cueing (or forcing; Norton and Kelly 1988), the most parsimonious explanation would be that the cue has been selectively advantageous in reducing losses to seed predators.
Perhaps the most remarkable aspects of the flowering model we developed and parameterized forC. pallensare how readily the theoretical model of Satake and Iwasa (2000) could be adapted to the data forChionochloaand how well the behavior of the real population fits the pre-dictions from a slight elaboration of their theoretical model. All this suggests that fairly simple nonlinear mech-anisms for resource allocation may be at the heart of the masting behavior of plants in the wild.
Why Is the Masting Behavior Chaotic?
Chaotic behavior is almost unknown in any aspect of plant population dynamics (Rees and Crawley 1989, 1991). It seems significant thatC. pallens’ flowering behavior is de-termined by a value of the depletion coefficient,A, which is just over the boundary into chaos. If the depletion co-efficient is reduced, the variation among years for indi-vidual plants goes down (plants have smaller, more fre-quent flowering episodes), so population variability decreases. If the depletion coefficient is increased, the dy-namics become so chaotic that synchrony declines and the population-level variability decreases. Therefore, to get the maximum benefits from satiating seed predators, individ-uals have to have just the right level of chaotic (but sta-tistically periodic) dynamics built into their flowering responses.
That it apparently matters so much to achieve high is probably related to the nature of the seed predators. CVp
First, very high proportions of seed are lost to the seed predators. Second, Chionochloa is attacked by three dif-ferent insects, and one of them (the undescribed cecido-myiid) appears to have predictive diapause, whereby the insects do not emerge from extended diapause in the fol-lowing year but can wait to emerge in the next heavy flowering year forChionochloa(McKone et al. 2001). This makes it extremely hard for the plant to shake off the seed predator by more moderate levels of mast seeding. The chaotic dynamics shown here would presumably be more difficult for an insect predator to track, and therefore, Chionochloashould minimize seed predation by having a high-CVpchaotic flowering pattern. All this is consistent
with Chionochloaspp. having the highest reported levels of mast seeding of any plants worldwide (Kelly et al. 2000).
Masting, Density Dependence, and Seed Banks
Figure 6:Optimal values for the resource-depletion coefficient,A, as a function of the probability of seed germination,g, for different values of the probability of adult mortality.a,p p0.001;b,p p0.005;c,p p0.01; andd,p p0.05. The solid line in each panel indicated the condition
d d d d
for stability,A!2. Within each panel, the symbols indicate different values ofp :circles,p p0.9;triangles,p p0.8;⫹,p p0.6;#, good good good good
; anddiamonds, . Other parameter values are , , and .
p p0.4 p p0.2 Psp940 L p20,000 dp0.1
good good T
competition among seedlings, which is a cost of masting (Hett 1971; Kelly 1994). In our evolutionary models, there is strong selection for chaotic internal resource dynamics when there is at least some carryover of seeds in the seed bank, which allows plants to colonize gaps even in years when they do not flower. The strict form of density de-pendence in our models strongly penalizes plants that fail to capture establishment sites because adults cannot be displaced by seedlings, and the gaps are allocated to a winner from the pool of live seeds present in the year the gap appears. A different form of density dependence might reduce the cost of masting. Other aspects of the biology could further influence the cost of masting. For example, local dispersal would reduce the effectiveness with which individuals who are not in synchrony capture microsites (therefore favoring masting) while increasing the strength of local density dependence (which has the opposite ef-fect). There could also be other ways that the plants could compensate for missed years of reproduction. For example, long-lived, slow-growing seedlings form a seedling bank (Mark 1969) that allows gaps to be colonized even in years with no reproduction.
Minimizing the costs of masting also depends on adult plants having long lives and correspondingly low mortality rates (Waller 1979). Over a broad range of parameter space, the simple evolutionary model predicts chaotic
re-source dynamics in agreement with the data analysis; for , the model predicts A in the range of 2–4, p p0.4
good
providing adult mortality is not high (!0.05) and the pro-portion of seeds germinating is 10.4. Long-term obser-vational data suggest that adult mortality is indeed very low in Chionochloa (Whitehouse 1982), and the experi-mental data for Chionochloa macra are consistent with germination in the first year being 150% (Spence 1990). The general point is that mast seeding involves missing opportunities for reproduction, and this can be a strong disadvantage unless there are ways to minimize these costs. In a conceptual sense, all this was identified by Alan Mark when he wrote in 1969 “the longevity of seeds [of Chio-nochloa rigida] compensates both for the intermittent flowering in normal tussocks, and for the period of neg-ligible flowering that follows the prolific seeding caused by burning” (Mark 1969, p. 302).
Global Climate Change and Mast Seeding
Figure 7:Relationship between CVp, synchrony, and resource depletion,A, for various values ofpgood.a,b,pgoodp0.9;c,d,pgoodp0.4. Other parameter values arePsp930andLTp20,000. The results are based on 200 replicates of a 100-yr simulation with a population consisting of 100 individuals.
They considered that if mean air temperatures increased by 1⬚–2⬚C, as predicted under recent global-circulation models, the frequency of flowering would increase, and this could result in a breakdown of synchrony to decrease the CVp. If flowering variability decreased, predator
sati-ation would become much less effective, and the plants would have fewer surviving seeds just at the time that they need to migrate altitudinally to cope with climate shifts. The models in this article support the conclusions of McKone et al. (1998). The effect of increasing mean tem-peratures, at least in the short term, would be to increase the fraction of years when flowering is possible. This will decrease CVi, since each plant will have less time between
flowering efforts to accumulate reserves, and hence will decrease CVp and increase seed predation. This problem
could be relevant to a wide range of species, if the un-derlying resource models used here apply, because many masting species have been shown to respond to temper-ature cues and to suffer higher seed predation at lower CVs.
Conclusions
This mechanistic exploration of the mast-seeding behavior ofC. pallens has shown that the system appears to have been driven, by evolutionary forces, into chaotic parameter space. This chaotic behavior is favored because it reduces
the impact of natural enemies, while balancing the costs of missed reproductive events. Chionochloa thus appears to be a rare example of chaotic dynamics that is induced by biological evolution.
Acknowledgments
This article is a product of the Masting Dynamics Working Group supported by the National Center for Ecological Analysis and Synthesis, a center funded by the National Science Foundation (grant DEB-0072909), the University of California, and the University of California, Santa Bar-bara. We thank other Working Group participants (J. Buonaccorsi, R. Duncan, J. Elkinton, W. Koenig, A. Lieb-hold, M. Peltonen, C. Smith, V. Sork, and B. Westfall) for their comments. We thank the many developers of the open-source software package R (http://www.cran.r-project.org), which was used to run the models and anal-yses in this article, and the E. L. Hellaby Grassland Trust for funding fieldwork.
APPENDIX A
Alternative Models for Energy Allocation
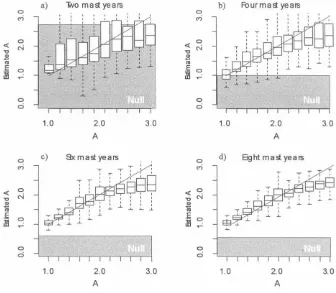
Figure B1:Box plots of the estimates ofAagainst true values based on simulated data for which the true value is known. Twelve years of data were simulated on the basis of the model (eqq. [2], [3]). The results are broken down by number of masting years in the time series:a, 2 yr;b, 4 yr;c, 6 yr;d, 8 yr. The box plots represent the median estimate, the interquartile range, and the 95% range. The diagonal lines represent unbiased estimation. The shaded areas represent the 95% range for estimates based on the null model involving a temperature cue and degree days but no internal resource dynamics (see app. B).
input was derived using the assumption that the propor-tion of photosynthate devoted to flowering (relative to maintenance and vegetative growth) was constant. This may not be the best assumption for all plants. If we, in-stead, assume that a constant amount of energy,k, is de-voted to maintenance and growth (so that energy available to flowering iscPs(t)⫺k), we can rewrite equation (6) as
t t t
˜
S(t)pS⫹D(0)⫺
冘
k⫹冘
cPs(j)⫺冘
F(j),jp0 jp0 jp0
which on rearranging is
t t
F(j)pD(0)⫺tk⫹c Ps(j)⫺D(t).
冘
冘
jp0 jp0
So under this alternative model for energy allocation, can still be reconstructed as the residuals from the D(t)
multiple regression of cumulative flowering on cumulative energy and time. Using this alternative reconstruction, we
estimateAto be 2.76 (95% confidence interval using pro-file likelihood: 2.50–3.10), which again is significantly into the chaotic dynamic regime.
We checked that the profile likelihood produced correct coverage of the confidence interval through bootstrapping individuals. This gave a 95% confidence interval (assuming constant maintenance costs) of 2.50–3.10, in excellent agreement with the profile likelihood confidence interval (CI). The analogous bootstrap CI, assuming proportional maintenance costs, was found to be 2.20–2.60, again, in excellent agreement with the profile likelihood calculations.
APPENDIX B
Testing the Reconstruction Algorithm
concerns are, first, does the method provide correct esti-mates ofAwhen the resource-based model is true? Second, does the method provide spurious estimates when the RM model is true? Third, does the method have the ability to distinguish between the two models?
To address these issues, we conducted a large simulation study applying our estimation framework to a sequence of data sets under the null hypothesis of RM and under the alternative resource-based model. For each parameter combination, we studied 500 replicate populations each consisting of 100 individuals. In both models, we assumed a “temperature” cue (a binomial variable flagging good and bad years) determining whether to flower at all, and on flowering, reproduction was either given by the re-source-based model or the simpler RM model. We varied the length of the time series but will in this synoptic pre-sentation focus onTp12 (corresponding to the data). We variedAin the RM model between 1 and 3. The energy budget was reconstructed using equation (6). Estimation of thresholds and slopes were done as discussed in the text. A likelihood-ratio test was used to select whether to use the slope from the threshold model (eq. [7]) or a simple linear regression of flowering against reconstructed energy budget. A 10% coefficient of variation was assumed in the annual number of degree days; this was also varied, but the results were robust to this.
Generally, the simulation shows that the reconstruction algorithm works well. For 12 yr of data on 100 individuals, the method provides almost unbiased and reasonably ac-curate estimates of A when the resource-based model is true. The coefficient is slightly biased away from 0 when RM is true; however, there is good separation between the two models (fig. B1). For, say, 30 yr of data, the recon-struction and estimation is excellent. The results further reveal that the number of masting events is a critical factor in whether one can distinguish the resource-based model from the RM. If the time series only covers one or two mast years, then the estimated slope under the RM model is biased to an unacceptable degree away from 0. This appears to result from the reconstruction algorithm re-quiring multiple masting events to reliably reconstruct the energy store. However, with four mast years (as seen in the Chionochloadata), there is good separation between the two models. We are therefore confident that the results presented are not artifacts of the reconstruction algorithm.
Literature Cited
Bjørnstad, O. N., R. A. Ims, and X. Lambin. 1999. Spatial population dynamics: analysing patterns and processes of population synchrony. Trends in Ecology & Evolution 14:427–431.
Bulmer, M. G. 1985. Selection for iteroparity in a variable environment. American Naturalist 126:63–71.
Busgen, M., and E. Munch. 1929. The structure and life of forest trees. Chapman & Hall, London.
Bycroft, C. M. 1999. Ecology and management of copper (red) tussock (Chionochloa rubrassp.cuprea) grassland in Southland and Otago, New Zealand. Ph.D. diss. Uni-versity of Otago, Dunedin.
Charnov, E. L., and W. M. Schaffer. 1973. Life-history consequences of natural selection: Cole’s result revisited. American Naturalist 107:791–793.
Connor, H. E. 1967. Interspecific hybrids inChionochloa (Gramineae). New Zealand Journal of Botany 5:3–16. ———. 1991.Chionochloa zotov(Gramineae) in New
Zea-land. New Zealand Journal of Botany 29:219–282. Espie, P. R., H. E. Connor, and I. J. McCracken. 1992.
Leaf-blade crimping in grasses: a new measure of growth. Experimentia 48:91–94.
Finkensta¨dt, B. F., and B. T. Grenfell. 2000. Time series modelling of childhood diseases: a dynamical systems approach. Journal of the Royal Statistical Society Series C, Applied Statistics 49:187–205.
Herrera, C. M. 1998. Population-level estimates of inter-annual variability in seed production: what do they ac-tually tell us? Oikos 82:612–616.
Hett, J. M. 1971. A dynamic analysis of age in sugar maple seedlings. Ecology 52:1071–1074.
Hilborn, R., and M. Mangel. 1997. The ecological detec-tive: confronting models with data. Monographs in Pop-ulation Biology 28. Princeton University Press, Prince-ton, N.J.
Isagi, Y., K. Sugimura, A. Sumida, and H. Ito. 1997. How does masting happen and synchronize? Journal of The-oretical Biology 187:231–239.
Janzen, D. H. 1971. Seed predation by animals. Annual Review of Ecology and Systematics 2:465–492.
Kelly, D. 1994. The evolutionary ecology of mast seeding. Trends in Ecology & Evolution 9:465–470.
Kelly, D., and J. J. Sullivan. 1997. Quantifying the benefits of mast seeding on predator satiation and wind polli-nation in Chionochloa pallens (Poaceae). Oikos 78: 143–150.
Kelly, D., M. J. McKone, K. J. Batchelor, and J. R. Spence. 1992. Mast seeding ofChionochloa(Poaceae) and pre-dispersal seed predation by a specialist fly (Diplotoxa, Diptera, Chloropidae). New Zealand Journal of Botany 30:125–133.
Kelly, D., A. L. Harrison, W. G. Lee, I. J. Payton, P. R. Wilson, and E. M. Schauber. 2000. Predator satiation and extreme mast seeding in 11 species ofChionochloa (Poaceae). Oikos 90:477–488.
the wind pollination benefits of mast seeding. Ecology 82:117–126.
Koenig, W. D. 1999. Oaks, acorns, and the geographical ecology of acorn woodpeckers. Journal of Biogeography 26:159–165.
Koenig, W. D., R. L. Mumme, W. J. Carmen, and M. T. Stanback. 1994. Acorn production by oaks in central coastal California: variation within and among years. Ecology 75:99–109.
Lawless, J. F. 1987. Negative binomial and mixed Poisson regression. Canadian Journal of Statistics 15:209–225. Lee, W. G., M. Fenner, and R. P. Duncan. 1993. Pattern
of natural regeneration of narrow-leaved snow tussock Chionochloa rigida ssp. rigida in Central Otago, New Zealand. New Zealand Journal of Botany 31:117–125. Mark, A. F. 1965a. Effects of management practices on
narrow-leaved snow tussock, Chionochloa rigida. New Zealand Journal of Botany 3:300–319.
———. 1965b. Flowering, seeding, and seedling estab-lishment of narrow-leaved snow tussock, Chionochloa rigida. New Zealand Journal of Botany 3:180–193. ———. 1968. Factors controlling irregular flowering in
four alpine species ofChionochloa. Proceedings of the New Zealand Ecological Society 15:55–60.
———. 1969. Ecology of snow tussocks in the mountain grasslands of New Zealand. Vegetatio 18:289–306. Mark, A. F., and K. J. M. Dickinson. 1997. New Zealand
alpine ecosystems. Pages 311–345inF. E. Wielgolaski, ed. Ecosystems of the world: polar and alpine tundra. Elsevier, Amsterdam.
McGlone, M. S. 2001. The origin of the indigenous grass-lands of southeastern South Island in relation to pre-human woody ecosystems. New Zealand Journal of Ecology 25:1–15.
McKone, M. J. 1990. Characteristics of pollen production in a population of New Zealand snow-tussock grass (Chionochloa pallens Zotov). New Phytologist 116: 555–562.
McKone, M. J., A. L. Thom, and D. Kelly. 1997. Self-compatibility inChionochloa pallensandC. macra (Po-aceae) confirmed by hand pollination of excised styles. New Zealand Journal of Botany 35:259–262.
McKone, M. J., D. Kelly, and W. G. Lee. 1998. Effect of climate change on mast-seeding species: frequency of mass flowering and escape from specialist insect seed predators. Global Change Biology 4:591–596.
McKone, M. J., D. Kelly, A. L. Harrison, J. J. Sullivan, and A. J. Cone. 2001. Biology of insects that feed in the inflorescences ofChionochloa(Poaceae) in New Zealand and their relevance to mast seeding. New Zealand Jour-nal of Zoology 28:89–101.
Norton, D. A., and D. Kelly. 1988. Mast seeding over 33 years byDacrydium cupressinumLamb. (rimu)
(Podo-carpaceae) in New Zealand: the importance of econo-mies of scale. Functional Ecology 2:399–408.
Payton, I. J., and D. J. Brasch. 1978. Growth and non-structural carbohydrate reserves in Chionochloa rigida and C. macra, and their short-term response to fire. New Zealand Journal of Botany 16:435–460.
Payton, I. J., and A. F. Mark. 1979. Long-term effects of burning on growth, flowering, and carbohydrate re-serves in narrow-leaved snow tussock (Chionochloa rig-ida). New Zealand Journal of Botany 17:43–54. Rees, M., and M. J. Crawley. 1989. Growth, reproduction
and population-dynamics. Functional Ecology 3: 645–653.
———. 1991. Do plant-populations cycle? Functional Ecology 5:580–582.
Rees, M., and M. J. Long. 1992. Germination biology and the ecology of annual plants. American Naturalist 139: 484–508.
Rose, A. B., and K. H. Platt. 1992. Snow tussock ( Chio-nochloa) population responses to removal of sheep and European hares, Canterbury, New Zealand. New Zea-land Journal of Botany 30:373–382.
Satake, A., and Y. Iwasa. 2000. Pollen coupling of forest trees: forming synchronized and periodic reproduction out of chaos. Journal of Theoretical Biology 203:63–84. Sork, V. L., J. Bramble, and O. Sexton. 1993. Ecology of mast-fruiting in three species of North American de-ciduous oaks. Ecology 74:528–541.
Spence, J. R. 1990. A buried seed experiment using car-yopses of Chionochloa macra (Danthonieae: Poaceae), South Island, New Zealand. New Zealand Journal of Botany 28:471–474.
Sullivan, J. J., and D. Kelly. 2000. Why is mast seeding in Chionochloa rubra(Poaceae) most extreme where seed predation is lowest? New Zealand Journal of Botany 38: 221–233.
Tapper, P. G. 1996. Long-term patterns of mast fruiting in Fraxinus excelsior. Ecology 77:2567–2572.
Tisch, P. A., and D. Kelly. 1998. Can wind pollination provide a selective benefit to mast seeding in Chio-nochloa macra (Poaceae) at Mt. Hutt, New Zealand? New Zealand Journal of Botany 36:637–643.
Tissue, D. T., and P. S. Nobel. 1980. Carbon relations of flowering in a semelparous clonal desert perennial. Ecol-ogy 71:273–281.
Tong, H. 1990. Non-linear time series: a dynamical system approach. Clarendon, Oxford.
Waller, D. M. 1979. Models of mast fruiting in trees. Jour-nal of Theoretical Biology 80:223–232.
Yamauchi, A. 1996. Theory of mast reproduction in plants: storage-size dependent strategy. Evolution 50: 1795–1807.
Yeates, G. W., and W. G. Lee. 1997. Burning in a New
Zealand snow-tussock grassland: effects on vegetation and soil fauna. New Zealand Journal of Ecology 21: 73–79.