Article
Simultaneous Parameter Tuning of PSS and
Wide-Area POD in PV Plant using FPA
Herlambang Setiadi
1,2,a,*, and Muhammad Abdillah
3,b1 Department of Engineering, Faculty of Vocational Studies, Universitas Airlangga, Campus B UNAIR Jl.
Srikana 65, Surabaya, 60286, Indonesia
2 Faculty of Science and Technology, Universitas Airlangga, Campus C UNAIR Jl. Mulyosari, Surabaya,
60115, Indonesia
3 Department of Electrical Engineering, Universitas Pertamina, Jl Teuku Nyak Arief, Jakarta, 12220,
Indonesia
E-mail: a[email protected] (Corresponding author), b[email protected]
Abstract.In the future power grid scenario, large-scale renewable energy based power plant will be one of the main generations. Among renewable based power plant types, large-scale photovoltaic (PV) plant becoming more popular as they could provide zero-emission and sustainable energy. However, even though PV plants could contribute a positive impact on the environment, they could also contribute negatively to the power system. Large-scale PV generation came with a different dynamic and zero inertia characteristic due to the application of the power electronics devices. Furthermore, the PV plant has also a drawback in terms of intermittent power output due to the uncertainty of the sources. Those handicaps could deteriorate the stability performance of the power system especially oscillatory stability. Adding a power system stabilizer (PSS) to the systems is one of the ways for handling the oscillatory stability. However, with the integration of PV plants in the systems, PSS alone is not enough to handle the oscillatory problems coming from various sources such us from PV plant dynamic. Hence, utilizing wide-area power oscillation damping (POD) as a PV plant additional controller is inevitable. Hence, this paper proposed simultaneous parameter tuning between PSS and wide-area POD in PV plant using an imperialist competitive algorithm as the optimization method. The two-area power system is used to evaluate the performance of PSS and POD using FPA. From the results, it is found that the proposed method could enhance the oscillatory stability of the systems.
Keywords: FPA, oscillatory stability, PSS, PV plant, wide-area POD.
ENGINEERING JOURNAL Volume 23 Issue6 Received 11 July 2018
1.
Introduction
In a modern power system, integration of power plant based renewable energy is increased significantly due to the technological advance and the need of clean energy. Among the large-scale photovoltaic (PV) plant is becoming favorable as they could provide clean energy in large numbers. Moreover, as the source of PV plant is solar, they are free and renewable. However, even though large-scale PV plant could bring a positive impact on nature, they could also bring a negative impact on the stability of the system. The intermittent power output of the PV plant could negatively deteriorate the stability of the systems as well as the security of the system [1]. Furthermore, the inertia-less characteristic and different dynamic models due to the application of power electronics in PV generation is also contributing to the system stability degradation [2, 3]. One of the stabilities that can be affected by the handicap of the PV power plant is oscillatory stability.
The impact of the integration of large-scale PV plant in oscillatory stability is reported in [4]. In [4], it was found that by integrating the inertia-less large-scale PV plant to the two-area power system, the damping performance of the system decreased gradually. The impact of the displacement of a synchronous generator with a large-scale PV plant is described in [5]. In [5], it was reported that the damping of the system is decreased significantly when one synchronous generator is replaced with a large-scale PV plant.
Oscillatory stability is categorized as small perturbation angle stability. This instability can be classified into local and global phenomena. The local phenomena have a frequency range between 0.7 to 2 Hz, while the global phenomena have a frequency range between 0.1 to 0.7 Hz. Traditionally, this problem can be solved by damper windings on the rotor of the generator [6]. Another way is by installing a power system stabilizer (PSS) in the excitation systems [7]. However, with increasing penetration of intermittent and inertia-less as well as the different dynamic characteristics of renewable energy generation (REG) such as PV plant, PSS alone is not enough to handle the problems. Hence, adding additional controller such as wide-area power oscillation damping (POD) in PV power systems could also be considered to handle the oscillatory instability due to the integration of REG.
Installation wide-area POD in PV generation to enhance the oscillatory stability performance of the system is reported in [8]. As reported in [8], by installing wide-area POD in PV plant the oscillatory stability performance of the power system is enhanced gradually. Adding POD in the tidal power system is reported in [9]. In [9], it was noticeable that installing POD in the grid side converter controller can enhance the damping performance of the system. However, in some cases adding the only POD in the REG could not handle the oscillatory stability performance properly. Hence, the combination of PSS and wide-area POD in REG is essential to handle the oscillatory stability performance properly. However, designing PSS and wide-area POD are included in a complex mathematical approach. Hence, designing and tuning parameters of PSS and wide-area POD simultaneously using metaheuristic algorithms can be considered for handling the complexity of designing the controller.
The application of metaheuristic algorithms for solving engineering problems has been developed significantly over the past few decades. The application of particle swarm optimization for optimizing product scheduling is reported in [10]. The application of a genetic algorithm for solving the offset in the chemical process is reported in [11]. Application of ant colony optimization for estimating traffic congestion in large Chinese cities is reported in [12]. Metaheuristic algorithm is also used in power system problems as reported in [13]. In [13], it was found that the differential evolution algorithms can be used to allocate thyristor-controlled series compensator (TCSC). The application of an artificial immune system for solving load frequency control problems is reported in [14]. The application of the firefly algorithm for solving dynamic stability problems in the power system is reported in [15]. Among numerous types of metaheuristic algorithms, the flower pollination algorithm is relatively new and shown a great promising for solving complex optimization problems [16]. Hence, this paper proposed a method for solving oscillatory problems of power system using PSS and wide-area POD in PV. To get optimal results, flower pollination algorithm (FPA) is used to tune the PSS and wide-area POD parameter simultaneously.
2.
Fundamental Theory
2.1. PV Plant Model
transform the sunlight into electrical energy and then the electrical energy from the PV array is processed through the converter before injected to the grid. Furthermore, the converter control is responsible for producing appropriate power to the grid. The mathematical representation of PV current from PV cells is derived from the PN junction physic as shown in Eq. (1) [4].
0 exp
1A PV S
PV SCA P
s
V I R q
I I G N I
nN kT
(1)
In Eq. (1), Boltzmann’s constant (1.38 𝑥 10−19), temperature (K), array current (A), array voltage (V),
charge of an electron (1.6 𝑥 10−19), ideality factor, reverse saturation current of diode (A), array series
resistance (ohm), cell short-circuit current (A), solar insolation (𝑊 𝑚⁄ 2), number of modules in parallel,
number of series connected cells in a module and number of modules in series are denoted by k, T, 𝐼𝑃𝑉, 𝑉𝐴,
q, n, 𝐼0, 𝑅𝑆, , 𝐼𝑆𝐶, G, 𝑁𝑃, 𝑁𝐶𝑆, and 𝑁𝑆𝑀. Moreover, 𝐼𝑆𝐶𝐴(𝐺) can be described as multiplication of 𝑁𝑃 and
𝐼𝑆𝐶(𝐺), while 𝑁𝑆 are multiplication between 𝑁𝐶𝑆 and 𝑁𝑆𝑀 [4].
Converter Current Limit Network Interface Terminal Bus Converter Controller 1 1sTp
1 1sTq Converter
V
Ipcomd
I qcomd
Ki K p s Vreff V V -+ Ppv
Fig. 1. Dynamic model of PV generation.
North American Electric Reliability Corporation (NERC) and Western Electricity Coordination Council (WECC) have developed a dynamic model of PV generation. This model considered a dynamic model of the converter and the associated controller [17, 18]. The dynamic of MPPT is ignored as the MPPT is a logic algorithm. Hence, there is no dynamic that can be captured from the MPPT [19]. The dynamic model of the PV plant used in this paper is shown in Fig. 1, while the complete representation of large-scale PV plant can be found in [20].
2.2. PSS and Wide-Area POD Model
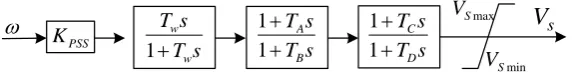
The dynamic model of PSS and POD is the same, the difference between those two controllers is the input signals, for PSS the input signal is coming from the local signal. Different from the PSS, wide-area POD utilizing a global signal or signal for far away from the location. The dynamic model of PSS and wide-area POD are illustrated in Fig. 2. The dynamic model of PSS and wide-area POD are consisting of a gain block, washout filter block and lead-lag block [21].
s T s T w w 1 max S V min S V s T s T B A 1 1 s T s T D C 1
1
V
sPSS
K
[image:3.595.113.487.290.458.2] [image:3.595.158.446.685.726.2]Each block has its function, the function of the gain block is to enhance the gain signal input so that the controller can achieve the requirement damping. The next block is the washout block, this block has a function as a high pass filter signal and providing the bias steady-state signal output of the controller. The last two blocks are a lead-lag block. This block is used as the provider of lead phase between automatic voltage regulator (AVR) with electric torque [21].
2.3. Power System Model
A set of differential and algebraic equations (DAE) is used to represent the power system for the oscillatory stability study. The representation of the power system is based on the needed. If only local phenomena that want to be analyzed, a simple single machine infinite bus can be used. If the interest is analyzing all the phenomena (local and global phenomena), the complete multi-machine power system should be used. In this paper, all the phenomena will be captured. Hence, the multi-machine power system is used in this paper. Mathematical representation of all power systems using DEA representation is presented in Eq. (2) and (3) [22].
, ,
x f x y u (2)
0g x y, (3)
In Eq. (2) and (3), state and algebraic variables are represented as x and y respectively. The differential equation is consisting of a machine and the associated controller. Moreover, the algebraic equation is comprised of load flow and other network equations [22].
2.4. Oscillatory Stability
The impact of oscillatory stability in power system performance could be very severe if this instability is not handled properly. If this instability is not handled properly, the oscillation may grow and lead to loss of synchronization of the power system. This loss of synchronization could make the power system experiencing partial and fully blackout. There are many incidents related to oscillatory stability problems such as in North India in 2012, Bangladesh 2014 at and in Paris in 2016 [23-25]. Analyzing oscillatory stability can be done through state-space representation by linearizing Eq. (2) and (3) around certain operating conditions as described in Eq. (4) and (5) [25].
ΔxA xΔ B uΔ (4)
ΔyC xΔ D uΔ (5)
Output matrix, feedforward matrix, vector of state variables, vector of algebraic variables, input vector, plant matrix, and input matrix are denoted by C, D, Δx, Δy, Δu, A, B as shown in Eq. (4) and (5). The stability of the system can be investigated by using eigenvalue. The system can be categorized as a stable condition if all of the real parts of the eigenvalue are in a left-half plane or have a negative value. The eigenvalue of the system can be found by using Eq. (6) [26].
det IA 0 (6)
In Eq. (6), eigenvalue and identity matrix are denoted by λ and I. Furthermore, to investigate the frequency oscillation and how damped the system Eq. (7), (8) and (9) can be used [27].
i i j i
(7)
2
i i
f Hz
(8)
2 2
i
i i
In Eq. (7), (8), and (9), frequency oscillation, how damped the system (damping ratio), real parts of eigenvalue and imaginary parts of eigenvalue are denoted by f, ξ, σ, and ω. Moreover, to investigate which state variable contributes to certain oscillation, participation analysis can be used. Participation factor can be expressed by Eq. (10), where right and left eigenvector are denoted by and [28].
ij ij ij
P (10)
3.
Simultaneous Parameter Tuning using FPA
3.1. Flower Pollination Algorithm
Flower pollination algorithm (FPA) is an algorithm developed by Dr. Xin She Yang that inspired by the flower pollination phenomena. This algorithm consists of four important rules. The first rule is biotic pollination and cross pollination. Those two are described as global pollination procedures with pollen-carrying pollinators doing the Levy flights. The second rule is the local pollination can be described as self pollination and abiotic process. The third rule is the similarity of two flowers is proportional to the probability of the reproduction. Furthermore, reproduction probability is defined as the flower constancy. The last rule is in the overall pollination activities, the physical proximity and other factors such as wind can have a significant factor. Moreover, switch probability could be used to control the local and global pollination [29]. For simplicity purposes, it is assumed that each plant only has one flower. Moreover, each flower could only produce one pollen gamete. Hence, a flower and or a pollen gamete can be described as a solution xi. From all the statements above, it can be stated that there are two important keys in FPA namely local and global pollination. At the global pollination step, pollen from flowers is carried by pollinating animals such as insects. Moreover, the pollen can travel in a long distance due to the insect that can move in large areas. This long travel pollen can ensure the reproduction and pollination get the optimal results. These optimal results can be denoted as g*. By considering this process, the first rule including the flower constancy can be presented
as described in Eq. (11) [29].
1
*
t t t
i i i
x x L x g (11)
In Eq. (11), the current best solution, solution vector, pollen, strength of the pollination and the iteration are denoted by g*, x, i, L, t. To mimic the movement of the insect, levy flight function can be used. Hence, the
mathematical representation of L can be described as Eq. (12) [29].
0 1
( ) sin 1 2
~ , 0
L s s
s
(12)
In Eq. (12), standard gamma function and the constant value used in this algorithm are denoted by
( )
and
. Furthermore, the local pollination phenomena including the flower constancy can be described in Eq. (13) [29].
1
t t t t
i i j k
x x x x (13)
In Eq. (13), pollen from the different flowers of the same plant species is denoted by t j
x
and t kx . Generally,
3.2. Objective Function
A specific objective function is used in this paper. The objective function is called as a comprehensive damping index (CDI). This objective function is to make sure that all damping on the system is have a high value. The mathematical representation of CDI can be described using Eq. (14) [30].
1 (1 ) n i i CDI
(14)Subjet to:
10 ≤ 𝑇𝑤𝑝𝑠𝑠, 𝑇𝑤𝑝𝑜𝑑≤ 20
0.05 ≤ 𝑇1, 𝑇2, 𝑇3, 𝑇4≤ 0.1
5 ≤ 𝐾𝑝𝑠𝑠≤ 20
50 ≤ 𝐾𝑝𝑜𝑑≤ 100
(15)
From Eq. (14), it can be seen that if the value of CDI is small, the damping of the system is high. Hence, the FPA will always try the minimum value of CDI to enhance the damping performance of the system. Furthermore, constraint related to minimum damping (5%) and the real parts of the eigenvalue is always minus are used in this objective function [30].
3.3. Controller Design Procedure
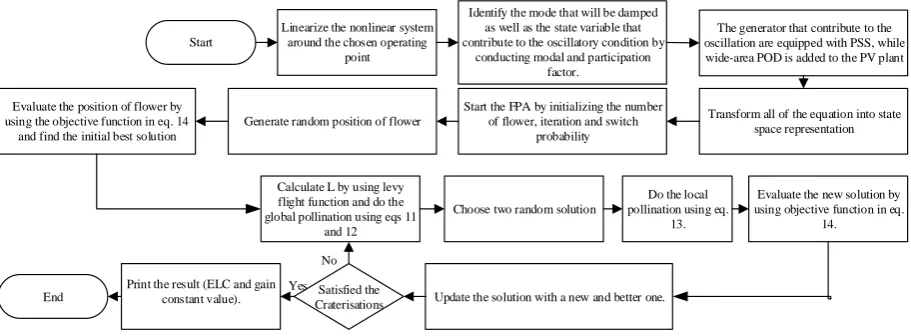
[image:6.595.70.526.402.570.2]The procedure for designing the controller using a flower pollination algorithm can be described by using Fig. 3.
Start
Linearize the nonlinear system around the chosen operating
point
Identify the mode that will be damped as well as the state variable that contribute to the oscillatory condition by
conducting modal and participation factor.
The generator that contribute to the oscillation are equipped with PSS, while wide-area POD is added to the PV plant
Transform all of the equation into state space representation
Calculate L by using levy flight function and do the global pollination using eqs 11
and 12
Start the FPA by initializing the number of flower, iteration and switch
probability Generate random position of flower
Evaluate the position of flower by using the objective function in eq. 14
and find the initial best solution
Do the local pollination using eq.
13. Choose two random solution
Evaluate the new solution by using objective function in eq.
14.
Update the solution with a new and better one. Satisfied the
Craterisations Print the result (ELC and gain
constant value). End
No
Yes
Fig. 3. Flowchart of designing PSS and POD using FPA.
4.
Results and Discussions
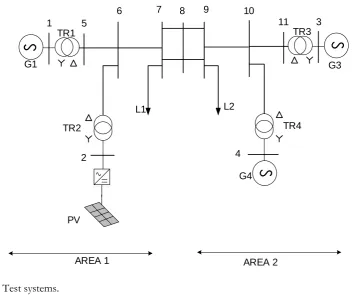
To evaluate the FPA for the tuning parameter of PSS and wide-area POD simultaneously (proposed method), the two-area “Kundur” power system is used as the test systems as shown in Fig. 4. For the simulated future scenario of power system with high penetration of RESs, a modification has been made to the two-area power system by displacing one conventional generator in area 1 (G2) with a large-scale PV plant with 350 MW capacity. Furthermore, as analyzing from the participation factor, the dominant contributor of the oscillation is coming from G1 and G4. Hence, PSS is installed in both generators, while the signal input of wide-area POD in the PV plant is the rotor speed deviation in G1. MATLAB/SIMULINK environmental is used for simulating the problems.
scenario is the system with PV generation considering wide-area POD and PSS uncoordinated. The last scenario is the system with PV generation considering wide-area POD and PSS simultaneously tuning by FPA (the proposed method).
S
S
S
L1 L2
1 5
6 7
PV
G4
G3 G1
3 10
2 4
8 9
11
AREA 1 AREA 2
TR1
TR2 TR4
TR3
Fig. 4. Test systems.
4.1. Case Study 1
Observation of eigenvalue and damping performance of electromechanical (EM) mode are performed in the first case study in an attempt to analyze the performance of the system with the proposed method. Table 1 shows the eigenvalue performance under different scenarios. It is noticeable that by installing wide-area POD in large-scale PV plant the eigenvalue of inter-area us move toward the left-half plane (Scenario 1). It is also noticeable that the local mode area 1 eigenvalue is also moved toward the left-half plane. However, the movement is not that significant (Scenario 2). It is also found that the eigenvalue movement of the system with PSS only (Scenario 3) is relatively high for local mode area 1 and inter-area mode. Furthermore, by employing both PSS and wide-area POD into the system (Scenario 4) the eigenvalue of local mode area 1 and inter-area mode value is more minus than Scenario 3. Moreover, the local mode area 2 remains in its position for Scenario 1 until 4. The best value is performed when using FPA for simultaneously tuning the PSS and wide-area POD parameter (Scenario 5). In Scenario 5, all the eigenvalues have the best negative value compared to the other scenario. It is also found that the eigenvalue of local mode area 1 is becoming a real part only. It means that oscillation in local mode area 1 is completely disappeared.
Table 1. Eigenvalue comparison under different scenario.
Scenario Local 1 Local 2 Inter-area
[image:7.595.101.454.127.422.2] [image:7.595.71.527.656.744.2]As reported by the International Council on Large Electric Systems (CIGRE) for oscillatory stability study, the minimum damping performance that allowed in the system is in the range of 3%-5% [31]. Hence, in this paper, the minimum requirement for damping performance is 5%. It means that, if there are modes that have a damping value of less than 5%, the modes can be categorized as a critical mode. In the critical mode, the condition system is vulnerable to become unstable. Figure 5 illustrates the damping performance of the investigated test system. It is found that the best damping performance is provided in Scenario 5. It is also found that the damping performance of local mode in area 1 for scenario 5 is 100%. It means that the oscillation of local mode area 1 is completely damped. It also noticeable that damping performance of local mode 2 and inter-area mode enhances significantly by employing the proposed method. The local mode area 2 damping is increased from 4.85% to 13.56%, while the inter-area mode damping is increased from 1.65% to 98.29%.
Fig. 5. Damping comparison under different scenario.
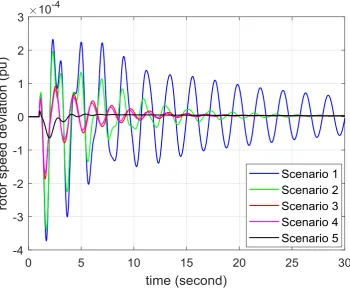
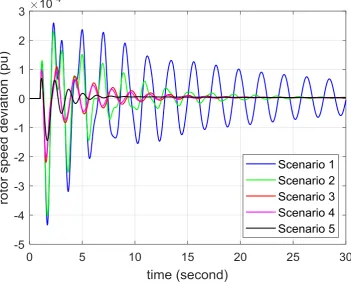
Fig. 6. G1 rotor speed response under different scenario.
[image:9.595.123.473.82.367.2] [image:9.595.124.475.405.694.2]Fig. 8. G4 rotor speed response under different scenario.
4.2. Case Study 2
In the second case study, observation of the eigenvalue and damping ratio under different loading conditions is considered. Three different loading condition is used in an attempt to investigate the proposed method. The first loading condition is a light loading operating condition. In the light operating condition, the total load demand is decreased by up to 25% of the total load demand. The second loading condition is the medium loading condition. In this loading condition, the loading condition in Scenario 5 is used. The last loading condition is a heavy loading condition. In the heavy loading condition, the load demand is increased to 50% of the total load demand.
Table 2. Eigenvalue comparison under different loading condition.
Item Local 1 Local 2 Inter-area
Light -5.9995+2.7851i -0.6263+4.6137i -1.3610+0.1975i Medium -7.9919 -0.6451+4.7119i -1.2201+0.2287i Heavy -7.4734+2.7163i -0.6286+4.5894i -1.3146+0.2278i
Table 3. Damping comparison under different loading condition.
Item Local 1 Local 2 Inter-area
Light 90.70 13.45 98.96
Medium 100 13.56 98.29
Heavy 99.41 13.57 98.53
[image:10.595.122.474.85.368.2] [image:10.595.71.524.554.613.2] [image:10.595.71.523.650.709.2]still above the minimum damping requirement (5%). Hence, it can be stated that the system could maintain a stable condition under the load demand variation.
5.
Conclusions
This paper proposed a method for solving oscillatory stability due to the integration of large-scale PV plant by using simultaneous parameter tuning of PSS and wide-area POD in PV plant. From the investigated study cases. It is found that the proposed method can enhance the oscillatory stability of the power system significantly even though 1 conventional generator has been replaced by a PV plant. It is also found that one of the EM modes is completely damped by using the proposed method.
Further research needs to be conducted by considering two types of RESs (PV and Wind) for investigating the significant impact of integrating inertia-less power plant. Moreover, including the time delay effect of the controller in designing the FPA could also be considered as further research.
References
[1] N. Yorino, M. Abdillah, Y. Sasaki, and Y. Zoka, “Robust power system security assessment under uncertainties using bi-level optimization,” IEEE Transactions on Power Systems, vol. 33, no. 1, pp. 352-362, 2018.
[2] H. Setiadi, A. U. Krismanto, and N. Mithulananthan, “Influence of BES system on local and inter-area oscillation of power system with high penetration of PV plants,” in Applied System Innovation (ICASI),
2017 International Conference on, 2017, pp. 1-4.
[3] H. Gu, R. Yan, and T. K. Saha, “Minimum synchronous inertia requirement of renewable power systems,” IEEE Transactions on Power Systems, vol. 33, no. 2, pp. 1533-1543, 2017.
[4] R. Shah, N. Mithulananthan, and K. Y. Lee, “Large-scale PV plant with a robust controller considering power oscillation damping,” IEEE Transactions on Energy Conversion, vol. 28, no. 1, pp. 106-116, 2013. [5] H. Setiadi, A. U. Krismanto, N. Mithulananthan, and M. Hossain, “Modal interaction of power systems
with high penetration of renewable energy and BES systems,” International Journal of Electrical Power &
Energy Systems, vol. 97, pp. 385-395, 2018.
[6] H. Setiadi, N. Mithulananthan, and M. J. Hossain, “Impact of battery energy storage systems on electromechanical oscillations in power systems,” in 2017 IEEE Power & Energy Society General Meeting, 2017, pp. 1-5.
[7] N. Mithulananthan, C. A. Canizares, J. Reeve, and G. J. Rogers, “Comparison of PSS, SVC, and STATCOM controllers for damping power system oscillations,” IEEE Transactions on Power Systems, vol. 18, no. 2, pp. 786-792, 2003.
[8] R. Shah, N. Mithulananathan, and K. Y. Lee, “Design of robust power oscillation damping controller for large-scale PV plant,” in 2012 IEEE Power and Energy Society General Meeting, 2012, pp. 1-8.
[9] S. Mehri, M. Shafie-khah, P. Siano, M. Moallem, M. Mokhtari, and J. P. S. Catalão, “Contribution of tidal power generation system for damping inter-area oscillation,” Energy Conversion and Management, vol. 132, pp. 136-146, 2017.
[10] L. A. Bewoor, V. C. Prakash, and S. U. Sapkal, “Production scheduling optimization in foundry using hybrid Particle Swarm Optimization algorithm,” Procedia Manufacturing, vol. 22, pp. 57-64, 2018.
[11] R. d. B. Araújo and A. A. R. Coelho, “Filtered predictive control design using multi-objective optimization based on genetic algorithm for handling offset in chemical processes,” Chemical Engineering
Research and Design, vol. 117, pp. 265-273, 2017.
[12] Y. Yao, Y. Hong, D. Wu, Y. Zhang, and Q. Guan, “Estimating the effects of “community opening” policy on alleviating traffic congestion in large Chinese cities by integrating ant colony optimization and complex network analyses,” Computers, Environment and Urban Systems, vol. 70, pp. 163-174, 2018. [13] W. S. Sakr, R. A. El-Sehiemy, and A. M. Azmy, “Optimal allocation of TCSCs by adaptive DE
algorithm,” IET Generation, Transmission & Distribution, vol. 10, no. 15, pp. 3844-3854, 2016.
[14] M. Abdillah, H. Setiadi, A. B. Reihara, K. Mahmoud, I. W. Farid, and A. Soeprijanto, “Optimal selection of LQR parameter using AIS for LFC in a multi-area power system,” Journal of Mechatronics, Electrical
[15] H. Setiadi and K. O. Jones, “Power system design using firefly algorithm for dynamic stability enhancement,” Indonesian Journal of Electrical Engineering and Computer Science, vol. 1, no. 3, pp. 446-455, 2016.
[16] R. Peesapati, V. K. Yadav, and N. Kumar, “Flower pollination algorithm based multi-objective congestion management considering optimal capacities of distributed generations,” Energy, vol. 147, pp. 980-994, 2018.
[17] WEC Council, “WECC guide for representation of photovoltaic systems in large-scale load flow simulation,” WECC Renewable Energy Modeling Task Force Report, 2010.
[18] NERC, “Standard models for variable generation,” in NERC Special Report, Atlanta, GA, 2010. [19] H. Setiadi, A. U. Krismanto, and N. Mithulananthan, “Enabling BES in large PV plant for stability
enhancement on power systems with high RES,” in 2017 IEEE Innovative Smart Grid Technologies-Asia
(ISGT-Asia), Auckland, New Zealand, 2017.
[20] K. Clark, N. W. Miller, and R. Walling, “Modelling of GE solar photovoltaic plants for grid studies,” Schenectady, NY: General Electrical International, Inc., 2010.
[21] D. Lee, IEEE Recommended Practice for Excitation System Models for Power System Stability Studies, (IEEE Std
421.5-2005). Energy Development and Power Generating Committee of the Power Engineering Society,
2005.
[22] D. Lastomo, H. Setiadi, and M. R. Djalal, “Optimization of SMES and TCSC using particle swarm optimization for oscillation mitigation in a multi machines power system,” Journal of Mechatronics, Electrical
Power, and Vehicular Technology, vol. 8, no. 1, pp. 11-21, 2017.
[23] entsoe, “Analysis of CE inter-area oscillations of 1st December 2016,” European Network of Transmission System Operators for Electricity, ENTSO-E SG SPD Report, 2017.
[24] G. Rogers, Power System Oscillations. Springer Science & Business Media, 2012.
[25] R. S. Wijanarko, H. Setiadi, and T. A. Nugroho, “Coordination of SPS and CES to mitigate oscillatory condition on power systems,” TELKOMNIKA (Telecommunication Computing Electronics and Control), vol. 15, no. 4, 2017.
[26] H. Setiadi, N. Mithulananthan, A. U. Krismanto, and R. Shah, “Low-Frequency Oscillatory Stability Study on 500 kV Java-Indonesian Electric Grid,” in Industrial Electronics (ISIE), 2018 IEEE 27th
International Symposium on, 2018.
[27] H. Setiadi, N. Mithulananthan, A. U. Krismanto, and R. Shah, “Comparison of battery energy storage model for small signal stability in power systems,” in Industrial Electronics (ISIE), 2018 IEEE 27th
International Symposium on, 2018.
[28] A. U. Krismanto and N. Mithulananthan, “Identification of modal interaction and small signal stability in autonomous microgrid operation,” IET Generation Transmission & Distribution, vol. 12, no. 1, pp. 247-257, 2017.
[29] X.-S. Yang, “Flower pollination algorithm for global optimization,” in International conference on
unconventional computing and natural computation, 2012, pp. 240-249.
[30] A. El-Zonkoly, A. Khalil, and N. Ahmied, “Optimal tunning of lead-lag and fuzzy logic power system stabilizers using particle swarm optimization,” Expert Systems with Applications, vol. 36, no. 2, pp. 2097-2106, 2009.