This is the
Accepted Version
of a paper published in the
journal: Culture and Organization
Anwara, Sajid, and Sun, Sizhong (2015) Can the presence of foreign investment affect the capital structure of domestic firms? Journal of Corporate Finance, 30.
pp. 32-43.
http://dx.doi.org/10.1016/j.jcorpfin.2014.11.003
© 2015. This manuscript version is made available under
the CC-BY-NC-ND 4.0
Can the presence of Foreign Investment Affect the Capital Structure of Domestic Firms?
Sajid Anwar
Faculty of Arts and Business University of Sunshine Coast Email: sanwar@usc.edu.au
Sizhong Sun
College of Business, Law and Governance James Cook University
Email: sizhong.sun@jcu.edu.au
Abstract
Based on the existing literature, this paper argues that an increase in foreign presence can affect the leverage of domestic firms. We develop a simple theoretical model in which the presence of foreign firms leads to a productivity spillover effect to domestic firms. This spillover effect can be negative, positive or zero. The model is used to show that an increase in foreign presence increases (decreases) the level of debt, as well as the level of investment of domestic firms, if the productivity spillover effect is positive (negative). We apply the model to explore the link between foreign presence and leverage with firm-level panel data from China. The empirical estimation, using Instrumental Variable Tobit regression, reveals that, in overall terms, the impact of foreign presence on the leverage of domestic firms in China's manufacturing sector is negative. We find that the negative impact on the leverage of privately owned firms is large relative to state-owned firms. Furthermore, we find that the impact of foreign presence on leverage varies from industry to industry, which is consistent with the presence of heterogeneity in the productivity spillover effect.
1. Introduction
International business researchers, such as Dunning (1988), argue that foreign firms
possess significant advantages over domestic firms and hence foreign direct investment (FDI)
in a country can affect the output of domestic firms. FDI affects the output of domestic firms
directly as well as indirectly through FDI-linked spillover effects. The entry of foreign firms
increases competition in the domestic market which can affect the profitability of domestic
firms. Increased competition can also restrict the growth opportunities of domestic firms.1
Profitability and growth opportunities are important determinants of firm capital structure
(Céspedes, González and Molina, 2010; Margaritis and Psillaki, 2010 and Kayo and Kimura,
2011).2 Brander and Lewis (1986) made an important contribution to the related literature by
demonstrating that the output and financial structure decisions of firms are interconnected.
Recent studies, such as Campello (2006), have emprically evaluated the link between firm
product market performance and financing decisions. Campello argues that debt financing
does not always hurt a firm’s product market performance; moderate debt can contribute to
an increase in market share.
Given that (i) the output and financial structure decisions of firms are interconnected
and (ii) firm output is affected by FDI, it can be argued that the presence of foreign firms in a
country, through the related spillovers, can also affect firm capital structure. For example,
due to an increase in foreign presence, domestic firms may shift to debt financing because
raising equity is too difficult. In other words, based on the finance and international
business/economics literature, there seems to be a clear link between the presence of foreign
1 A large number of studies including Görg and Greenaway (2004), Branstetter (2006), Buckley, Clegg and Wang (2007), Haskel, Pereira and Slaughter (2007), Liu (2008) and Meyer and Sinani (2009) support this view.
firms and the capital structure of domestic firms. However, none of the existing studies has
formally explored this link.
This paper makes two distinct contributions to the existing literature. First, using a
simple theoretical model, where firms aim to maximize their value and the presence of
foreign firms gives rise to productivity spillovers to domestic firms, we show that the
presence of foreign firms can also affect the capital structure of domestic firms. Second,
using firm level panel data from China’s manufacturing sector, the link between foreign
presence and the capital structure of domestic firms is empirically evaluated. Specifically, we
show that an increase in foreign presence increases both the optimal debt level and
investment of domestic firms, only if the productivity spillover effect is positive. However, in
the presence of a negative productivity spillover effect, an increase in foreign presence
decreases the optimal debt level as well as investment. Because foreign presence can increase
(or decrease) both debt and investment, its impact on the leverage of domestic firms cannot
be unambiguously determined. We explore this link by means of an empirical study. Based
on the theoretical model, an empirical model is specified. The empirical model is estimated
making use of firm level panel data over the period 2000-2007 from China.
Our empirical work is focused on China because China is one of the largest recipients
of FDI and the Chinese economy is rapidly growing. Since the opening up of the Chinese
economy in the late 1970s, the Chinese capital market has gone through significant changes.
As noted by Chen (2004), compared to most western firms, Chinese firms make greater use
of retained earnings for business finance. Recent figures suggest a shift away from this in
favor of equity finance and hence our empirical study is based on a relatively recent dataset.
In 2011, 282 new companies listed on the stock market raising US$45.3 billion in new equity
big improvement over 2009 when only 99 companies were listed raising US$29.6 billion).3
Private equity is emerging as an important source of funds for China’s small and
medium-sized companies (Perkowski, 2012). China’s economic landscape is rapidly changing. For
example, China has recently allowed a number of foreign institutions to invest in its capital
market. The new rules allow selected international fund managers to invest a combined total
of US$80 billion in China. China has also decided to extend Chinese currency loans to some
emerging nations. The success of this and related measures depends on strong banks. The
Chinese banking system, with a cap on deposit rates, guarantees significant profits. Chinese
banks are state-owned and a strong banking system cannot be established unless steps are
taken to reduce the monopoly power of state-owned banks (Financial Times, 2012 & Pierson,
2012).
Chen (2004), Chen and Strange (2005), Huang and Song (2006), Qian, Tian and
Wirjanto (2009), Li, Yue and Zhao (2000), among others, have considered the determinants
of capital structure in China.4 However, none of these studies has considered the impact of
the presence of foreign firms. The empirical analysis presented in this study is based on a
comprehensive dataset that covers over 85 per cent of the total industrial output of China.
Such an extensive dataset allows one to appropriately measure the presence of foreign firms.
One of the reasons why the earlier studies have not empirically examined the impact of the
presence of foreign firms on firm capital structure may be that the dataset available was not
sufficiently large. Earlier studies on China have suggested that the financing decisions of
private and state-owned firms can be very different. Accordingly, we also separately examine
the impact of foreign presence on the capital structure of (a) privately owned and (b) state and
3 Keister (2004) suggests that economic transition in China forced a large number of Chinese firms to reduce their reliance on loans from state-owned banks. An (2012) argues that taxation can also affect firm capital structure.
collectively owned firms. As financing decisions may vary across Chinese industry sectors,
this paper also separately considers the case of the (i) textile industry, (ii) transportation
equipment manufacturing industry, (iii) electrical machinery and equipment manufacturing
industry and (iv) communication equipment, computer and other electronic equipment
manufacturing industry. The choice of these industries is mainly dictated by data availability.
The empirical results are based on Tobit and Instrumental Variable Tobit estimations. Our
empirical analysis suggests that foreign presence decreases the leverage of domestic firms in
China’s manufacturing sector. We find that the negative impact on the leverage of privately
owned firms is relatively large. Furthermore, the impact of foreign presence on the leverage
of domestic firms varies from industry to industry.
The rest of the paper is organized as follows. A theoretical model that shows the link
between the presence of foreign firms and firm capital structure is presented in section 2.
Based on the theoretical model, an empirical model is specified in Section 3. This section
also includes a discussion of the data. The empirical results are presented in Section 4 and
Section 5 contains some concluding remarks.
2. Firm Leverage and Foreign Presence: A Theoretical Model
By making use of a simple theoretical model that combines elements of finance
theory and international business, the aim of this section is to establish a link between the
presence of foreign firms and firm capital structure.
Consider an industry where is the proportion of foreign firms. A representative
domestic firm with wealth W raises debt
D to finance an investmentIat time 0, which is used in production at time 1. As everything is measured in real values and the magnitude ofprocess. f I( ) Ae I is the firm production function, where e captures the size of foreign presence and the resulting spillovers to domestic firms. Specifically, 0means that there
are no foreign firms in the industry and hence there is no productivity spillover effect,
whereas 1 implies that all firms are foreign. As this paper focuses on the impact of foreign
presence on the leverage of domestic firms and the dataset used in our empirical analysis
contains a large number of foreign firms, we assume that 0 1. In other words, there is
foreign presence but not all firms in the industry are foreign. As discussed earlier, the
presence of foreign firms leads to productivity spillovers to domestic firms. The parameter
captures the sign of such spillovers. 0 implies the presence of positive spillovers,
whereas 0means that the presence of foreign firms does not generate any spillovers to
domestic firms. 0 captures the idea of negative spillovers, where the presence of foreign
firms reduces the productivity of domestic firms. In other words, the sign of captures the
heterogeneity of the impact of foreign presence on domestic firms located in different
industries. The degree of this impact depends on a number of factors, including the distance
to the world technology frontier. Acemoglu, Aghion and Zilibotti (2006) and Aghion et al.
(2009), among others, show that domestic firms in industries that are far away from the
technological frontier are negatively affected by the entry of foreign firms, while firms in
industries that are closer to the frontier enjoy positive productivity spillover effects. In our
theoretical model, a positive value of suggest that the presence of foreign firms is a source
of positive externality (i.e., as the proportion of foreign firms increases, the domestic firms
experience a higher level of positive externality). The positive externality arises from
spillovers that result from, among other things, the introduction of new technology and
At time 2, a random cash flow x is realized and the debt (D) is payable. The
randomness of cash flow x is due to market uncertainty and x is uniformly distributed over the support
0,a .If the firm defaults, a deadweight cost of C is incurred. The firm’s problem is to choose the level of debt (D) and investment (I) to maximize its value, as follows:Maximise with respect to &
a
D
x D
Ae I dx I D
a
0
Subject to +
D a
D
x C D
I W dx dx
a a
By solving the above optimization problem5, the optimal level of debt can be derived as follows:
1 1
Ae a C a Ae
D a C
Ae Ae
(1)
Equation (1) shows that, irrespective of the value of, there is a one-to-one and
positive relationship between debt and the uncertain cash flow. In other words, as the
maximum possible cash flow
i.e., a
increases, domestic firms are more likely to opt for a higher level of debt. Investment decisions are based on potential cash flows. As the maximumpossible cash flow increases, investors would be more willing to take on extra debt. Equation
(1) also shows that an increase in the debt default cost
i.e., C
discourages debt since if β ≥ 0, A > 1 and if β < 0, A > e-β. If the debt default cost is zero then the optimal debt equals themaximum possible cash flow
i.e., as C0, Da
. Because1 Ae Ae
is always greater
than one, the optimal debt is positive only if aC.6 In other words, the debt default cost
cannot be greater than (or equal to) the maximum possible cash flow.
Equation (1) can be used to establish a relationship between foreign presence and the
optimal debt of a domestic firm as follows:
21
D Ae C
Ae
(2)
Equation (2) shows the impact of an increase in foreign presence on the optimal debt
of a domestic firm depends on the sign of productivity spillover effect
i.e.,
. An increasein foreign presence in the industry increases the optimal debt of a domestic firm only if
productivity spillover effect is positive
i.e., 0
. Equation (2) also suggests that the debtdefault cost plays a crucial role. If the debt default cost was lower, foreign presence would
lead to a smaller increase in optimal debt provided that 0. A positive productivity
spillover effect implies that an increase in foreign presence leads to an increase in the
productivity of the domestic firms, which improves profitability. A large number of existing
studies, such as Meyer and Sinani (2009), have confirmed the presence of such a positive
productivity spillover effect. An increase in profitability also increases the firm’s capacity to
take on extra debt. However, in the presence of a negative productivity spillover effect, an
increase in foreign presence reduces the productivity of domestic firms which contributes to a
decrease in their ability to take on debt. Finally, equation (2) suggests that in the absence of
productivity spillover effect, an increase in foreign presence would have no effect on the
optimal debt of domestic firms.
We now turn our attention to the impact of foreign presence on investment of
domestic firms. Using the constraint
0
i.e., +
D a
D
x C D
I W dx dx
a a
, the relationshipbetween debt and investment can be written as follows:
2
2
D a C
I W D
a a
By differentiating equation (3) with respect to, the relationship between foreign
presence and optimal investment can be derived as follows:
3 21 1
a C D
I D C D Ae
C
a a Ae a Ae
(4)
Given thatA1 and 0 (namely the productivity spillover effect is positive), equation (4) suggests that an increase in foreign presence increases firm investment.
However, in the presence of negative productivity spillovers, an increase in foreign presence
decreases firm investment. Because, foreign presence increases (or decreases) both debt and
investment, the impact on firm leverage i.e.,D I
is not immediately clear.
The link between foreign presence and leverage of domestic firms can be further
explored by re-writing equation (4) in terms of percentage change as
a C
DI D D
I a D I
The above expression is the elasticity of investment with respect to foreign presence. Using
equation (1), the impact of a change in foreign presence on firm leverage in percentage terms
can be written as
1 1 D D I I
D D I
I
a C D D D
a I D
C a Ae
1
Equation (5) shows that the impact of an increase in foreign presence on firm leverage
depends on the debt default cost, maximum possible cash flow and other factors. From
equation (5), we can characterize the impact of foreign presence on domestic firms’ leverage
in the following proposition:
Proposition 1: (a) If there exists no productivity spillovers from foreign investment (namely β = 0), foreign investment does not affect domestic firms’ optimal leverage (namely
0 D I
); (b) If foreign investment positively affects domestic firms’ productivity
(namely β > 0), it also positively affects domestic firms’ optimal leverage if firm productivity
is sufficiently high (namely 0 D I
, if A > 2) 7; (c) If there exists negative productivity
spillovers, the foreign investment negatively affects domestic firms’ optimal leverage, given
that firm productivity is sufficiently high (namely 0 D I
, if A > 2e-β).
Proof: Equation (5) suggests that the sign of D
I
depends on two terms:
1
1
C D
I a Ae
and D
. For case (a) where β = 0, equation (2) indicates that
0 D
. Therefore 0
D I
. For case (b) where β > 0, 0
D
from equation (2). Let
1
1
D C D
f
I a Ae I
. Note that the function f is a decreasing function of
D I ,
where 0 D 1 I
. Thus
1 2 2
1 1
1 1
1 1
a Ae C
D C Ae A
f f
I a Ae a Ae Ae Ae
, where second
inequality is obtained by applying the condition of a > C, and the third inequality is obtained by the fact that β > 0, 0 ≤ γ ≤1, and the term eβγ is an increasing function of γ. Hence, if A > 2,
0 D f I
, which together with 0
D
suggests 0
D I
. Regarding case (c) where β <
0, equation (2) indicates D 0
. Similar to case (b),
1 2 2
1 1
1 1
1 1
a Ae C
D C Ae Ae
f f
I a Ae a Ae Ae Ae
, where the third
inequality is obtained by the fact that β < 0, 0 ≤ γ ≤1, and the term eβγ is a decreasing function
of γ. Subsequently if A > 2e-β, 0 D I .
Given Proposition 1, the next step is to estimate this relationship using data from a
real economy. In this paper, we use firm level panel data from China to empirically evaluate
the relationship between firm leverage and foreign presence.
Using equations (1) and (3), the optimal value of firm leverage can be written as
follows:
2
21
1
1 1
2
Ae Ae a C a
D
a C I
Ae a C a Ae Ae a C a W Ae
Equation (6) suggests that there is a relationship between foreign presence and firm
leverage and this relationship is sensitive to fluctuations in factors that include the maximum
cash flow and debt default cost. As all of these factors and the parameters of the production
function cannot be observed in real life, we empirically evaluate the relationship between
foreign presence and leverage by means of an empirical model.
The theoretical results presented in the above are based on an analysis of a
representative (or an average) firm. In the presence of positive FDI-linked spillover effects,
Proposition 1 suggests that an increase in the presence of foreign investment leads to an
increase in the optimal leverage if domestic firms are sufficiently productive. If domestic
firms are not productive enough (namely A <2), the impact of foreign investment can be
negative. In particular, an increase in foreign presence increases the productivity of domestic
firms, which increases their profitability. An increase in profitability encourages other
domestic firms to enter the industry, which increases the level of competition for debt and
hence the impact on leverage can be negative if domestic firms themselves are not strong
enough (i.e. less productive)8. As in equation (5), the impact of a change in the level of
foreign investment on the capital structure of domestic firms (depending on the size of
foreign investment-linked spillover effects and its impact on profitability) can vary from
industry to industry. Accordingly, the empirical analysis presented in this paper also
considers the link between foreign presence and firm capital structure in different industries.
In order to empirically evaluate the impact of foreign presence on the leverage of
domestic firms, using Taylor’s expansion, we linearize equation (6) at
A C W0, 0, 0,0
which yields equation (7) as follows: 9leverage 0 1A2C3W 4 (7)
where , ,
, , , and y denotes the functional form of
equation (6).
Based on equation (7), the following empirical model can be specified, where fpitis foreign presence in industryi at timet.
leverageit 0 1Xit2fpit 3dindustryi4dyeart it (8)
Equation (8), which is based on equation (7), suggests that A, C, and W depend on a set of firm characteristics
X . As we plan to estimate the model by using firm level panel data, industry dummies (dindustry) and year dummies (dyear) have been included in equation (7). Finally, we also add an error term
it to capture the impact of all omitted variables. Theerror term is assumed to be i.i.d. normal. Equation (8), which is our empirical model, is further discussed in the following section.
3. Empirical Model and Data
9 Since a number of existing studies, such as Liu (2008), have confirmed the presence of a positive spillover effect to domestic firms in China’s manufacturing sector, in order to focus on the impact of a change in foreign presence on leverage, we do not explicitly estimate β.
0 0 0 0
0 1 0 2 0 3 0 40 , ,
y A C W A C W
0 0 0, ,
1 W C A A y 0 0 0 0, , ,
2 W C A C y 0 0 0 0, , ,
3 W C A W y 0 0 0 0, , ,
The theoretical model presented in Section 2 shows that firm capital structure depends
on a number of factors including foreign presence. Equation (7) includes X which is a vector
of control variables. These control variables consist of other determinants of firm capital
structure that have been identified in previous studies. These variables include firm size, firm
age, collateral value of assets, growth opportunities, non-debt tax shields, profitability,
business risk and ownership structure; dindustry is a set of two-digit industry dummies that control for industry fixed effects; dyear is a set of year dummies that captures the time variant effects. fp, which is the main variable of interest, captures the presence of foreign firms. The degree of foreign presence fp is the share of the assets of foreign firms within the four-digit industry classification as follows:10
i i F
j j J
y fp
y
where y is the firm’s total assets, F is the set of foreign firms in the industry whereas J is the set of all firms in the industry; F is a subset of J(i.e., F J).11
In order to address the issue of omitted variable bias, eight variables are included in
the vector of control variables. These variables are selected in an attempt to take into account
the agency and other costs arising from asymmetric information faced by stakeholders (i.e.,
the debt holders, equity holders and firm managers).
The first control variable is firm size, which is measured by the natural logarithm of
number of employees. Firm size can also be measured by the natural logarithm of firm
10 A firm is designated as a foreign firm if it has foreign capital. Such firms are also characterized as foreign-invested firms (see Meyers and Sinani, 2009 and references therein). In our sample, the share of foreign capital in more than 85% of the designated foreign firms is greater than 30 per cent. Furthermore, the proportion of foreign capital in over 75 per cent of the designated foreign firms is greater than 50 per cent.
assets.12 Compared with smaller firms, large firms tend to diversify their business and
therefore have a lower risk of default (Ferri and Jones, 1979; Rajan and Zingales, 1995),
which suggests a positive relationship between firm size and leverage. A number of
theoretical studies (Harris and Raviv, 1990; Narayanan, 1988; Noe, 1988; Poitevin, 1989;
Stulz, 1990) have suggested that firm leverage increases with firm size. Empirical studies
also tend to support this positive relationship, for example de Jong, Kabir and Nguyen
(2008), Wu and Yue (2009) and Kayo and Kimura (2011).
Firm age can also affect leverage. It has been suggested that older firms are likely to
have lower debt-related agency costs (Frank and Goyal, 2009), which leads to a higher
leverage ratio. Akhtar and Oliver (2009) report a positive relationship between firm age and
leverage, indicating that the former effect outweighs the latter (i.e., information asymmetry)
effect.
Just like firm age, the collateral value of assets (the tangibility of assets) exerts two
contrasting effects on firm leverage. Tangible assets can serve as collateral against external
loans (Scott, 1977). An increase in tangible assets can reduce the scope of asset substitution
(Bradley et al., 1984; Harris and Raviv, 1991; Titman and Wessels, 1988) and have a higher
liquidation value than intangible assets in case of bankruptcy (Fattouh et al., 2008; Huang and
Song, 2006). Accordingly, firms with higher tangible assets tend to have lower default costs
and fewer debt-related agency problems (Akhtar and Oliver, 2009), which in turn suggests a
positive relationship between tangible assets and leverage. Huang and Song (2006), Fattouh,
Harris, and Scaramozzino (2008) and Akhtar and Oliver (2009) found a positive relationship
between tangible assets and leverage. However, in the case of Chinese firms, Li, Yue and
Zhao (2009) reported a negative relationship between the two variables.
Growth opportunities represent non-collateralisable assets. Owing to the asset
substitution effect, a firm faced with high growth opportunities may find it hard to access
credit (Bradley et al., 1984; Titman and Wessels, 1988). Growth opportunities also affect
firm leverage through changing the agency costs. This effect arises from the conflict of
interest between debt and equity holders. Myers (1977) has suggested that firms with high
growth opportunities also experience high agency cost. A high growth firm may not issue
debt and thus have a low leverage ratio. In other words, the relationship between leverage and
growth opportunities can be negative (see Berens and Cuny, 1995). A number of existing
empirical studies have found a negative relationship between leverage and growth
opportunities (for example see de Jong, Kabir and Nguyen, 2008, Akhtar and Oliver, 2009
and Kayo and Kimura, 2001). However, Wu and Yue (2009) and Céspedes, González and
Molina (2010) found a positive relationship between growth opportunities and leverage.
Taxation is another factor that affects a firm’s choice of capital structure. DeAngelo
and Masulis (1980) show that non-debt tax shields substitute for the tax benefits of holding
higher debts and therefore a firm with higher non-debt tax shields tends to have lower
leverage. This negative relationship is confirmed by a majority of empirical studies; for
example, see Wald (1999) and Huang and Song (2006). Bradley, Jarrell and Kim (1984)
found the relationship between non-debt tax shields and leverage to be positive. The
empirical evidence provided by de Jong, Kabir and Nguyen (2008) is mixed; the relationship
between the average tax rate and leverage is positive in the case of some countries and
negative in the case of others.
Firm profitability is expected to affect leverage, but existing theories provide
contradictory predictions concerning the direction of the relationship (see Céspedes et al.,
2010).13 The pecking order theory (Myers, 1984) suggests that firms will first resort to
internally generated funds for financing investment and hence more profitable firms tend to
have a lower level of leverage. The tax-based models (DeAngelo and Masulis, 1980; Leland,
1994; Ross, 1977) suggest that highly profitable firms can borrow more to shield income
from corporate taxes, which predicts a positive relation between profitability and leverage.
Based on agency theories, it can be argued that debt can act as a disciplining device that
restrains the manager’s behavior (Jensen, 1986; Williamson, 1988) and hence highly
profitable firms should have more debt. On the other hand, treating the corporate capital
structure as a mechanism to alleviate the problem associated with the separation of ownership
from control, Chang (1999) shows that the optimal contract between the corporate insider and
outside investors can be interpreted as a combination of debt and equity and highly profitable
firms tend to have less debt. In contrast to these contradictory theoretical predictions,
empirical studies appear to have found a consensus. Studies such as Fattouh, Harris, and
Scaramozzino (2008), de Jong, Kabir and Nguyen (2008), Li, Yue and Zhao (2009) and Kayo
and Kimura (2011) found a significant negative relationship between profitability and
leverage.
The existing literature has also suggested that business risk (or the volatility of
earnings) can also affect capital structure. Generally speaking, it is expected that business risk
negatively affects the level of leverage (Booth et al., 2001; Burgman, 1996; Chen et al., 1997;
Demsetz and Lehn, 1985; Titman and Wessels, 1988).
The last variable included in the vector of control variables X is ownership; whether a firm is privately owned or state and collectively owned. Jensen and Meckling (1976) identify
two types of conflicts of interest, namely the conflicts between shareholders and managers
and those between shareholders and debtholders, and therefore the ownership structure is
(2005) and Huang and Song (2006), among others, found the relationship between ownership
and leverage to be statistically significant.14
3.1 The Data
We utilize a comprehensive data set from China’s National Bureau of Statistics. This
dataset accounts for over 85 per cent of China’s total industrial output from 2000 to 2007.
Similar datasets from the same source have been used by a number of existing studies. For
example Hu, Jefferson, and Qian (2005) have considered the issue of R&D and technology
transfer; Jefferson, Thomas, and Zhang (2008) have considered productivity growth and Sun
(2009) has considered the issue of export spillovers arising from FDI. We first clean the
dataset by excluding firms that (1) employ fewer than eight workers as they may not have
reliable accounting systems (Jefferson et al., 2008); (2) report negative net values of fixed
assets, negative employee wages, negative long term debt, negative total equity, negative
total assets, and negative annual depreciation; (3) report a long term debt to total assets ratio
higher than 1.15 Our aim is to avoid extreme outliers. In 2002-03, the Chinese Government
revised its industrial classification method. In order to remove this inconsistency from the
original dataset, we applied the 2002-03 industrial classification to the data prior to 2003.
Based on the cleaned dataset, we construct the dependent and explanatory variables.
Following Doukas and Pantzalis (2003) and Mitto and Zhang (2008), the dependent variable,
i.e., leverage, is computed as the ratio of long term debt to total debt and equity. Firm size is
measured by the natural logarithm of the number of employees. Firm age is the number of
years the firm has been operational. Following Friend and Lang (1988), the collateral value of
14 Margaritis and Psillaki (2010) have highlighted the importance of the links among capital structure,
ownership structure and firm performance. Céspedes, González and Molina (2010) focused on the link between ownership structure and firm capital stucture in Latin America. Furthermore, the recent work of Paligorova and Xu (2012) on determinants of leevrage also highlights the importance of firm ownership strucuture.
assets is calculated as the ratio of tangible assets to total assets. Following, Fattouh et al.
(2008), growth opportunities are measured by the annual percentage change in total assets.
Non-debt tax shields are defined as the total annual depreciation scaled down by total assets
(Bradley et al., 1984; Titman and Wessels, 1988). We measure profitability by the ratio of a
firm’s total profits to its total assets, and its standard deviation in the four digit industries is
used to proxy for business risk. Ownership is a dummy variable that takes a value of 1 if a
firm is privately owned. As indicated earlier, the presence of foreign firms is measured by the
share of the assets of foreign firms in the four digit industry16.
<insert Table 1 & 2 about here>
Table 1 presents the descriptive statistics for the entire sample. The correlation matrix
for the entire sample is presented in Table 2. The estimated correlation coefficients among
explanatory variables appear to be reasonably low.
4. Empirical Results and Discussion
In this section we present the estimation results. Since the dependent variable (i.e.,
leverage), is censored between 0 and 1, the Tobit regression method was used to estimate
equation (7). The model was estimated by making use of pooled data over a period of eight
years, clustered by firm to accommodate the problem of potential heteroskedasticity and
unspecified serial correlation within firms. However, it is possible that foreign firms tend to
enter an industry where firms have low leverage, or firms with low leverage are more likely
to be acquired by the foreign firms. In both cases, the presence of foreign firms in equation
(7) may be endogenous. To address the possible endogeneity issue, we employ the Tobit
model with instrumental variables, using Newey's minimum chi-squared estimator with the
one-year lagged presence of foreign firms and the number of firms in the four digit industries
as the instruments.17
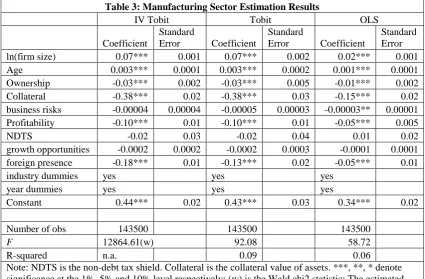
The estimated results are reported in Table 3. In order to facilitate a comparison,
estimated results from three estimation techniques are reported: (i) ordinary least square
(OLS), (ii) Tobit and (iii) instrumental variables Tobit (IV-Tobit). Except for the estimated
coefficient of foreign presence, the Tobit and the IV-Tobit estimation results are quite
similar. However, as far as magnitude of the estimated coefficients is concerned, the OLS
results are very different from the Tobit and IV-Tobit estimation. We tested the foreign
presence variable for exogeneity. The estimated value of the Wald statistic for exogeneity is
69.13 (with a p-value of 0.000). Based on the estimated p-value, it is possible to reject the null hypothesis of exogeneity with a very high degree of confidence. Accordingly, it can be
argued that IV-Tobit estimation is more appropriate and the discussion presented below is
based on the third estimation technique.
The estimated coefficient of foreign presence reported in Table 3 is negative and
highly significant suggesting that an increase in foreign presence reduces the leverage of
domestic firms in China’s manufacturing sector, which could be attributed to increased
competition for funds in the domestic market. Massive foreign investment in China has
resulted in expansion of the private sector which has in overall terms increased the level of
competition for loanable funds and hence there is a negative relationship between foreign
presence and firm leverage.
<insert Table 3 about here>
The signs and magnitudes of the coefficients of the rest of the determinants of capital
structure are largely consistent with other studies. Firm size significantly and positively
affects leverage, confirming that bigger firms tend to diversify their business which reduces
the default risks and hence increases their leverage level (Ferri and Jones, 1979; Rajan and
Zingales, 1995).18 Older firms are found to have higher leverage, indicating that the positive
effect of lower debt-related agency costs (Frank and Goyal, 2009) outweighs the negative
effect of a lower information asymmetry on the leverage level (Akhtar and Oliver, 2009).
Ownership plays a significant role and privately owned firms have a lower leverage level
than their state and collectively owned counterparts, which occurs due to the fact that the
state and collectively owned firms have better access to credit (especially bank loans from the
state-owned banks). The coefficient of the collateral value of assets is significantly negative,
which implies that tangible assets act as credible collateral to reduce information asymmetries
and therefore lower the leverage level; this follows from the fact that reduction in information
asymmetries makes equity less costly (Akhtar and Oliver, 2009). Li, Yue and Zhao (2009)
found the impact of ownership structure on leverage in China to be negative. Business risk
appears not to significantly affect the leverage level, which is consistent with the work of de
Jong, Kabir and Nguyen (2008) on China. The impact of profitability on leverage is negative,
which supports the predictions of the pecking order theory and the agency theories that treat
debt as a disciplining device. This result is also consistent with Li, Yue and Zhao (2009)’s
work on China. The estimated results concerning the impact of growth opportunities and
profitability are also consistent with de Jong, Kabir and Nguyen (2008) and Kayo and
Kimura (2011). The impact of non-debt tax shields and growth opportunities on the leverage
level is statistically insignificant.
The existing literature, such as the work of Chen (2004), suggests that debt is not
freely available to all firms in China. Li, Yue and Zhao (2009) found that non state-owned
firms tend to have lower debt as compared to state-owned firms. The empirical results
presented in Table 3 also suggest that ownership structure has a significant impact on
leverage. In order to further explore this issue, the sample was split into (i) state and
collectively owned and (ii) privately owned domestic firms. The results of IV-Tobit
estimation for each of these two groups are reported in Table 4.
<insert Table 4 about here>
The estimated results presented in Table 4 suggest that, in overall terms, the presence
of foreign firms negatively affects the leverage of both state and collectively owned and
privately owned domestic firms. As compared to state and collectively owned firms, the
negative impact on the leverage of privately owned domestic firms is stronger. This result is
not surprising as most banks in China are state-owned.
While in overall terms, the impact of leverage on firm capital structure in China’s
manufacturing sector is negative, this result may not hold across all industries within the
manufacturing sector. In the rest of this paper, we consider the case of China’s (i) textile
industry, (ii) transportation equipment industry, (iii) electrical machinery and equipment
industry and (iv) communication equipment, computer and other electronic equipment
industry. In relative terms, the textile industry does not rely on advanced technology and, like
the transportation equipment industry, the textile industry also caters for a high level of
domestic demand. The last two industries are relatively more export oriented and these
industries also have a higher level of foreign presence. The estimated results for each of the
four industries are reported in Tables 5 to 8.
Table 5 shows that presence of foreign firms has a negative impact on the leverage of
textile firms. It is interesting to note that the estimated coefficient is smaller than the one
reported in Table 3. This suggests that, as compared to the overall impact on the
manufacturing sector, that presence of foreign firms has a stronger effect on leverage of
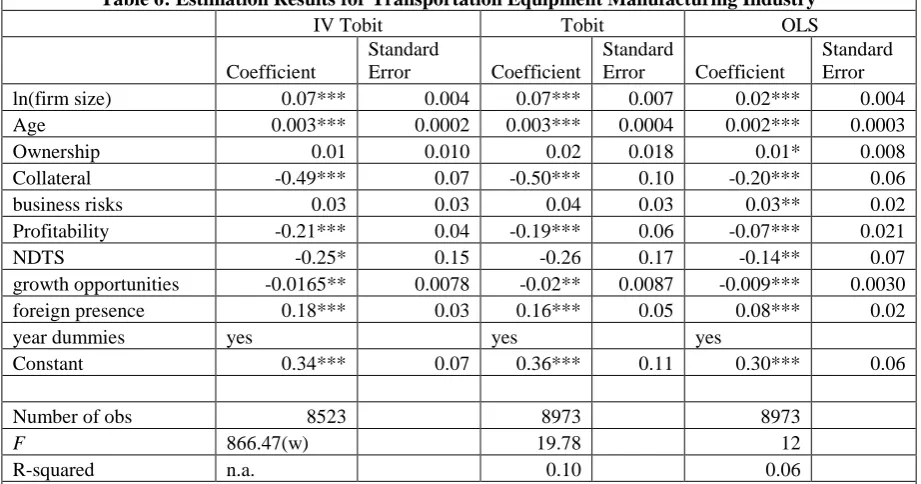
domestic firms in China’s textile industry. Table 6 shows that, in the case of China’s
transportation equipment industry, the impact of foreign presence on leverage is positive
which appears to suggest that foreign presence in this industry creates stronger competition in
the domestic market. The empirical results presented in this paper are based on data collected
from 2000 to 2007. In recent years there have been some changes in government policies
concerning foreign investment in China’s transportation sector. The new policies are
designed to substantially reduce foreign presence in the domestic car industry.
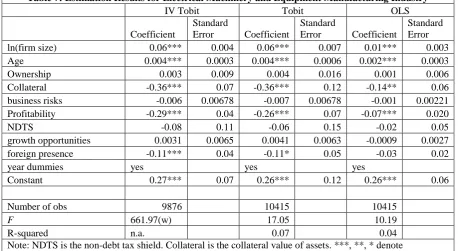
Table 7 shows that presence of foreign firms has a negative effect on firm leverage in
China’s electrical machinery and equipment manufacturing industry. In addition, as
compared to its overall effect on the manufacturing sector, the impact on firm leverage in this
industry is smaller. However, Table 8 shows that the impact of foreign presence on firm
leverage in China’s communication equipment, computer and other electronic equipment
industry is statistically insignificant. It is interesting to note that the negative impact of
profitability on leverage in this industry is the strongest.
<insert Tables 7 to 8 about here>
In summary, the empirical results presented in this paper suggest that (i) in overall
terms, foreign presence is an important determinant of firm leverage in China’s
manufacturing sector and (ii) the impact of foreign presence on firm leverage varies from
industry to industry.
The empirical model has been estimated by using three different estimation
techniques; OLS, Tobit and IV-Tobit and the main conclusions concerning the link between
foreign presence and firm capital structure highlighted in this paper remain robust to the
choice of estimation procedure. In addition, we conducted a number of other robustness
checks.
First, we dropped the industry dummies (as they may be collinear with the foreign
presence variable) and re-estimated the model. Second, the presence of foreign investment is
measured by the number of foreign firms as a proportion of the total (i.e., number of foreign
plus domestic firms). But in our empirical exercise, we measure foreign presence as the
proportion of foreign firm assets to the total in the four digit industry classification. In order
to examine whether this affects our empirical results, we re-estimated equation (8), using the
proportion of the number of foreign firms in the four digit industry as a measure of foreign
presence. Third, one could argue that firm size can be better measured by the logarithm of
firm assets instead of the number of employees and hence we re-estimated the model using
this variable. Fourth, in our previous empirical exercises, a firm is defined to be foreign firm
if it receives foreign investment. An alternative definition is that a firm is foreign firm only if
it is 100 per cent foreign invested19. Using this definition, we re-constructed the measurement
of foreign investment presence20 and re-estimated equation (8).
In each of the four cases, our main empirical findings were unaffected. In order to
save space, these results are not presented in this paper; however we would be happy to
provide these results to interested readers upon request.
19 We thank the reviewer for pointing this out.
5. Concluding Remarks
The existing literature on foreign direct investment, such as the work of Meyer and
Sinani (2009), suggests that domestic firms in host countries experience positive spillovers
from the presence of foreign firms. Acemoglu, Aghion and Zilibotti (2006) and Aghion et al.
(2009), among others, suggest that, depending on the distance from the world technology
frontier, entry of foreign firms can reduce the output of domestic firms. In other words, the
foreign investment related productivity spillover effect can also be negative. A strand of the
existing literature on capital structure, such as the seminal work of Brander and Lewis (1986),
suggests that the output and capital structure decisions of firms are interdependent. It can
therefore be argued that the presence of foreign investment can also affect the firm capital
structure. However, none of the available studies has explicitly examined the link between
the presence of foreign investment and firm capital structure.
By making use of a simple theoretical model where (a) the presence of foreign
investment results in productivity spillovers to domestic firms that can be non-positive and
(b) domestic firms select their optimal debt by maximizing their value, this paper shows that
there is a link between firm capital structure and foreign presence. We show that in the
presence of positive productivity spillover effects from foreign to domestic firms, there is a
positive relationship between foreign presence and firm debt. An increase in foreign presence
also increases the optimal level of investment, as long as the productivity spillover effect is
positive. In the presence of negative productivity spillovers, an increase in foreign presence
decreases both debt and investment of domestic firms. As foreign presence can increase (or
decrease) both debt and investment, its impact on leverage of domestic firms is only clear
under certain conditions (see Proposition 1).
We explore the link between foreign presence and firm leverage by making use of
specified, which includes foreign presence and a number of control variables as determinants
of the firm leverage. The empirical model is estimated by using firm level panel data from
China’s manufacturing sector over the period 2000-2007. The model is estimated for
domestic firms by means of OLS, Tobit and Instrumental Variable Tobit regressions. The
empirical model is also estimated after disaggregating firms into (i) state and collectively
owned and (ii) privately owned domestic firms. As the link between the firm leverage and
foreign presence can vary across industries within the manufacturing sector, the model is also
estimated for 4 separate manufacturing industries. The empirical results reported in this paper
are found to be fairly robust.
The empirical results presented in this paper suggest that presence of foreign
investment has a negative and significant effect on the leverage of domestic firms in China’s
manufacturing sector.21 The presence of a statistically significant relationship between
leverage and foreign presence validates the theoretical relationship. Not surprisingly, we find
that the negative impact of foreign presence on the leverage of privately owned domestic
firms is relatively strong. This could be attributed to the fact that domestic banks in China are
state-owned and hence they tend to favour state and collectively owned firms. Our empirical
results suggest that the impact of foreign presence on the leverage of domestic firms in
China’s textile industry is negative and significant. We also found that the impact on the
leverage of domestic firms in the textile industry is much stronger compared to its overall
impact on the manufacturing sector which suggests that, in relative terms, Chinese banks are
not keen to support the local domestic textile industry. The impact of foreign presence on the
leverage of domestic firms in the electrical machinery and equipment manufacturing industry
is negative but smaller than the overall impact on the manufacturing industry. On the other
hand, the impact of foreign presence on the leverage of domestic firms in China’s
transportation equipment manufacturing industry is positive. The Chinese government is keen
to protect its domestic automobile industry from foreign competition and, by increasing the
availability of credit to domestic firms in the transportation industry, the Chinese banks
appear to be simply following government directions. Finally, we found that the impact of
foreign presence on the leverage of domestic firms in China’s communication equipment,
computer and other electronic equipment manufacturing industry is statistically insignificant.
While this paper deals with the impact of foreign investment on domestic firms in
China’s manufacturing sector, recent studies, such as Doytch and Uctum (2011), highlight the
implications of the shift of foreign investment from the manufacturing to the services sector.
It would be interesting to examine the impact of fluctuations in foreign presence on leverage
of services sector firms. Due to unavailability of data, we were unable to examine this link in
China’s services sector. Nevertheless, it is a significant subject for a future research. Besides,
as mentioned earlier, this paper can also be extended by exploring the entry of domestic firms
on the leverage of other domestic firms.
Acknowledgements
The authors are extremely grateful to an anonymous reviewer for invaluable
comments and suggestions. An earlier version of this paper was presented to the
38thAustralian Conference of Economists. The authors are grateful to participants at the
conference for useful comments. We wish to thank Robert Alexander for providing helpful
comments on several drafts of this paper. Finally, we also thank the seminar participants at
James Cook University for their comments and suggestions. However, the authors are solely
References
Acemoglu, D. and Aghion, P. and Zilibotti, F., 2006. Distance to Frontier, Selection, and Economic Growth. Journal of the European Economic Association 4(1), 37-74. Aghion, P., Blundell, R., Griffith, R., Howitt, P and Prantl, S., 2009. The Effects of Entry on Incumbent Innovation and Productivity. The Review of Economics and Statistics
91(1), 20-32.
Akhtar, S. and Oliver, B., 2009. Determinants of capital structure for Japanese multinational and domestic corporations. International Review of Finance 9, 1-26.
An, Z. (2012), Taxation and capital structure: Empirical evidence from a quasi-experiment in China. Journal of Corporate Finance 18, 683-689.
Berens, J.L. and Cuny, C.L., 1995. The capital structure puzzle revisited., Review of Financial Studies 8, 1185-208.
Booth, L., V. Aivazian, V. Demirguc-Kunt and Maksimovic, V., 2001. Capital structures in developing countries. Journal of Finance 56, 87-130.
Brounen, D., de Jong, A. and Koedijk, K., 2006. Capital structure policies in Europe: Survey evidence. Journal of Banking & Finance 30, 1409-1442.
Bradley, M., G. Jarrell and Kim, E., 1984. On the existence of an optimal capital structure: Theory and evidence. Journal of Finance 39, 857-78.
Brander, J.A. and Lewis, T.R., 1986. Oligopoly and financial structure: The limited liability effect. American Economic Review 76, 956-70.
Branstetter, L., 2006. Is foreign direct investment a channel of knowledge spillovers? Evidence from Japan's FDI in the United States. Journal of International Economics 68, 325-44.
Buckley, P.J., J. Clegg and Wang, C., 2007. Is the relationship between inward FDI and spillover effects linear? An empirical examination of the case of China. Journal of International Business Studies 38, 447-59.
Campello, M., 2006. Debt financing: Does it boost or hurt firm perfromance in product market? Journal of Financial Economics 82, 135-172.
Céspedes, J., González, M. and Molina, C.A., 2010. Ownership and capital strcuture in Latin America. Journal of Business Research 63, 248-254.
Chang, C., 1999. Capital structure as optimal contracts. North American Journal of Economics and Finance 10, 363-85.
Chen, C., A. Cheng, N. He and Kim, J., 1997. An investigation of the relationship between international activities and capital structure. Journal of International Business Studies 23, 563-640.
Chen, J.J., 2004. Determinants of capital structure of Chinese-listed companies. Journal of Business Research 57, 1341-1351
Chen, J. and Strange, R., 2005. The determinants of capital structure: Evidence from Chinese listed companies. Economic Change and Restructuring 38, 11-35.
Chung, Y.P., Na, H.S. and Smith, R. (2013), How Important is Capital Structure to Firm Survival? Journal of Corporate Finance 22, 88-103.
DeAngelo, H. and Masulis, R., 1980. Optimal capital structure under corporate and personal taxation. Journal of Financial Economics 8, 3-29.
de Jong, A., Kabir, R., and Nguyen, T., 2008. Capital structure around the world: The roles of firm and country-specific determinants. Journal of Banking & Finance 32, 1954-1969. Doukas, J. A. and Pantzalis, C., 2003. Geographic diversification and agency costs of debt of
Doytch, N. and Uctum, M., 2011. Does the worldwide Shift of FDI from manufacturing to services accelerate economic growth? A GMM study. Journal of International Money and Finance 30(3), 410-427.
Dunning, J.H., 1988. Explaining International Production, Unwin Hyman: London.
Fattouh, B., L. Harris and Scaramozzino, P., 2008. Non-linearity in the determinants of capital structure: evidence from UK firms. Empirical Economics 34, 417-38. Ferri, M. G. and Jones, W.H., 1979. Determinants of financial structure: A new
methodological approach. Journal of Finance 34, 631-44. Financial Times (2012), Reforming China’s capital account,
http://www.ft.com/cms/s/0/75c788c8-7e5b-11e1-b20a-00144feab49a.html#axzz1rRa02v3v
Frank, M. and Goyal, V., 2009. Capital structure decisions: Which factors are reliably important. Financial Management 38, 1-37.
Friend, I. and Lang, L.P.H., 1988. An empirical test of the impact of managerial self-interest on corporate capital structure. Journal of Finance 43, 271-81.
Gleason, K.C., Mathur, L.K. and Mathur, I., 2000. The interrealtionship beteween culture, capital stucture, and performance: Evidence from European retailer, Journal of Business Research 50, 185-191.
Görg, H. and Greenaway, D., 2004. Much ado about nothing? Do domestic firms really benefit from foreign direct investment? The World Bank Research Observer 19, 171-197.
Harris, M. and Raviv, A., 1990. Capital structure and the information role of debt. Journal of Finance 45, 321-49.
Harris, M. and Raviv, A., 1991. The theory of capital structure. Journal of Finance 46, 297-355.
Haskel, J.E., S.C. Pereira and Slaughter, M.J., 2007. Does inward foreign investment boost the prodcutivity of doemstic firms? Review of Economics and Statistics 89, 482-496. Hu, A.G.Z., G.H. Jefferson and Qian, J., 2005. R&D and technology transfer: Firm-level
evidence from Chinese industry. Review of Economics and Statistics 87, 780-86. Huang, G. and Song, F.M., 2006. The determinants of capital structure: Evidence from
China. China Economic Review 17, 14-36.
Jefferson, G.H., G.R. Thomas and Zhang, Y., 2008. Productivity growth and convergence across China's industrial economy. Journal of Chinese Economic and Business Studies 6, 121-40.
Jensen, M., 1986. Agency costs of free cash flow, corporate finance, and takeovers. American Economic Review 76, 323-39.
Jensen, M. and Meckling, W.H., 1976. Theory of the firms: Managerial behavior, agency costs and ownership structure. Journal of Financial Economics 3, 305-60.
Kayo, E.K. and Kimura, H., 2011. Hierarchical dterminnants of capital structure. Journal of Banking and Finnace 35, 358-371.
Keister, L. (2004), Capital structure in transition: The transforamtion of financial strtaegies in China's emerging economy, Orgasization Science 15(2), 145-158.
Li, K., Yue, H. and Zhao, L. (2009), Ownership, institutions, and capital structure: Evidence from China, Journal of Comparative Economics, Vol. 37 (3), 471–490.
Liu, Z., 2008. Foreign direct investment and technology spillovers: Theory and evidence. Journal of Development Economics 85, 176-93.
Margaritis, D. and Psillaki, M., 2010. Capital structure, equity ownership and firm performance. Journal of Banking & Finance 34, 621-632.
Meyer, K.E. and Sinani, E., 2009. When and where does foreign direct investment generate positive spillovers? Journal of International Business Studies 40, 1075-1094.
Myers, S.C., 1977. Determinants of corporate borrowing. Journal of Financial Economics 5,
147-75.
Myers, S.C., 1984. The capital structure puzzle. Journal of Finance 39, 575-92.
Nowak-Lehmann, F. Dreher, A. Herzer, D. Klasen, S. and Martinez-Zarzoso, I, 2012. Does foreign aid really raise per capita income? A time series perspective, Canadian Journal of Economics, 45, 288-313.
Paligorova, T. and Xu, Z. (2012), Complex Ownership and Capital Structure. Journal of Corporate Finance 18 (4), 701-716.
Perkowski, J. (2012), China's Developing Capital Markets,
http://www.forbes.com/sites/jackperkowski/2012/02/10/chinas-developing-capital-markets/
Pierson, D. (2102), China shows signs of opening up its financial system
http://articles.latimes.com/2012/apr/06/business/la-fi-china-banks-20120407
Qian, Y, Tian, Y. and Wirjanto, T.S. (2009), Do Chinese publicly listed companies adjust their capital structure toward a target level? China Economic Review, Vol. (4), 662-676.
Rajan, R. and Zingales, L., 1995. What do we know about capital structure? Some evidence from international data. Journal of Finance 50, 1421-28.
Scott, J., 1977. Bankruptcy, secured debt, and optimal capital structure. Journal of Finance 32, 1-19.
Smith, C. and Watts, R., 1992. The investment opportunity set and corporate financing, dividend and compensation policies. Journal of Financial Economics 32, 263-92. Stulz, R., 1990. Managerial discretion and optimal financing policies. Journal of Financial
Economics 26, 3-27.
Sun, S., 2009. How does FDI affect domestic firms' exports? Industrial evidence. World Economy 32, 1203-22.
Titman, S. and Wessels, R., 1988. The determinants of capital structure choice. Journal of Finance 43, 1-19.
Wald, J.K., 1999. How firm characteristics affect capital structure: An international comparison. Journal of Financial Research 22, 161-87.
Williamson, O., 1988. Corporate finance and corporate governance. Journal of Finance 43,
567-91.
Wu, L. and Yue, H., 2009. Corporate tax, capital structure, and the accessibility of bank loans: Evidence from China. Journal of Banking & Finance 33, 30-38.
Zeckhauser, R.J. and Pound, J., 1990. Are large shareholders effective monitors? An
Table 1: Manufacturing Sector Summary Statistics
Variable Observations Mean
Standard.
Deviation Minimum Maximum
Leverage 164118 0.12 0.21 0 1
ln(firm size) 164216 -1.70 1.09 -4.83 5.09 Collateral 164216 0.97 0.07 0.07 2 business risks 164215 1.03 31.04 0.0047 1158.72 Profitability 164216 0.08 0.21 -1.99 17.38
NDTS 164216 0.03 0.04 0 1.77
growth opportunities 143689 0.21 4.75 -1 1210.05 foreign presence 164216 0.33 0.17 0 1 Ownership 164216 0.34
Source: NBS, Beijing, 2000-2007
Notes: Firm size is measured as the natural log of number of employees in thousands. Accordingly, an average firm size of -1.7 implies 0.1826 thousand employees. Note: NDTS is the non-debt tax shield. Collateral is the collateral value of assets.
Table 2: Correlation Matrix of the Variables (the Manufacturing Sector)
ln(firm
size) age ownership collateral
business
risks profitability NDTS
growth opportunities
foreign presence ln(firm size) 1
age 0.28 1
ownership -0.16 -0.25 1
collateral -0.07 -0.04 0.01 1 business
risks -0.003 -0.01 -0.01 0.001 1
profitability -0.07 -0.08 0.08 0.08 -0.002 1
NDTS 0.02 -0.02 0.03 0.03 -0.001 0.07 1 growth
opportunities 0.0001 -0.01 0.005 -0.0004 0.0003 0.005 -0.01 1 foreign
presence -0.06 -0.13 0.10 0.02 -0.004 0.01 -0.02 0.005 1 Source: NBS, Beijing, 2000-2007
Table 3: Manufacturing Sector Estimation Results
IV Tobit Tobit OLS
Coefficient
Standard
Error Coefficient
Standard
Error Coefficient
Standard Error ln(firm size) 0.07*** 0.001 0.07*** 0.002 0.02*** 0.001 Age 0.003*** 0.0001 0.003*** 0.0002 0.001*** 0.0001 Ownership -0.03*** 0.002 -0.03*** 0.005 -0.01*** 0.002 Collateral -0.38*** 0.02 -0.38*** 0.03 -0.15*** 0.02 business risks -0.00004 0.00004 -0.00005 0.00003 -0.00003** 0.00001 Profitability -0.10*** 0.01 -0.10*** 0.01 -0.05*** 0.005 NDTS -0.02 0.03 -0.02 0.04 0.01 0.02 growth opportunities -0.0002 0.0002 -0.0002 0.0003 -0.0001 0.0001 foreign presence -0.18*** 0.01 -0.13*** 0.02 -0.05*** 0.01 industry dummies yes yes yes
year dummies yes yes yes
Constant 0.44*** 0.02 0.43*** 0.03 0.34*** 0.02
Number of obs 143500 143500 143500
F 12864.61(w) 92.08 58.72
R-squared n.a. 0.09 0.06
Note: NDTS is the non-debt tax shield. Collateral is the collateral value of assets. ***, **, * denote significance at the 1%, 5% and 10% level respectively; (w) is the Wald chi2 statistic; The estimated value of the Wald statistic for exogeneity of foreign presence is 69.13 with a p-value of 0.000, which rejects the null hypothesis of exogeneity of foreign presence.
Table 4: IV Tobit Estimation Results by Ownership within the Manufacturing Sector
Privately Owned State and Collectively Owned
Coefficient
Standard
Error Coefficient Standard Error
ln(firm size) 0.06*** 0.002 0.07*** 0.001 Age 0.004*** 0.0002 0.003*** 0.0001 Collateral -0.48*** 0.03 -0.34*** 0.02 business risks -0.00009 0.00011 -0.00002 0.00004 Profitability -0.08*** 0.01 -0.11*** 0.01
NDTS 0.03 0.05 -0.04 0.03
growth opportunities -0.0045 0.0028 -0.0002 0.0002 foreign presence -0.23*** 0.02 -0.15*** 0.01 industry dummies yes yes
year dummies yes yes
Constant 0.49*** 0.03 0.41*** 0.02
Number of obs 51498 92002
Wald 2477.59 9145.97
[image:33.595.105.526.413.642.2]Table 5: Estimation Results for Textile Industry
IV Tobit Tobit OLS
Coefficient
Standard
Error Coefficient
Standard
Error Coefficient
Standard Error ln(firm size) 0.07*** 0.004 0.08*** 0.008 0.02*** 0.004 Age 0.003*** 0.0004 0.003*** 0.0006 0.001*** 0.0004 Ownership -0.08*** 0.010 -0.08*** 0.018 -0.03*** 0.008 Collateral -0.45*** 0.07 -0.43*** 0.13 -0.19*** 0.07 business risks 0.04 0.05 0.04 0.05 0.03 0.02 Profitability -0.16*** 0.03 -0.16** 0.07 -0.06*** 0.014
NDTS 0.08 0.10 0.08 0.14 0.08 0.06
growth opportunities -0.0121 0.0081 -0.0129 0.0085 -0.009*** 0.0031 foreign presence -0.35*** 0.04 -0