
0022-538X/07/$08.00
⫹
0
doi:10.1128/JVI.00492-07
Copyright © 2007, American Society for Microbiology. All Rights Reserved.
Productive Human Immunodeficiency Virus Type 1 Infection in
Peripheral Blood Predominantly Takes Place in CD4/CD8
Double-Negative T Lymphocytes
䌤
Philipp Kaiser, Beda Joos, Barbara Niedero
¨st, Rainer Weber, Huldrych F. Gu
¨nthard,
Marek Fischer,* and the Swiss HIV Cohort Study
Division of Infectious Diseases and Hospital Epidemiology, University Hospital Zu
¨rich Ra
¨mistrasse, 100 8091 Zu
¨rich, Switzerland
Received 8 March 2007/Accepted 27 June 2007
Human immunodeficiency virus type 1 (HIV-1) transcription is subject to substantial fluctuation during the viral
life cycle. Due to the low frequencies of HIV-1-infected cells, and because latently and productively infected cells
collocate in vivo, little quantitative knowledge has been attained about the range of in vivo HIV-1 transcription in
peripheral blood mononuclear cells (PBMC). By combining cell sorting, terminal dilution of intact cells, and highly
sensitive, patient-specific PCR assays, we divided PBMC obtained from HIV-1-infected patients according to their
degree of viral transcription activity and their cellular phenotype. Regardless of a patient’s treatment status, the
bulk of infected cells exhibited a CD4
ⴙphenotype but transcribed HIV-1 provirus at low levels, presumably
insufficient for virion production. Furthermore, the expression of activation markers on the surface of these CD4
ⴙT lymphocytes showed little or no association with enhancement of viral transcription. In contrast, HIV-infected T
lymphocytes of a CD4
ⴚ/CD8
ⴚphenotype, occurring exclusively in untreated patients, exhibited elevated viral
transcription rates. This cell type harbored a substantial proportion of all HIV RNA
ⴙcells and intracellular viral
RNAs and the majority of cell-associated virus particles. In conjunction with the observation that the HIV
quasi-species in CD4
ⴙand CD4
ⴚ/CD8
ⴚT cells were phylogenetically closely related, these findings provide evidence that
CD4 expression is downmodulated during the transition to productive infection in vivo. The abundance of viral RNA
in CD4
ⴚ/CD8
ⴚT cells from viremic patients and the almost complete absence of viral DNA and RNA in this cell
type during antiretroviral treatment identify HIV
ⴙCD4
ⴚ/CD8 T cells as the major cell type harboring productive
infection in peripheral blood.
The longevity of latently infected resting memory T-helper
lymphocytes is widely perceived as the major obstacle to the
eradication of human immunodeficiency virus type 1 (HIV-1)
by current antiretroviral therapy (ART) (4, 10, 16, 17, 73). In
addition, ongoing viral replication and reactivation of latently
infected cells may cause continuous replenishment of HIV-1
reservoirs (12, 27, 64). To assess the contributions of
produc-tively infected cells and latently HIV-infected cells to viral
persistence in different subsets of peripheral blood
mononu-clear cells (PBMC), we dissected HIV-infected cells in
periph-eral blood according to their degree of viral-transcription
ac-tivity and their cellular phenotype.
Although dendritic cells (35), natural killer cells (68), and B
cells (14, 45) have also been reported to harbor infectious
provirus, T-helper lymphocytes play a pivotal role as sites of
both HIV-1 production and viral persistence in PBMC.
Rest-ing memory CD4
⫹T cells, the predominantly infected cellular
subset (5), represent the major latent reservoir harboring
rep-lication-competent provirus (13, 17, 73), whereas activated
CD4
⫹T cells are the main targets for HIV-1 infection and
show enhanced levels of viral gene expression in lymph nodes
(77). CD4
⫺/CD8
⫺T cells, a relatively small CD3
⫹T-cell
pop-ulation of heterogeneous lineage and function (65), have been
reported to harbor HIV RNA and replication-competent
pro-virus (8, 42). Although certain HIV-1 isolates may infect T cells
in a CD4-independent manner (51), it appears plausible that
the HIV-1-expressing fraction of CD4
⫺/CD8
⫺T cells descend
from CD4
⫹T cells by CD4 down-modulation. In vitro, this has
been demonstrated to be the concerted action of the viral
proteins Vpu, Env, and, mainly, Nef (7, 37, 53, 58). CD8
⫹T
cells may be susceptible to HIV-1 infection (23, 51), but they
probably constitute a viral reservoir of minor importance (5).
A further PBMC subset susceptible to HIV-1 are CD14
⫹peripheral blood monocytes (31, 44), which were reported to
harbor replication-competent virus in patients on successful
ART (38, 61, 79) even though they may be greatly resistant to
in vitro infection (60).
Among HIV-infected PBMC from individuals on ART, only
a minor fraction can be induced to release
replication-compe-tent virus (10), a majority of viral genomes being defective or
permanently
silenced
(28,
54).
Nevertheless,
unspliced
(usRNA), as well as low levels of multiply spliced (msRNA),
HIV-1 RNAs can be detected consistently in the circulating
PBMC of successfully treated individuals (18, 19, 25, 76). It is
still under debate whether such HIV RNAs mirror viral
repli-cation, eventually resulting in replenishment of HIV-1
reser-voirs, or whether they reflect residual transcription of latent
provirus (2, 11, 12, 19, 29, 66). The latter view is supported by
the finding that effective ART results in the partial reduction
of intracellular viral transcripts but prompts exhaustive
de-pletion of HIV RNA enclosed in cell-associated viral
parti-cles (vRNAex). We have previously shown that the presence
* Corresponding author. Mailing address: Division of Infectious
Diseases and Hospital Epidemiology, University Hospital Zu
¨rich
Ra
¨mistrasse, 100 8091 Zu
¨rich, Switzerland. Phone: 41 44 255 3610.
Fax: 41 44 255 3291. E-mail: [email protected].
䌤
Published ahead of print on 3 July 2007.
9693
on November 8, 2019 by guest
http://jvi.asm.org/
of such virions, presumably residing at the cell surface,
marks predominantly autochthonous virion production and
is therefore a marker for ongoing productive infection (19,
20, 22). In contrast, latently infected cells were devoid of
virion-enclosed HIV RNA (20, 21, 22), but there is ample
evidence that latently infected CD4
⫹T cells may detain
usRNA and msRNA (19, 39, 40). Interestingly, the levels of
multiply spliced, Nef-encoding mRNA in patients on
ther-apy have been shown to predict the extent of rebounding
viral replication in PBMC during structured treatment
in-terruption, while HIV usRNA levels did not (19). This
sug-gested that at least two classes of HIV RNA
⫹PBMC may be
present in patients undergoing ART, one class expressing
usRNA only and a second category of cells containing
msRNA species in addition to usRNA. Furthermore,
single-cell analyses and limiting dilution data indicate that such
low-expressing cells also constitute the majority of HIV
RNA
⫹cells in lymphocytes from untreated individuals,
whereas productively infected cells are much rarer (22, 28).
The present study was designed to assess virological activity
in different PBMC subpopulations by combining
patient-matched real-time PCR assays for HIV usRNA and msRNA
with limiting-dilution analysis of intact cells. This novel
ap-proach provides insights into HIV transcription on a single-cell
level and allows the differentiation of productive infection and
basal transcription in latently infected cells.
MATERIALS AND METHODS
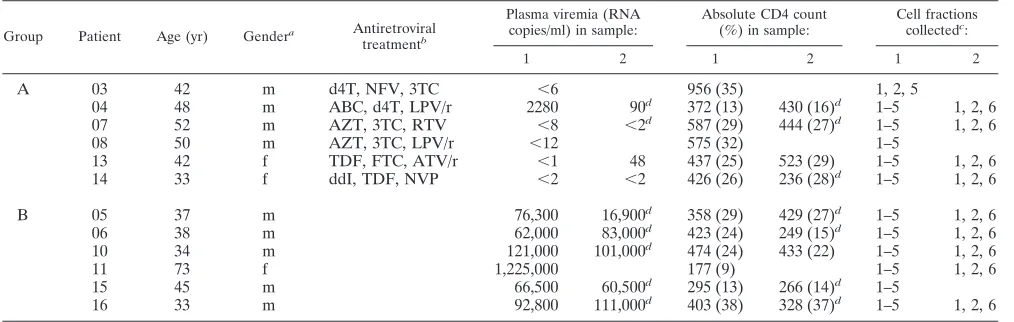
Patients and specimens.Twelve chronically HIV-1-infected patients followed in our infectious disease outpatient clinic were enrolled. Six patients were on long-term combination ART and six had never been on treatment or had been off treatment for at least 8 months. All patients provided written informed consent, according to the guidelines of the ethics committee of the University Hospital of Zu¨rich. For the inclusion of untreated patients, a CD4 count of⬎150 cells perl and a plasma HIV RNA level of⬎50,000 copies per ml was required. Treated patients showing HIV-1 RNA levels below 50 copies/ml during the 6 months preceding sampling were selected. However, patient 04 exhibited a short time period of intermittent viremia on the day of sampling. Patient and virological characteristics are listed in Table 1. In the first series of sampling, cells obtained from 150 ml venous blood were sorted according to protocol 1 (see below). Since analyses revealed that none of the
collected PBMC subsets were likely to include productively infected cells at substan-tial frequencies, additional samples of PBMC, CD4⫹T cells, and CD4⫺/CD8⫺T cells (protocol 2) were collected from the blood of nine patients disposed to repeated blood donation. Because the patients had been in stable condition (patients on ART were receiving unaltered drug regimens and untreated patients had no clinical events calling for the initiation of ART) since previous sampling and no evidence for substantial changes in plasma HIV RNA levels (P⫽1.0) and CD4 counts (Pⱖ
0.605) was observed, data sets were subsequently pooled to augment their statistical power (Table 1).
Cell sorting and storage of samples.PBMC were isolated from anticoagulated blood by Ficoll gradient purification and washed three times in phosphate-buffered saline. Resting (CD25⫺, CD69⫺, and HLA-DR⫺) CD4⫹T cells, activated (CD25⫹, CD69⫹, or HLA-DR⫹) CD4⫹T cells,␣T-cell receptor (TCR)-expressing double-negative T cells, and peripheral blood monocytes were isolated by magnetic cell sorting and sampled in replicate dilution series. The cells were purified according to protocol 1 (first sampling) or protocol 2 (second sampling). Magnetic cell sorting was performed using monoclonal mouse antihuman antibodies (MAbs) coupled to col-loidal paramagnetic beads (Miltenyi Biotec, Bergisch Gladbach, Germany). Except for the modifications indicated below, the labeling and separation of cells was carried out using type LS positive selection columns (Miltenyi) according to the supplier’s instructions. The relative proportions of the PBMC subpopulations, as well as the purity of the sorted fractions, were assessed by flow cytometry (FACSCalibur system; BD Biosciences, San Jose, CA) on unfixed cells labeled with MAbs against surface lineage markers (CD3, -4, -8, and -14) and activation markers (CD25, CD-69, and HLA-DR) coupled to fluorescein isothiocyanate, phycoerythrin (PE), or phyco-erythrin-cyanin 5 fluorescent dye (all conjugates were obtained from Caltag Labo-ratories, Burlingame, CA, except CD25-PE, which was from Sigma, St. Louis, MO).
Protocol 1.CD4⫹T cells were isolated by using anti-CD4 MAbs coupled to detachable paramagnetic beads (CD4 MultiSort kit; Miltenyi Biotec). After removal of the paramagnetic beads, the cells were stained with PE-labeled anti-CD25, -CD69, or -HLA-DR. Subsequently, the cells were sorted accord-ing to activation marker expression by means of paramagnetic beads coupled to a secondary antibody specific for an epitope on PE. To enhance the specificity of the detection of the cell fractions, resting CD4⫹T cells were negatively selected by using depletion columns (type LD), followed by a second step of positive selection for activation marker-positive cells. Mono-cytes were isolated by using a two-step procedure including a negative selec-tion step (monocyte isolaselec-tion kit II; Miltenyi Biotec) followed by a positive selection step using CD14 MicroBeads.
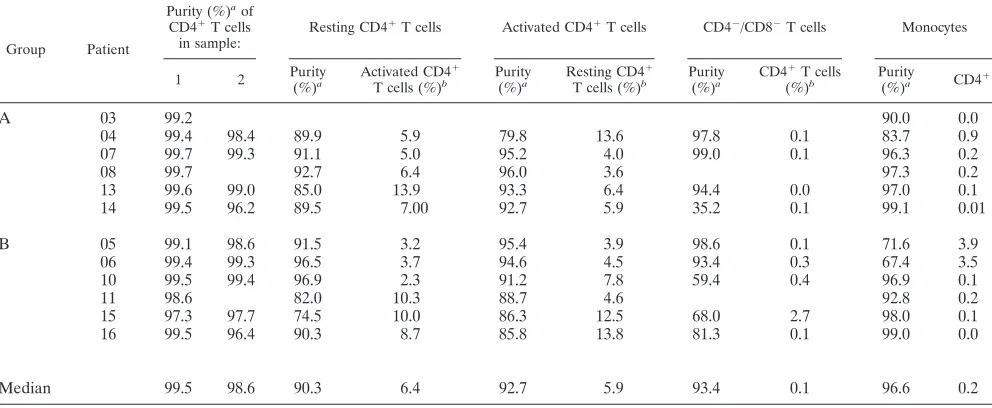
The proportions of the cellular subsets (Table 2) and the purity of the fractions (Table 3) were assessed by flow cytometry.
[image:2.585.42.549.81.242.2]Protocol 2. CD4⫹ and CD8⫹ T cells were isolated using CD4 or CD8 MicroBeads, respectively. Double-negative T cells positive for␣TCR were enriched by magnetic depletion using a cocktail of biotin-conjugated antibodies against CD8, CD14, CD16, CD19, CD36, CD56, CD123,␥/␦TCR, and CD235a subsequently linked to streptavidin-coupled paramagnetic beads (CD4⫹T-cell
TABLE 1. Patient characteristics
Group Patient Age (yr) Gendera Antiretroviral
treatmentb
Plasma viremia (RNA copies/ml) in sample:
Absolute CD4 count (%) in sample:
Cell fractions collectedc:
1 2 1 2 1 2
A
03
42
m
d4T, NFV, 3TC
⬍
6
956 (35)
1, 2, 5
04
48
m
ABC, d4T, LPV/r
2280
90
d372 (13)
430 (16)
d1–5
1, 2, 6
07
52
m
AZT, 3TC, RTV
⬍
8
⬍
2
d587 (29)
444 (27)
d1–5
1, 2, 6
08
50
m
AZT, 3TC, LPV/r
⬍
12
575 (32)
1–5
13
42
f
TDF, FTC, ATV/r
⬍
1
48
437 (25)
523 (29)
1–5
1, 2, 6
14
33
f
ddI, TDF, NVP
⬍
2
⬍
2
426 (26)
236 (28)
d1–5
1, 2, 6
B
05
37
m
76,300
16,900
d358 (29)
429 (27)
d1–5
1, 2, 6
06
38
m
62,000
83,000
d423 (24)
249 (15)
d1–5
1, 2, 6
10
34
m
121,000
101,000
d474 (24)
433 (22)
1–5
1, 2, 6
11
73
f
1,225,000
177 (9)
1–5
1, 2, 6
15
45
m
66,500
60,500
d295 (13)
266 (14)
d1–5
16
33
m
92,800
111,000
d403 (38)
328 (37)
d1–5
1, 2, 6
am, male; f, female.
bAbbreviations used for antiretroviral drugs: d4T, stavudine; NFV, nelfinavir; 3TC, lamivudine; ABC, abacavir; LPV/r, lopinavir/ritonavir; AZT, zidovudine; RTV,
ritonavir; TDF, tenofovir; FTC, emtricitabine; ATV/r, atazanavir-ritonavir; ddI, didanosine; NVP, nevirapine.
c1, PBMC; 2, CD4⫹T cells; 3, resting CD4⫹T cells; 4, activated CD4⫹T cells; 5, monocytes; 6, CD4⫺/CD8⫺T cells.
dValue extrapolated from closely adjacent time points.
on November 8, 2019 by guest
http://jvi.asm.org/
isolation kit II). To remove residual CD4⫹cells, the antibodies were supple-mented with additional CD4 MicroBeads. Finally, CD4⫺/CD8⫺T cells were purified by using fluorescence-activated cell sorting (FACS) (MoFlo high perfo-mance sorter; Dako, Glostrup, Denmark) of CD3⫹CD4⫺/CD8⫺live cells or by using CD3 MicroBeads when FACS was precluded for technical reasons. For calculating the frequencies of CD4⫺/CD8⫺T cells in total PBMC, the proportion of␣TCR-expressing cells to total CD4⫺/CD8⫺T cells was assumed to be approximately 50% (43).
Limiting dilution of patients’ cells.Total undiluted (D0) PBMC and purified cell subsets were counted in a COULTER Ac䡠T diff analyzer (Beckman Coulter, Nyon, Switzerland) and aliquots (n⫽8 to 16) ranging from 50,000 (CD4⫺/CD8⫺T cells) to 1.5 million (monocytes) cells per tube were prepared. Further serial 5-fold dilutions of patients’ cells (n⫽8 to 16 per dilution step; D1, D2, D3, D4, and D5 were diluted 5-, 25-, 125-, 625-, and 3,125-fold, respectively) were prepared by mixing patients’ cells with PBMC (105
cells per aliquot) from
healthy uninfected donors (blood bank of the Swiss Red Cross, Zurich, Switzer-land) aliquoted in replicates (n⫽8 to 16), in 1- to 5-fold-dilution series. The cells were stored at⫺80°C as dry pellets.
Extraction of HIV nucleic acids.For DNA PCR, cells were lysed in 150l cell lysis buffer (9) (kindly provided by Roche Molecular Diagnostics) supplemented with 0.5% QIAGEN protease (QIAGEN) for 60 min at 60°C, followed by 60 min of incubation at 95°C. Total cellular RNA was extracted with a MagNA Pure automatic preparation device and a high-performance extraction kit (Roche, Rotkreuz, Switzerland) using external cell lysis in 800l lysis buffer and elution of RNA in a final volume of 0.1 ml.
[image:3.585.42.542.81.301.2]Selective isolation of extracellular, vRNAex associated with PBMC was per-formed as previously described (19, 20, 22, 33). The procedure included the disintegration of cells by repeated freezing and thawing followed by nuclease and protease digestion of intracellular RNAs and relied on the physical resistance of small viral envelopes to this treatment (22, 30, 33). In brief, pellets were thawed
TABLE 2. Percentage of cell subsets in total PBMC
Group Patient
% in PBMC of:
CD4⫹T cells in first sampling set
Total CD4⫹T cells in second sampling set
CD4⫺/CD8⫺CD3⫹cells in second sampling seta
Monocytes (CD14⫹) in first sampling set Total CD25⫺, CD69⫺,
HLA-DR⫺
CD25⫹, CD69⫹, HLA-DR⫹
A
03
30
15
15
8
04
13
8
5
10
12
10
07
23
6
16
27
3
19
08
26
13
13
2
18
13
19
10
9
32
3
26
14
24
8
16
22
3
19
Median
23
9
14
25
3
19
B
05
24
12
12
20
7
18
06
26
17
9
19
17
12
10
28
17
11
22
4
13
11
11
5
6
20
15
13
5
8
15
6
21
16
26
14
12
34
10
22
Median
25
13
10
20
7
19
a␣TCR⫹CD4⫺/CD8⫺T cells were assumed to represent 50% of total CD4⫺/CD8⫺T cells (45).
TABLE 3. Purities of cell fractions as analyzed by flow cytometry
Group Patient
Purity (%)a
of CD4⫹T cells in sample:
Resting CD4⫹T cells Activated CD4⫹T cells CD4⫺/CD8⫺T cells Monocytes
1 2 Purity
(%)a
Activated CD4⫹ T cells (%)b
Purity (%)a
Resting CD4⫹ T cells (%)b
Purity (%)a
CD4⫹T cells (%)b
Purity
(%)a CD4⫹
A
03
99.2
90.0
0.0
04
99.4
98.4
89.9
5.9
79.8
13.6
97.8
0.1
83.7
0.9
07
99.7
99.3
91.1
5.0
95.2
4.0
99.0
0.1
96.3
0.2
08
99.7
92.7
6.4
96.0
3.6
97.3
0.2
13
99.6
99.0
85.0
13.9
93.3
6.4
94.4
0.0
97.0
0.1
14
99.5
96.2
89.5
7.00
92.7
5.9
35.2
0.1
99.1
0.01
B
05
99.1
98.6
91.5
3.2
95.4
3.9
98.6
0.1
71.6
3.9
06
99.4
99.3
96.5
3.7
94.6
4.5
93.4
0.3
67.4
3.5
10
99.5
99.4
96.9
2.3
91.2
7.8
59.4
0.4
96.9
0.1
11
98.6
82.0
10.3
88.7
4.6
92.8
0.2
15
97.3
97.7
74.5
10.0
86.3
12.5
68.0
2.7
98.0
0.1
16
99.5
96.4
90.3
8.7
85.8
13.8
81.3
0.1
99.0
0.0
Median
99.5
98.6
90.3
6.4
92.7
5.9
93.4
0.1
96.6
0.2
aPercentage of living cells.
bLevels of cross contamination with relevant cell subsets.
on November 8, 2019 by guest
http://jvi.asm.org/
[image:3.585.44.540.505.709.2]and resuspended in 130l phosphate-buffered saline containing 10 mM Tris HCl, pH 7.5, 1 mM MgCl2, 1 mg/ml DNase I (Roche), and 1.8 mg/ml RNase A (QIAGEN). The samples underwent two cycles of freezing on dry ice and thawing at 37°C, followed by incubation for 60 min at 37°C under constant agitation. To inactivate the nucleases, protease (10l, 50 mg/ml; QIAGEN) was added and incubation continued for 45 min. Finally, viral RNA was recovered by automatic extraction as described above.
Adjustment of patient-matched PCR primers.The HIV primers used in the PCR assays were individually adjusted to each patient’s predominant PBMC quasispecies. Total cellular RNA, or in cases when viral cDNAs could not be amplified, total DNA, was extracted from each patient’s sample. For primer identification in genomic HIV-1 usRNA and HIV-1 DNA, a stretch of sequences in thegaggene was scanned for amplifiable sequences (positions 1273 to 1658; nucleotide numbers are in respect to the HXB2 genome, as calculated by the SEQUENCE LOCATOR software provided by the Los Alamos HIV database, www.hiv.lanl.gov). For the identification of primer sites for the amplification of HIV-1 msRNA, spliced cDNA (spanning nucleotides 626 to 743, 5778 to 6045, and 8379 to 9096) was scanned. Alternatively, when msRNA levels were insuf-ficient for the amplification of spliced cDNA, usRNAs in exon 4/5 (positions 5889 to 6252) in theenvand in exon 7 (positions 8079 to 9096) in thegp41/nef
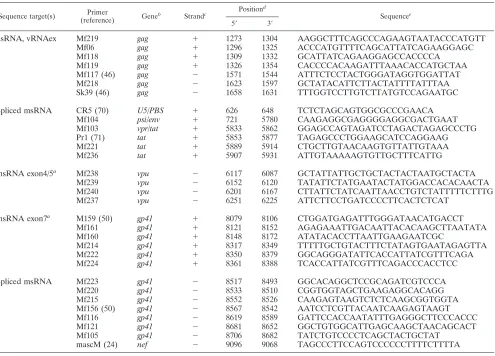
coding regions were assessed. PCR-based sequence scanning was performed by a nested approach using batteries of amplification primers with highly conserved 3⬘ends (Table 4) as follows. In a first round, sequences ranging from 360 to 1,020 bases in length were amplified by a one-tube, two-phase reverse transcription (RT)-PCR approach as described earlier (33) using 1 to 10 separate or combined
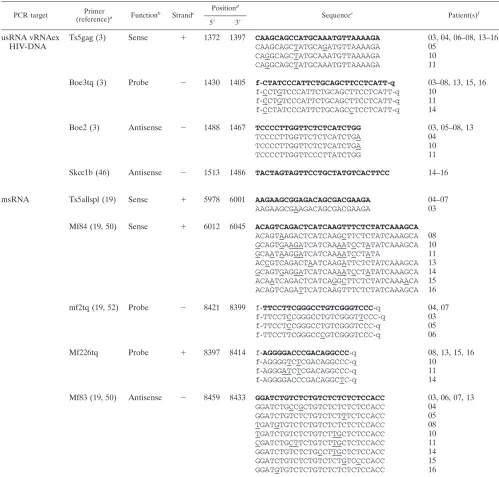
primer combinations per patient. In a second step, pools of 1 to 5 first-round amplification products were further amplified by nested DNA PCR, utilizing HotStarTaq polymerase (QIAGEN) and 1 to 20 separate combinations of inner primers unused in the previous RT-PCR. Genuine PCR products were identified based on their mobility in agarose gel electrophoresis, gel purified, and se-quenced. The primers used for real-time PCR quantification were adjusted to each patient’s isolate (Table 5). To allow for reliable quantification, synthetic RNA and DNA standards differing significantly in their primer binding sites (PCR primers with mismatches proximal to their 3⬘ends and fluorescent probes with mismatches proximal to their 3⬘and 5⬘ends) were prepared for patients’ isolates. For this purpose, the PCR products were tagged with a T7 promoter sequence and transcribed in vitro (33). For DNA quantitation, purified PCR products were used directly as external quantification standards in a range of 2 to 106
copies/PCR. For RNA quantification in vitro, transcribed RNAs (33) were used as external standards in a range of 2 to 106copies/PCR.
[image:4.585.47.542.79.435.2]Real-time PCR assays.Viral RNAs, usRNA, msRNA, and vRNAex were quantified in duplicate by one-tube real-time RT-PCR approaching single-copy sensitivity using PCR primers and probes as outlined in Table 5 under the conditions described previously (20, 22, 33). HIV DNA quantification was per-formed in duplicate in a total volume of 50l with 10l DNA template using HotStarTaq master mix (QIAGEN) supplemented with PCR primers (1M each) and probes (0.3M), listed in Table 5, and additional MgCl2(1.5M). Amplification was performed in a real-time thermocycler (iCycler; Bio-Rad) as follows: 15 min at 95°C and 60 cycles of 10 s at 95°C and 60 s at 60°C. Calibration was performed by using iCycler software.
TABLE 4. PCR primers for isolation of patient-specific RT-PCR primer binding sites
Sequence target(s) Primer
(reference) Gene
b
Strandc Position d
Sequencee
5⬘ 3⬘
usRNA, vRNAex
Mf219
gag
⫹
1273
1304
AAGGCTTTCAGCCCAGAAGTAATACCCATGTT
Mf06
gag
⫹
1296
1325
ACCCATGTTTTCAGCATTATCAGAAGGAGC
Mf118
gag
⫹
1309
1332
GCATTATCAGAAGGAGCCACCCCA
Mf119
gag
⫹
1326
1354
CACCCCACAAGATTTAAACACCATGCTAA
Mf117 (46)
gag
⫺
1571
1544
ATTTCTCCTACTGGGATAGGTGGATTAT
Mf218
gag
⫺
1623
1597
GCTATACATTCTTACTATTTTATTTAA
Sk39 (46)
gag
⫺
1658
1631
TTTGGTCCTTGTCTTATGTCCAGAATGC
Spliced msRNA
CR5 (70)
U5/PBS
⫹
626
648
TCTCTAGCAGTGGCGCCCGAACA
Mf104
psi/env
⫹
721
5780
CAAGAGGCGAGGGGAGGCGACTGAAT
Mf103
vpr/tat
⫹
5833
5862
GGAGCCAGTAGATCCTAGACTAGAGCCCTG
Pr1 (71)
tat
⫹
5853
5877
TAGAGCCCTGGAAGCATCCAGGAAG
Mf221
tat
⫹
5889
5914
CTGCTTGTAACAAGTGTTATTGTAAA
Mf236
tat
⫹
5907
5931
ATTGTAAAAAGTGTTGCTTTCATTG
msRNA exon4/5
aMf238
vpu
⫺
6117
6087
GCTATTATTGCTGCTACTACTAATGCTACTA
Mf239
vpu
⫺
6152
6120
TATATTCTATGAATACTATGGACCACACAACTA
Mf240
vpu
⫺
6201
6167
CTTATTCTATCAATTAACCTGTCTATTTTTCTTTG
Mf237
vpu
⫺
6251
6225
ATTCTTCCTGATCCCCTTCACTCTCAT
msRNA exon7
aM159 (50)
gp41
⫹
8079
8106
CTGGATGAGATTTGGGATAACATGACCT
Mf161
gp41
⫹
8121
8152
AGAGAAATTGACAATTACACAAGCTTAATATA
Mf160
gp41
⫹
8148
8172
ATATACACCTTAATTGAAGAATCGC
Mf214
gp41
⫹
8317
8349
TTTTTGCTGTACTTTCTATAGTGAATAGAGTTA
Mf222
gp41
⫹
8350
8379
GGCAGGGATATTCACCATTATCGTTTCAGA
Mf224
gp41
⫹
8361
8388
TCACCATTATCGTTTCAGACCCACCTCC
Spliced msRNA
Mf223
gp41
⫺
8517
8493
GGCACAGGCTCCGCAGATCGTCCCA
Mf220
gp41
⫺
8533
8510
CGGTGGTAGCTGAAGAGGCACAGG
Mf215
gp41
⫺
8552
8526
CAAGAGTAAGTCTCTCAAGCGGTGGTA
Mf156 (50)
gp41
⫺
8567
8542
AATCCTCGTTACAATCAAGAGTAAGT
Mf116
gp41
⫺
8619
8589
GATTCCACCAATATTTGAGGGCTTCCCACCC
Mf121
gp41
⫺
8681
8652
GGCTGTGGCATTGAGCAAGCTAACAGCACT
Mf105
gp41
⫺
8706
8682
TATCTGTCCCCTCAGCTACTGCTAT
mascM (24)
nef
⫺
9096
9068
TAGCCCTTCCAGTCCCCCCTTTTCTTTTA
aExon numbering of spliced RNA is according to the work of Schwartz et al. (58).
bGenes and landmarks of the HIV-1 genome are given as compiled in the Los Alamos HIV database (www.hiv.lanl.gov). c⫹, coding strand of the proviral genome;⫺, noncoding strand.
dNumbering on the Hxb2 genome according to the software provided by the Los Alamos HIV database (SEQUENCE LOCATOR; www.hiv.lanl.gov). eSequences are given 5⬘to 3⬘from left to right.
on November 8, 2019 by guest
http://jvi.asm.org/
Cloning and sequencing ofenvsequences for phylogenetic analysis.A 401-bp fragment spanning the C2 to C3 region of HIV-1envwas amplified from RNA and DNA samples obtained from CD4⫹and CD4⫺/CD8⫺T cells (patients 05 and 06) using primers mf170 (5⬘-AAATGTCAGCACAGTACAATGTACACATGG-3⬘) and V3Bin (5⬘-GCGTTAAAGCTTCTGGGTCCCCTCCTGAG-3⬘) (32). RNA was amplified by a one-tube RT-PCR as described previously (20, 22, 33). DNA was amplified using HotStarTaq master mix (QIAGEN). Cycling was performed as follows: 30 min at 50°C for RT and 15 min at 95°C for activation ofTaqpolymerase,
[image:5.585.42.541.80.557.2]followed by 60 cycles (10 s at 95°C, 10 s at 60°C, and 60 s at 72°C) for amplification of cDNAs and DNA. The pooled and purified PCR products were ligated into pDrive cloning vector (PCR cloning kit; QIAGEN) according to the supplier’s instructions. Individual clones were picked after bacterial transformation and resus-pended in 100l selective growth medium. To rule out contamination with a free PCR product, DNase I (Roche) (0.2 mg/ml) was added and the clones were incu-bated at 37°C for 3 to 5 h. Subsequently, 5l of bacterial suspension was lysed in 0.5 ml water (5 min at 95°C) and inserts were amplified from 1l of lysate in a volume
TABLE 5. PCR primers used for patient-specific real-time PCR
PCR target Primer
(reference)a Functionb Strandc
Positiond
Sequencee
Patient(s)f
5⬘ 3⬘
usRNA vRNAex
Ts5gag (3)
Sense
⫹
1372
1397
CAAGCAGCCATGCAAATGTTAAAAGA
03, 04, 06–08, 13–16
HIV-DNA
CAAGCAGCTATGCAGATGTTAAAAGA
05
CAGGCAGCTATGCAAATGTTAAAAGA
10
CAGGCAGCTATGCAAATGTTAAAAGA
11
Boe3tq (3)
Probe
⫺
1430
1405
f
-
CTATCCCATTCTGCAGCTTCCTCATT
-
q
03–08, 13, 15, 16
f
-
CCTGTCCCATTCTGCAGCTTCCTCATT
-
q
10
f
-
CCTGTCCCATTCTGCAGCTTCCTCATT
-
q
11
f
-
CCTATCCCATTCTGCAGCCTCCTCATT
-
q
14
Boe2 (3)
Antisense
⫺
1488
1467
TCCCCTTGGTTCTCTCATCTGG
03, 05–08, 13
TCCCCTTGGTTCTCTCATCTGA
04
TCCCCTTGGTTCTCTCATCTGA
10
TCCCCTTGGTTCCCTTATCTGG
11
Skcc1b (46)
Antisense
⫺
1513
1486
TACTAGTAGTTCCTGCTATGTCACTTCC
14–16
msRNA
Ts5allspl (19)
Sense
⫹
5978
6001
AAGAAGCGGAGACAGCGACGAAGA
04–07
AAGAAGCGAAGACAGCGACGAAGA
03
Mf84 (19, 50)
Sense
⫹
6012
6045
ACAGTCAGACTCATCAAGTTTCTCTATCAAAGCA
ACAGTAAGACTCATCAAGCTTCTCTATCAAAGCA
08
GCAGTGAAGATCATCAAAATCCTATATCAAAGCA
10
GCAATAAGGATCATCAAAATCCTATA
11
ACCGTCAGACTAATCAAGATTCTCTATCAAAGCA
13
GCAGTGAGGATCATCAAAATCCTATATCAAAGCA
14
ACAATCAGACTCATCAGGCTTCTCTATCAAAACA
15
ACAGTCAGATTCATCAAGTTTCTCTATCAAAGCA
16
mf2tq (19, 52)
Probe
⫺
8421
8399
f
-TTCCTTCGGGCCTGTCGGGTCCC-
q
04, 07
f
-
TTCCTCCGGGCCTGTCGGGTTCCC
-
q
03
f
-
TTCCTCCGGGCCTGTCGGGTCCC
-
q
05
f
-
TTCCTTCGGGCCCGTCGGGTCCC
-
q
06
Mf226tq
Probe
⫹
8397
8414
f
-AGGGGACCCGACAGGCCC-
q
08, 13, 15, 16
f
-
AGGGGTCTCGACAGGCCC
-
q
10
f
-
AGGGATCTCGACAGGCCC
-
q
11
f
-
AGGGGACCCGACAGGCTC
-
q
14
Mf83 (19, 50)
Antisense
⫺
8459
8433
GGATCTGTCTCTGTCTCTCTCTCCACC
03, 06, 07, 13
GGATCTGCCGCTGTCTCTCTCTCCACC
04
GGATCTGTCTCTGTCTCTTTCTCCACC
05
TGATGTGTCTCTGTCTCTCTCTCCACC
08
TGATCTGTCTCTGTCTTGCTCTCCACC
10
CGATCTGCTTCTGTCTTGCTCTCCACC
11
GGATCTGTCTCTGCCTTGCTCTCCACC
14
GGATCTGTCTCTGTCTCTGTCCCCACC
15
GGATGTGTCTCTGTCTCTCTCTCCACC
16
aPrimers are denominated according to internal nomenclature in the authors’ laboratory and not necessarily by previously used designations in the indicated
references.
bFunctions of oligonucleotides: sense, primer of positive polarity used for PCR; antisense, primer of negative polarity used for cDNA synthesis and PCR; probe,
fluorogenic probe used for detection of genuine amplification products.
c⫹, coding strand of the proviral genome;⫺, noncoding strand.
dNumbering on the HXB2 genome according to the software provided by the Los Alamos HIV database (SEQUENCE LOCATOR; www.hiv.lanl.gov). eSequences are given 5⬘to 3⬘from left to right. Underlined positions show deviation from the standard sequence (HXB2 or clade B consensus) which is indicated
in bold letters. f, fluorescein moiety attached to the DNA probe; q, fluorescence quenching moiety attached to the DNA probe.
fPrimers were adjusted to isolates from the patient(s) listed.
on November 8, 2019 by guest
http://jvi.asm.org/
of 20l using HotStarTaq master mix (QIAGEN) and primers T7 (5⬘-TAAGCCT TAATACGACTCACTATAGGGAGA-3⬘) and m13 (5⬘-GTAAACGACGGCCA GT-3⬘) as follows: the polymerase was activated for 15 min at 95°C and amplified for 35 cycles (10 s at 95°C, 10 s at 56°C, and 60 s at 72°C). One microliter of each clonal PCR product containing approximately 20 to 30 ng DNA was sequenced in both directions with primers mf170 and V3Bin using BigDye chain terminator chemistry and an ABI 31000 automated sequencer (Applied Biosystems, Rotkreuz, Switzer-land) as described previously (32).
Phylogenetic analyses.Sequences were edited and aligned with Lasergene software version 5.08 (DNASTAR Inc., Madison, WI). The alignments were manually corrected to adjust sequence gaps to the reading frame. Phylogenetic analyses were conducted using MEGA version 3.1 (36). Genetic distance esti-mates were obtained using the Tamura-Nei six-parameter model. Neighbor-joining phylogenetic trees were constructed by MEGA using a sequence (GenBank U63632) from HIV-1 isolate JRFL as the reference sequence and bootstrapping (1,000 replications).
Calculations and statistics.Statistical analyses were performed using Graph-Pad Prism 4.0 software (GraphGraph-Pad Software, Inc, San Diego, CA), using non-parametric tests throughout the analyses because the data lacked normal distri-bution. The Mann-Whitney signed-rank test was used for the comparison of unpaired data, and the Wilcoxon signed-rank test for matched paired analysis.
The numbers of HIV RNA⫹cells were calculated by 50% endpoint analysis (49). Global analysis of all limiting dilutions performed for PBMC and T lym-phocytes revealed that the dilutions calculated to contain on average 1 to 0.5 HIV RNA⫹cells were HIV RNA⫹with a median frequency of 33%, which was statistically not different from 0.37% as predicted by Poissonian distribution (P⫽
0.63; Wilcoxon signed-rank test). Dilutions containing smaller numbers of HIV-infected cells were positive with median frequencies significantly lower than 37% (P⬍0.0001). This verifies that the dilutions were prepared properly, without unforeseen loss of the HIV-infected patients’ cells.
The specific viral RNA contents per cell were calculated by normalization of
the RNA copies quantified in each specimen to the frequencies of HIV RNA⫹ cells as follows: specific (msRNA) content in class II, copies msRNA/msRNA⫹ cells; specific (vRNAex) content in class III, copies vRNAex/vRNAex⫹cells; and specific (usRNA) content in class I, (copies usRNA/usRNA⫹cells)ⰻmsRNA⬎
⭋. In order to exclude class II cells expressing usRNA, the latter calculation was performed using only specimens negative for msRNA.
Nucleotide sequence accession numbers.The clonalenvsequences have been deposited in GenBank under accession numbers EU023940 to EU024109.
RESULTS
Three expression patterns of HIV-1 RNA in PBMC.
[image:6.585.39.544.81.391.2]Unfrac-tionated PBMC, total CD4
⫹T cells, resting or activated CD4
⫹T cells, CD8/CD4 double-negative T cells, and blood
mono-cytes were isolated by magnetic cell sorting and sampled in
replicate dilution series. HIV DNA, HIV usRNA mapping to
the
gag
gene, HIV msRNA coding for
tat
,
rev
, or
nef
, and
vRNAex (19, 20, 22) were measured quantitatively in each
dilution (Table 6). Terminal dilution analysis allowed for the
calculation of the frequencies of cells positive for each HIV
RNA species. Overall, this revealed three categories of
HIV-infected cells expressing viral RNA which could be
distin-guished by virtue of their dissimilar frequencies; one class
expressing solely usRNA (referred to as class I), a category of
cells expressing msRNA and presumably also usRNA (class
II), and cells positive for vRNAex (class III). Irrespective of
cell type, cells assigned to class I were more frequent than class
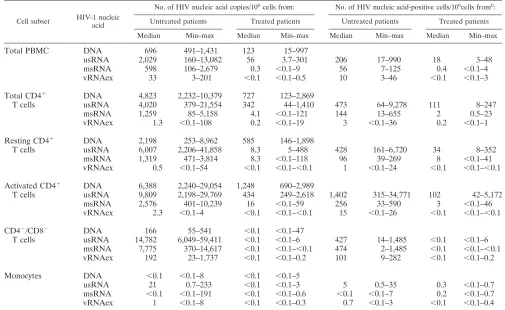
TABLE 6. Viral nucleic acids in PBMC and cellular subsets
aCell subset HIV-1 nucleic acid
No. of HIV nucleic acid copies/106cells from: No. of HIV nucleic acid-positive cells/106cells fromb:
Untreated patients Treated patients Untreated patients Treated patients
Median Min–max Median Min–max Median Min–max Median Min–max
Total PBMC
DNA
696
491–1,431
123
15–997
usRNA
2,029
160–13,082
56
3.7–301
206
17–990
18
3–48
msRNA
598
106–2,679
0.3
⬍
0.1–9
56
7–125
0.4
⬍
0.1–4
vRNAex
33
3–201
⬍
0.1
⬍
0.1–0.5
10
3–46
⬍
0.1
⬍
0.1–3
Total CD4
⫹DNA
4,823
2,232–10,379
727
123–2,869
T cells
usRNA
4,020
379–21,554
342
44–1,410
473
64–9,278
111
8–247
msRNA
1,259
85–5,158
4.1
⬍
0.1–121
144
13–655
2
0.5–23
vRNAex
1.3
⬍
0.1–108
0.2
⬍
0.1–19
3
⬍
0.1–36
0.2
⬍
0.1–1
Resting CD4
⫹DNA
2,198
253–8,962
585
146–1,898
T cells
usRNA
6,007
2,206–41,858
8.3
5–488
428
161–6,720
34
8–352
msRNA
1,319
471–3,814
8.3
⬍
0.1–118
96
39–269
8
⬍
0.1–41
vRNAex
0.5
⬍
0.1–54
⬍
0.1
⬍
0.1–
⬍
0.1
1
⬍
0.1–24
⬍
0.1
⬍
0.1–
⬍
0.1
Activated CD4
⫹DNA
6,388
2,240–29,054
1,248
690–2,989
T cells
usRNA
9,809
2,198–29,769
434
249–2,618
1,402
315–34,771
102
42–5,172
msRNA
2,576
401–10,239
16
⬍
0.1–59
256
33–590
3
⬍
0.1–46
vRNAex
2.3
⬍
0.1–4
⬍
0.1
⬍
0.1–
⬍
0.1
15
⬍
0.1–26
⬍
0.1
⬍
0.1–
⬍
0.1
CD4
⫺/CD8
⫺DNA
166
55–541
⬍
0.1
⬍
0.1–47
T cells
usRNA
14,782
6,049–59,411
⬍
0.1
⬍
0.1–6
427
14–1,485
⬍
0.1
⬍
0.1–6
msRNA
7,775
370–14,617
⬍
0.1
⬍
0.1–
⬍
0.1
474
2–1,485
⬍
0.1
⬍
0.1–
⬍
0.1
vRNAex
192
23–1,737
⬍
0.1
⬍
0.1–0.2
101
9–282
⬍
0.1
⬍
0.1–0.2
Monocytes
DNA
⬍
0.1
⬍
0.1–8
⬍
0.1
⬍
0.1–5
usRNA
21
0.7–233
⬍
0.1
⬍
0.1–3
5
0.5–35
0.3
⬍
0.1–0.7
msRNA
⬍
0.1
⬍
0.1–191
⬍
0.1
⬍
0.1–0.6
⬍
0.1
⬍
0.1–7
0.2
⬍
0.1–0.7
vRNAex
1
⬍
0.1–8
⬍
0.1
⬍
0.1–0.3
0.7
⬍
0.1–3
⬍
0.1
⬍
0.1–0.4
aIf no HIV RNA was detected, the limit of detection (0.1 copy per 106cells or 0.1 positive cell per 106cells of each subset) was used for statistical analyses. Min–max,
minimum to maximum.
bHIV DNA was not assessed by limiting dilution analysis.
on November 8, 2019 by guest
http://jvi.asm.org/
II cells (
P
⬍
0.0001;
n
⫽
55; Wilcoxon signed-rank test). In
turn, cells of class III, expressing vRNAex, were consistently
less frequent than cells of class II (
P
⬍
0.0001;
n
⫽
45;
Wilcoxon signed-rank test).
The numbers of HIV RNA
⫹cells were smaller in treated
(group A) than in untreated (group B) patients in all three
transcriptional categories (Fig. 1; Table 6). In agreement with
this, the levels of HIV DNA, indicative of the total number of
HIV-infected cells, were markedly higher in viremic patients
than in patients on ART (Table 6).
HIV-1 RNA in CD4
ⴙT cells comprises only a fraction of
viral transcripts.
To dissect HIV-1 expression according to
both viral transcriptional patterns and cellular phenotype, we
assessed the levels of HIV-1 nucleic acids in total PBMC,
CD4
⫹T cells, and monocytes (Table 6).
[image:7.585.48.278.69.225.2]HIV DNA recovered from total PBMC could be attributed
predominantly to CD4
⫹T cells in either patient group.
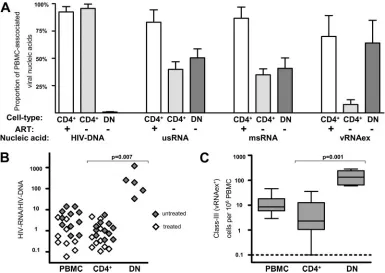
Simi-larly, in treated patients’ samples, the usRNA and msRNA
quantified in total PBMC were almost entirely attributable to
the CD4
⫹fraction (Fig. 2A). In marked contrast, generally less
than 50% of the PBMC-associated HIV RNAs were recovered
from CD4
⫹cells in untreated patients’ samples (group B) (Fig.
2A). Furthermore, vRNAex was detected only at basal levels in
CD4
⫹T cells from both patient groups (Fig. 2A), while it was
FIG. 1. HIV-1 RNA
⫹cells in total PBMC. Frequencies of cells
positive for usRNA (class I), msRNA (class II), and vRNAex (class III)
were calculated by limiting dilution analysis. Open bars depict data
from treated patients (group A) and shaded bars frequencies in
un-treated patients (group B).
P
values indicate comparison of group A to
B (Mann-Whitney test). “Box and whisker” bars depict medians,
quar-tiles, and ranges. The broken line indicates the lowest detection
thresh-old for PBMC expressing HIV-1 RNA.
FIG. 2. High levels of HIV-1 production in CD4
⫺/CD8
⫺T cells from untreated patients. (A) Proportions of HIV-1 nucleic acids in PBMC
attributed to CD4
⫹T cells (CD4
⫹; gray bars, untreated patients; open bars, on-treatment patients) and CD4
⫺/CD8
⫺T cells (DN [double negative];
dark bars, untreated patients; no analysis during ART was possible due to almost-complete depletion of viral DNA and RNA). Error bars show
standard errors of the means.
⫹
, on-treatment patients;
⫺
, untreated patients. (B) HIV RNA expression normalized to HIV DNA content in
PBMC, CD4
⫹T cells (CD4
⫹), and CD4
⫺/CD8
⫺T cells (DN) in untreated and treated patients. HIV RNA expression was calculated as the sum
of the average msRNA and usRNA expression at each time point. (C) Frequencies of cells positive for vRNAex (category III) in PBMC, CD4
⫹T cells (CD4
⫹), and CD4
⫺/CD8
⫺T cells (DN) of untreated patients. The broken line indicates the lowest detection threshold for cells expressing
HIV-1 RNA. “Box and whisker” bars depict medians, quartiles, and ranges. Analyses A to C comprised one data point per visit, resulting in
duplicate measurements for PBMC and CD4
⫹T cells for all patients except for patients 03, 08, and 11. (B and C) Results of nonparametric
comparison of CD4
⫹versus CD4
⫺/CD8
⫺T cells using Mann-Whitney testing are indicated by
P
values.
on November 8, 2019 by guest
http://jvi.asm.org/
[image:7.585.99.484.360.633.2]present at substantial levels in PBMC from untreated patients
(Table 6). These findings, showing a pronounced disparity
be-tween HIV RNA levels in CD4
⫹T cells compared to the total
PBMC population, indicated that in viremic patients, a
ma-jor fraction of HIV-infected cells expressing viral RNA may
be associated with a cell type expressing no or low levels of
surface CD4.
In CD14
⫹monocytes of all untreated and in five of six
treated individuals, HIV-infected cells were present. However,
they harbored minute levels of viral nucleic acids (Table 6) and
their frequencies were 100- to 1,000-fold lower than those of
HIV-infected CD4
⫹T cells. In particular, msRNA expression
in CD14
⫹cells was very low and detectable in only 50% of
samples in both groups. Thus, monocytes appear unlikely to
play a major role for virus production in peripheral blood.
Abundant viral transcription in CD8/CD4 double-negative
T lymphocytes.
Considering that HIV can downmodulate CD4
surface expression of its host cells (7, 37, 53) and that CD8
⫹T
cells were not expected to contribute significantly to PBMC
viral load (5), we examined CD4/CD8 double-negative CD3
⫹T lymphocytes for their content of viral nucleic acids. For
untreated patients, this analysis revealed that 50%
⫾
8%
(mean
⫾
standard error) of usRNA, 41%
⫾
10% of msRNA,
and 64%
⫾
21% of PBMC-associated vRNAex was
attribut-able to this minor cellular subset (Fig. 2A), whereas HIV DNA
was present at lower levels than in CD4
⫹T cells (Table 6). In
accord with this, we observed higher viral RNA/DNA ratios in
CD4
⫺/CD8
⫺T cells than in total PBMC and CD4
⫹T cells
(Fig. 2B), indicating increased viral transcription and/or
reduc-tion of defective or transcripreduc-tionally silent proviral DNA in
this cell subset. Furthermore, cells of class III, positive for
vRNAex, were approximately 10 times more frequent in
CD4
⫺/CD8
⫺T cells than in CD4
⫹T lymphocytes (Fig. 2C).
In contrast, HIV-1 nucleic acids in CD4
⫺/CD8
⫺T cells from
patients undergoing antiretroviral treatment were almost
com-pletely depleted (Table 6). Among the CD4
⫺/CD8
⫺T-cell
specimens from the four patients assessed, HIV DNA was
present only in patient 04 and usRNA was detected in patient
13 in one of four RNA extracts tested. Thus, HIV-infected
CD4
⫺/CD8
⫺T cells expressing viral RNA were at least 500
times less frequent in patients on ART than in viremic
pa-tients.
T cells losing CD4 expression due to HIV-1 infection are
expected to express CD4 mRNA because the virus mediates
CD4 down-modulation at a posttranslational level (1). Thus,
preliminary experiments to measure CD4 mRNA were
per-formed (data not shown). CD4 mRNA expression was readily
detectable in CD4
⫺/CD8
⫺T cells, consistent with the
hypoth-esis that the double-negative T-cell subset indeed may harbor
cells derived from previously CD4-positive helper T
lympho-cytes. However direct analysis of CD4 mRNA expression in
HIV-infected CD4
⫺/CD8
⫺T cells was precluded by the low
frequencies (
⬍
0.1%) of HIV-infected cells within this cell
subset.
Similar HIV-1 transcription in resting and activated CD4
ⴙT cells.
Although CD4
⫹T cells harbored only 30 to 50% of all
HIV-1 transcripts in PBMC of untreated patients, this
never-theless considerable contribution to the cellular viral burden
warranted further investigation. Contrary to initial
expecta-tions, only subtle differences between resting and activated
CD4
⫹T cells were observed with regard to viral transcriptional
activity (Fig. 3) and HIV DNA content (Table 6). HIV RNA
⫹cells appeared, at most, slightly enriched in the activated
frac-tion in comparison to the resting populafrac-tion (
P
⫽
0.01 for
usRNA
⫹class I cells and
P
⫽
0.07 for msRNA
⫹class II cells)
(Fig. 3A). As assessed by specific per-cell HIV RNA burdens,
a moderate tendency for enhanced transcription in the
acti-vated CD4
⫹subset was observed in class I cells (
P
⫽
0.04),
whereas class II cells expressing msRNA showed an opposite
trend (
P
⫽
0.05), harboring lower levels of msRNA in the
activated than in the resting CD4
⫹subset (Fig. 3B).
Assess-ment of vRNAex revealed that this RNA species, indicative of
ongoing virus production, was only occasionally present, at low
levels, in activated and resting CD4
⫹T cells (Table 6).
In summary, the lack of evidence for the association of
activation markers CD25, CD69, or HLA-DR with enhanced
HIV transcription or virus production suggests that HIV
tran-scription may be similar in activated and resting T-helper
lym-phocytes carrying the CD4 receptor at the cell surface.
Differences in HIV-1 single-cell transcriptional activity in
T-helper-cell subsets.
To assess viral transcription at the
sin-FIG. 3. Similar HIV-1 transcriptional activity in resting and
acti-vated CD4
⫹T cells from treated and untreated patients. (A)
Frequen-cies of HIV RNA
⫹cells in resting (RST) and activated (ACT) CD4
⫹T cells normalized to 10
6cells of the corresponding cell types. (B)
Geo-metric means of HIV RNA contents per cell in RST and ACT CD4
⫹T cells normalized to numbers of HIV RNA
⫹cells. Analyses
com-prised one data point per visit, resulting in duplicate measurements for
PBMC and CD4
⫹T cells for all patients except for patients 03, 08, and
11. Results of nonparametric paired analyses of CD4
⫹versus CD4
⫺/
CD8
⫺T cells using Wilcoxon signed-rank testing are indicated by
P
values.
on November 8, 2019 by guest
http://jvi.asm.org/
gle-cell level, and to further explore whether the categorization
of HIV RNA
⫹cells into three transcriptional classes
repre-sented a valid model of HIV transcription in PBMC, the
per-cell viral RNA content of CD4
⫹T cells was compared with
that of CD4
⫺/CD8
⫺T cells in an analysis using pooled
PCR-positive data from all patients (Fig. 4; CD4
⫹T cells,
n
⫽
826;
CD4
⫺/CD8
⫺T cells,
n
⫽
81).
In CD4
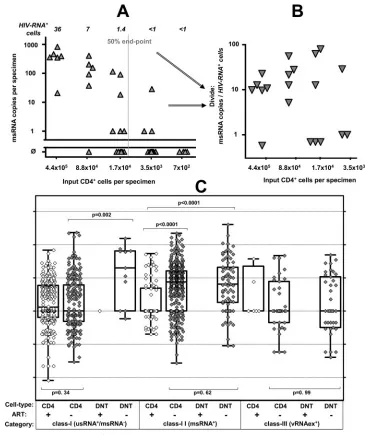
⫹T cells, class I (usRNA) expression in treated and
viremic patients was similar (Mann-Whitney test;
P
⫽
0.34),
suggesting that basal usRNA transcription in CD4
⫹cells was
unaffected by treatment status and ongoing viral replication.
Class I expression in CD4
⫺/CD8
⫺T cells was almost
com-pletely absent in treated patients and rare but perceptible in
viremic individuals. Interestingly, in untreated patients, we
ob-served a markedly higher specific per-cell usRNA expression
than in class I cells of CD4
⫹cells (Mann-Whitney test;
P
⬍
0.002). Thus, even the HIV-infected CD4
⫺/CD8
⫺T cells with
basal RNA transcriptional activity displayed an increment in
viral RNA expression.
[image:9.585.107.472.66.501.2]The median class II (msRNA) expression in CD4
⫹T cells
FIG. 4. Specific HIV contents per cell of CD4
⫹and CD4
⫺/CD8
⫺T cells. (A and B) Schematic outline of determination of specific cell contents as
exercised by measurements of msRNA (class II expression) in CD4
⫹T cells obtained from patient 10. (A) Primary measurements of msRNA levels in
serial five-fold dilutions of purified CD4
⫹T cells are shown in panel A. Triangles depict individual measurements and the vertical gray line shows the
calculated 50% end point of specimens positive for msRNA. Italic numbers above the panel show the calculated numbers of HIV RNA
⫹cells in each
dilution series. (B) Normalization of measured HIV msRNA copies to numbers of HIV RNA
⫹cells results in specific HIV RNA contents in each sample
with detectable msRNA (triangles). (C) Per-cell HIV RNA expression data comprising per-cell expression in resting, activated, and total CD4
⫹T cells
(CD4
⫹) and CD4
⫺/CD8
⫺T cells (DNT [double negative]) from all patients and time points is displayed by single data points (open symbols,
on-treatment patients; gray symbols, untreated patients) and “box and whisker” bars showing medians, quartiles, and ranges. Note that viral RNA
expression in CD4
⫺/CD8
⫺T cells obtained from patients on ART, remaining below the threshold of detection, could not be displayed except for one
sample (left panel, class I expression). Results of nonparametric comparisons using Mann-Whitney testing are indicated by
P
values.
on November 8, 2019 by guest
http://jvi.asm.org/
was about 10-fold higher in viremic patients than in individuals
on ART (Mann-Whitney test;
P
⬍
0.0001). Equivalent trends
(Mann-Whitney test;
P
ⱕ
0.08) for increased per-cell
expres-sion of msRNA in viremic patients were observed when
acti-vated, resting, and unfractionated CD4
⫹cells were analyzed
separately (data not shown). The levels of class II-specific
per-cell expression in CD4
⫺/CD8
⫺T cells were similar to the
boosted RNA expression in CD4
⫹cells in viremic patients
(Mann-Whitney test;
P
⫽
0.62) and completely undetectable in
treated patients.
The specific per-cell expression in class III was similar in the
CD4
⫹T-cell and the CD4
⫺/CD8
⫺T-cell subsets (
P
⫽
0.99) in
untreated patients. A comparison of class III expression in
treated and viremic patients was not performed, since vRNAex
expression was profoundly depleted in CD4
⫹T cells of treated
patients (eight positive specimens) and completely absent in
their CD4
⫺/CD8
⫺T cells. Thus, it was conceivable that class
III-positive cells in treated patients did not reflect productively
infected lymphocytes, but rather uninfected CD4
⫹T cells
car-rying residual virions picked up from the plasma at their
sur-faces (22).
Distribution of viral transcriptional classes in T-helper
lym-phocytes.
Our analysis of specific per-cell transcription implied
that in viremic patients, class II HIV-infected cells may
com-prise subpopulations with elevated rates of expression of
msRNA. Because active virus production requires the
expres-sion of high levels of msRNA and usRNA (19, 48), it is
con-ceivable that class III cells carrying vRNAex may reflect such a
subpopulation (19, 20, 22), actively expressing viral particles as
well as viral regulatory and structural genes. However, a direct
determination of whether the expression of vRNAex in a given
specimen coincided with elevated expression of msRNA was
precluded since the extraction procedures for total cellular
RNA and vRNAex are mutually exclusive.
Nevertheless, given the assumption that class III
expres-sion required the expresexpres-sion of msRNA, calculations of the
relative frequencies of the different transcriptional classes
were performed in CD4
⫺/CD8
⫺T cells and CD4
⫹T cells
(Fig. 5). This analysis revealed that in the CD4
⫹T cells of
treated patients, the vast majority (95%
⫾
2%) of HIV
RNA
⫹cells could be assigned to viral transcriptional class I,
while the remaining cells showed mostly class II expression
(4%
⫾
1.5%) and, very rarely, class III transcription (0.3%
⫾
0.17%). In viremic individuals, the relative contributions
of class II were elevated both in CD4
⫹and in CD4
⫺/CD8
⫺T cells, to 21%
⫾
5% and 59%
⫾
17%, respectively. Class
III cells remained scarce in CD4
⫹T cells (0.57
⫾
0.25%);
whereas in CD4
⫺/CD8
⫺T cells, these cells, expressing
vR-NAex, represented a sizable fraction (15%
⫾
2%) of all HIV
RNA
⫹cells.
Taken together, these observations confirm that viral
tran-scription is greatly enhanced in HIV-infected CD4
⫺/CD8
⫺T
cells compared to the level in CD4
⫹T cells.
Comparison of T-cell- and plasma-derived HIV-1
quasi-species.
In order to assess a potential compartmentalization
between HIV-1 quasispecies in different cell types and plasma
virus, molecular clones spanning the C2 to C3 region of the
env
gene (32) were isolated from plasma RNA, from CD4
⫹and
CD4
⫺/CD8
⫺T cells (DNA and total RNA), and from the
vRNAex fraction of CD4
⫺/CD8
⫺T cells of two viremic
pa-tients (Fig. 6). Within each patient’s sequence cluster, one
major and several minor phylogenetic groups were present.
However, there was no evidence for compartmentalization
be-tween PBMC subsets or different nucleic acid fractions, as we
observed clones from all fractions in every major phylogenetic
group. Furthermore, the genetic diversities were similar in
plasma and in CD4
⫹and CD4
⫺/CD8
⫺T cells. These findings
suggest that HIV-infected CD4
⫹and CD4
⫺/CD8
⫺T cells in
PBMC contain quasispecies which are closely related to each
other and to the dominant viral sequences prevailing in
plasma.
DISCUSSION
[image:10.585.135.450.71.237.2]In the present study, we assessed HIV RNA expression in
the major host cell types of peripheral blood using highly
sensitive, patient-matched RT-PCR combined with terminal
FIG. 5. Distribution of cellular transcription categories in CD4
⫹and CD4
⫺/CD8
⫺T cells. Average class I, class II, and class III contributions
to total HIV-1 RNA
⫹cells were calculated for CD4
⫹T cells (CD4
⫹) from untreated and treated patients and for CD4
⫺/CD8
⫺T cells (DN [double
negative]) from untreated patients. Analyses comprised one data point per visit, resulting in duplicate measurements for CD4
⫹T cells for all
patients except for patients 03, 08, and 11. Error bars depict standard errors of the means.
on November 8, 2019 by guest
http://jvi.asm.org/
dilution. This novel approach allowed for discrimination
be-tween the viral transcription levels in latently versus
produc-tively infected cells. Most noteworthy, our data suggest that,
contrary to current belief, productive HIV-1 infection in
pe-ripheral blood may be restricted to a major extent to T-helper
lymphocytes of a CD4/CD8 double-negative phenotype.
As demonstrated by bulk RNA analysis, by assessment of
viral transcriptional per-cell expression patterns, by
determi-nation of the frequencies of infected cells expressing HIV
RNA, and by quantification of HIV DNA, the lion’s share of
active HIV-1 in PBMC could be assigned to the T-lymphocyte
population. Thus, resting and activated CD4
⫹T cells were
subjected to a detailed investigation, which revealed that both
subsets exhibited similar viral transcriptional activities and
fre-quencies. Although we observed an accumulation of HIV-1
RNA
⫹CD4
⫹T cells in the activated cell fraction, this was only
moderate and may reflect preferential infection of activated
cells (10) and, possibly, stimulation of formerly
transcription-ally silent provirus.
Such a lack of association of activation markers with viral
transcriptional strength was unexpected, since activated CD4
⫹T cells are widely considered to be primarily responsible for
viral propagation (6, 56, 63, 75). Possibly the ambiguity of cell
surface markers in designating a cell’s potential to support
HIV-1 replication (11, 15, 34, 67, 77, 78) might have
con-founded the analysis of activated CD4
⫹T cells to some extent.
In particular, the inclusion of CD25, in addition to CD69 and
HLA-DR as in similar studies (11, 12, 79), may have resulted
in the inclusion of primary CD25
⫹regulatory T cells (59)
lacking a classical activation profile.
Notwithstanding, the apparent lack of viral transcriptional
enhancement in the population of HIV-infected activated
CD4
⫹T cells, compared to that in resting lymphocytes, may be
primarily related to the HIV-1-induced downregulation of
CD4 surface expression (7, 53). Hence, activated CD4
⫹T cells
with transcriptionally active proviral integrants may have an
extremely short half-life, simply because they may rapidly
switch to a CD4
⫺phenotype and would not be identifiable as
T-helper cells in cell-sorting experiments using the CD4
marker. In agreement with this assumption, we have gathered
strong evidence that productively infected T lymphocytes in
vivo are characterized by down-modulation of their CD4
re-ceptor in vivo and that HIV-infected CD4
⫺/CD8
⫺T cells
exhibit generally augmented viral transcription, as reflected by
the following findings.
(i) HIV-infected cells with elevated viral transcription (class
II and class III) contributed 74% of all cells expressing viral
RNA in CD4
⫺/CD8
⫺T cells, in stark contrast to CD4
⫹T cells,
which were dominated (
⬎
78%) by cells displaying basal HIV
transcription.
(ii) Expression of vRNAex, a strong correlate of ongoing
viral replication in PBMC (19, 20, 22), was predominantly
confined to CD4
⫺/CD8
⫺T cells.
(iii) The specific per-cell expression of usRNA in cells with
basal viral expression (class I) was significantly higher than in
CD4
⫹T cells of untreated patients (group B). In addition, the
specific per-cell expression of msRNA in virus-infected cells of
transcriptional class II, albeit equal to that of CD4
⫹cells of
untreated patients, was substantially augmented compared to
the expression in CD4
⫹cells of patients on ART.
Very likely, HIV-infected CD4
⫺/CD8
⫺T cells originate
from infected CD4
⫹T cells, as supported by our phylogenetic
analysis showing similar genetic diversities in
env
clones
de-rived from CD4
⫹and CD4
⫺/CD8
⫺T cells and suggesting an
absence of compartmentalization.
[image:11.585.45.284.67.332.2]In concordance with this concept, CD4
⫺/CD8
⫺T cells
har-bored all viral transcriptional categories also found in CD4
⫹lymphocytes. The finding that, besides the accumulated class II
and class III cells, some class I HIV-infected cells with basal
transcriptional activity also resided in the CD4
⫺/CD8
⫺T-cell
population, could indicate that this fraction of infected CD4
⫺/
CD8
⫺T cells represents cells which reduce HIV transcription
following a burst of virion production to recuperate to viral
latency (47). Conversely, it is likely that class II expression in
CD4
⫺/CD8
⫺T cells may in part reflect latently infected cells in
transition to productive infection, because infected cells may
lose surface CD4 receptors before active production of viral
structural proteins and shedding of virions sets in (7, 53). This
assumption is supported by our observation that cells
harbor-ing vRNAex (class III), even though markedly accumulated in
the CD4
⫺/CD8
⫺T-cell subset, were still much less frequent
than cells expressing msRNA (class II). Furthermore, there is
evidence that the expression of msRNA (19, 74) may result in
the expression of the Nef protein in latently infected cells,
which may predispose these cells to rapid induction of virus
production (19, 62) and to CD4 downregulation.
FIG. 6. Uniform distribution of HIV-1
env
quasispecies in plasma
and CD4
⫹and CD4
⫺/CD8
⫺T cells. Neighbor-joining phylogenetic
tree of
env
C2-V3-C3 sequences obtained from patients 05 and 06
constructed using MEGA 3.1. Single molecular clones (mean
n
⫽
14;
range, 5 to 16) were obtained from plasma RNA, from CD4
⫹T cells
(CD4
⫹; total RNA and total DNA), and from CD4
⫺/CD8
⫺T cells
(DN [double negative]; total RNA, vRNAex, and total DNA). Symbols
indicate individual clones and numbers above branches show bootstrap
values. Mean diversities for each cell type are indicated.
on November 8, 2019 by guest
http://jvi.asm.org/
Thus, HIV-1-infected cells of a CD4
⫺/CD8
⫺phenotype
ap-pear to be a dynamic population closely connected with
HIV-1-infected CD4
⫹T cells. Extending the observations of
Marodon et al. (42), and supported by a recent report
dem-onstrating the occurrence of HIV-1-infected CD4
⫺/CD8
⫺T
cells during incomplete response to antiretroviral treatment
(8), our findings suggest that HIV RNA
⫹CD4
⫺/CD8
⫺T cells
may be the predominant cell type supporting ongoing HIV-1
production in peripheral blood. Given that studies of HIV-1
infection in lymphoid tissues using combinations of in situ
hybridization and in situ histochemistry have reported
produc-tive infection of CD4
⫹T cells (55, 69), the role of
HIV-1-infected CD4
⫺/CD8
⫺T-helper lymphocytes requires further
study in other body compartments.
Complementary to the notion that ongoing HIV-1
produc-tion may be exclusively associated with CD4
⫺/CD8
⫺T cells in
peripheral blood, our analysis suggests that the vast majority of
circulating infected CD4
⫹T cells transcribing the proviral
ge-nome does so with an efficiency insufficient for virion
produc-tion. This is primarily supported by the vast predominance of
class I HIV RNA
⫹cells in CD4
⫹T lymphocytes. Moreover,
even in a viremic milieu, only a minority of infected CD4
⫹T
cells were found to express HIV-1 msRNA. The bulk of these
class II CD4
⫹T cells may reflect latently infected cells with
subthreshold expression of msRNA, insufficient to mediate the
expression of structural viral proteins (19, 40, 62). A further
indication that HIV-infected CD4
⫹T cells are mainly of a
latent or subproductive type was the finding that the presence
of viral particles (vRNAex) on CD4
⫹T cells was extremely low
and may reflect virions randomly attached to surface CD4
rather than virus emerging from productively infected CD4
⫺/
CD8
⫺T cells. Furthermore, the expression of the classical
activation markers CD25, CD69, and HLA-DR in CD4
⫹T
cells appeared to be associated with susceptibility to infection
rather than with vigorous transcriptional activity, which further
supports the concept that productive infection may be initiated
in CD4
⫹T cells but actually takes place, after downmodulation
of the CD4 receptors, in CD4
⫺/CD8
⫺T-helper lymphocytes.
Despite its sophisticated design, using PCR assays with
primers adjusted to the predominant viral isolates in
combina-tion with limiting dilucombina-tion analysis, which allowed the
decipher-ment of the numbers and the activities of infected cells, the
present study has some limitations.
First, PBMC subsets were collected by using magnetic cell
sorting, which is less specific than FACS, in order to allow
rapid and gentle isolation of cells and reliable RNA extraction.
Second, the division of HIV RNA
⫹cells into three
tran-scriptional categories provides only an approximate model,
with limited resolution, which needs to be further refined by
long-term longitudinal assessment of ART, by the
determina-tion of different splice variants of msRNA (19), and by using
smaller dilution steps.
Third, due to the use of end-point dilution in the present
study, comprising in total almost 6,000 PCR analyses, only a
limited number of patients in each group could be studied.
In conclusion, using a novel approach combining limiting
dilution with ultrasensitive patient-matched real-time
RT-PCR, this study is the first to quantify HIV-1 RNA expression
at a single-cell level and to determine the frequency and
dis-tribution of both latently and productively infected cells in
PBMC subsets ex vivo. The fact that productive HIV-1
infec-tion in peripheral blood appeared to be largely restricted to the
distinct CD4
⫺/CD8
⫺cellular phenotype suggests that specific
quantification of ongoing HIV-1 replication during ART may
be attempted by the analysis of viral transcripts in this cell type.
Furthermore, our findings imply that CD3
⫹lymphocytes,
rather than CD4
⫹T cells, should be used for monitoring
cel-lular HIV-1 replication ex vivo in order to include the
com-plete range of virus-expressing T-helper lymphocytes.
ACKNOWLEDGMENTS
We thank the participating patients for their commitment; Christine
Grube, Christine Schneider, Milo Huber, Doris Baumann, and Roland
Hafner for excellent patient care; Eva Niederer and Mustafa Oezbas
(Institute for Biomedical Engineering, ETH Zu
¨rich) for dedicated
support in flow cytometry; Alexandra Trkola, Amapola Manrique,
Michael Huber, Viktor von Wyl, and Annette Audige
´ for advice and
helpful discussions; Joseph Wong for critical review of the manuscript;
and Ingrid Nievergelt and Christine Vo
¨gtli for administrative
assis-tance.
Financial support was provided by the Novartis Foundation (grant
02A03), the Roche Foundation (grant 281-2005), the Bonizzi Theler
Stiftung, Stiftung fu
¨r Wissenschaftliche Forschung der Universita
¨t
Zu
¨rich, Jubila
¨umsstiftung Swiss Life, Olga Maienfisch Stiftung, the
Swiss National Science Foundation (grant 3100A0-112670), Hermann
Klaus Stiftung, Abbott Inc. (an unrestricted educational grant,
SWIT-02-002), and the Swiss HIV Cohort Study (grant 477).
The members of the Swiss HIV Co
![FIG. 5. Distribution of cellular transcription categories in CD4�to total HIV-1 RNAnegative]) from untreated patients](https://thumb-us.123doks.com/thumbv2/123dok_us/163183.40327/10.585.135.450.71.237/distribution-cellular-transcription-categories-total-rnanegative-untreated-patients.webp)
![FIG. 6. Uniform distribution of HIV-1 env(DN [double negative]; total RNA, vRNAex, and total DNA)](https://thumb-us.123doks.com/thumbv2/123dok_us/163183.40327/11.585.45.284.67.332/fig-uniform-distribution-double-negative-total-vrnaex-total.webp)