DIFFERENT BONE DENSITIES: AN IN VITRO STUDY
Dissertation submitted to
THE TAMILNADU Dr. M.G.R. MEDICAL UNIVERSITY
In partial fulfilment for the degree of
MASTER OF DENTAL SURGERY
BRANCH V
IMPLANTS AT DIFFERENT BONE DENSITIES: AN IN VITRO STUDY” is a
bonafide work done by Dr. INDRA . AN under my guidance during her post graduate study period between 2015 – 2018.
This dissertation is submitted to THE TAMIL NADU Dr. M.G.R. MEDICAL UNIVERSITY in partial fulfilment for the degree of Masters in Dental Surgery, in Branch V – Orthodontics and Dentofacial Orthopaedics. It has not been submitted either partially or fully for the award of any other degree or diploma.
Dr. RAJU JAGADEEP M.D.S Dr. R.K. VIJAYAKUMAR M.D.S
Guide and Professor Professor and Head Department of Orthodontics Department of Orthodontics Sri Ramakrishna Dental College Sri Ramakrishna Dental College
Dr. V. PRABHAKAR M.D.S
Pincipal
Sri Ramakrishna Dental College
Date:
NAME OF THE CANDIDATE Dr. AN. Indra
TITLE OF DISSERTATION Deflection Changes Of Mini Implants At Different Bone Densities: An In Vitro Study PLACE OF STUDY Sri Ramakrishna Dental College And
Hospital
DURATION OF COURSE 2015 – 2018
NAME OF GUIDE Dr. Raju Jagadeep
HEAD OF THE DEPARTMENT Dr. R.K. Vijaykumar
I hereby declare that no part of the dissertation will be utilized for gaining financial assistance for research or other promotions without obtaining prior permission from the Principal, Sri Ramakrishna Dental College And Hospital. In addition, I declare that no part of this work will be published either in print or electronic without permission from the guide who has been actively involved in this dissertation. The author solely has the rights for publishing the work with prior permission from the Principal, Sri Ramakrishna Dental College And Hospital, Coimbatore.
Principal Signature of candidate Sri Ramakrishna Dental College And Hospital
Urkund Analysis Result
Analysed Document: thesis.docx (D34460533)
Submitted: 1/8/2018 6:48:00 PM
Submitted By: [email protected]
Significance: 1 %
Sources included in the report:
Title.docx (D31652819)
Bölüm 1ing.docx (D29963824)
https://www.jstage.jst.go.jp/article/jpr/54/3/54_3_133/_article
Instances where selected sources appear:
This is to certify that this dissertation work titled DEFLECTION CHANGES OF MINI IMPLANTS AT DIFFERENT BONE DENSITIES: AN IN VITRO STUDY of the candidate Dr. INDRA . AN with registration Number 241519351 for the award of MASTERS IN DENTAL SURGERY in the branch of ORTHODONTICS AND DENTOFACIAL ORTHOPAEDICS. I personally verified the urkund.com website for the purpose of plagiarism check. I found that the uploaded thesis file contains from introduction to conclusion pages and result shows 1 percentage of plagiarism in the dissertation.
Guide & supervisor sign with seal. Prof.(Dr.) Raju Jagadeep M.D.S., DCI.NO – 8810-A
Department of Orthodontics and Dentofacial Orthopaedics
immeasurable blessings showered on me to finish my dissertation.
I consider this opportunity given to me to do my post graduation in this prestigious institution under the able leadership of our respected principal Dr. V. Prabhakar. M.D.S., and our director Ltn Gen. Dr. Muralimohan. M.D.S., as the most valuable one in my life.
Sincere gratitude to my Head of Department Dr. R.K. Vijayakumar. M.D.S., for the continuous encouragement, support, valuable ideas which took me forward and grow better in my studies.
I am immensely pleased to place on record my profound gratitude and heartfelt thanks giving to my guide Dr. Jagadeep Raju. M.D.S., for being the source of light through out the academic years. The experiences and positive thoughts he shared towards every step motivated me to aim for excellence.
With exaltation, I express my gratefulness to Dr. Pradeep Kumar. M.D.S., for his time, constructive ideas, suggestions helped me to produce enhanced work during the course of study.
I owe my sincere gratitude to Dr. Fayyaz Ahamed. M.D.S., for his expertise, patience and helping me to seek wisdom beyond the course work.
My heartfelt thanks to Dr. AfroseKhanna. M.D.S., for his continuous support and encouragement during the course of study.
life who stood at all times comforting me with love and affection . Guidance and sacrifice of MY PARENTS, who have been the driving force for me to achieve what I possess today.
I express my gratitude to Dr. J.Sekkizhar. PhD., assistant professor, PSG Institute of Management, for his expertise rendered and valuable help extended for carrying out
the statistical analysis of my research study.
I express my sincere appreciation for my seniors Dr. Shireen, Dr. Anisha Dr.Khaniya, Dr. Yaseen, Dr. Sangeeth, Dr. Mohamed Bava, for their pleasant association and help in various forms.
My heartfelt thanks to my colleague Dr. Neeraja Kurup for spporting and understanding me when things were tough.
CONTENTS
1.
INTRODUCTION 01
2.
AIMS AND OBJECTIVES 06
3.
REVIEW OF LITERATURE 07
4.
MATERIALS AND METHODS 31
5.
RESULTS 41
6.
DISCUSSION 58
7.
SUMMARY AND CONCLUSION 66
Orthodontic treatment involves the application of optimal force systems to teeth, with the intention of inducing a biological response that results in tooth movement.1 Orthodontists accomplish this by constructing appliances that will produce certain desired tooth movements through precise application of forces using auxiliaries such as elastics, springs, and flexible wires composed of various alloys.
Newton’s third law states that for every action, there is an equal and opposite
reaction.2 When forces are applied between groups of teeth, one can expect resultant movements of all groups involved to varying degrees. Since most orthodontic appliances are tooth borne, reactive forces generated by the appliance system can result in undesired tooth movements. Proffit defines the term anchorage in orthodontic applications as “resistance to unwanted tooth movements.”1
Traditionally, anchorage was provided extra-orally by the use of headgears and facemasks or intra-orally by acrylic pads resting on palatal tissues and groups of teeth consolidated as a unit.1 Ideally, teeth that serve as anchorage units should remain stationary, but in reality, undesirable side effects result from force systems that rely on other teeth within the same or opposing arch for support.
Temporary Anchorage Devices (TADs) are routinely used as a means of skeletal anchorage in contemporary orthodontics. Their multifaceted use has revolutionized our specialty as we can use them as means for direct or indirect anchorage for various types of orthodontic tooth movements. Miniscrew implants (MSIs) are a treatment adjunct designed to provide absolute skeletal anchorage in orthodontics. They have gained in popularity due to their simplicity in placement, low cost, patient-acceptance and ability to eliminate patient compliance issues in treatment.3
Various materials were used for the manufacturing of mini screws before the use of titanium and its alloys came into existence. Some of the materials previously considered were Cobalt -Chromium alloy (Vitallium) and Stainless steel.
Compared to 316L stainless steel, the Ti alloy implants, made with aluminum (Al) and vanadium (V) [Ti-6Al-4V] alloys, are roughly of equal strength, but it has half the elastic modulus. So titanium implants have the advantage over stainless steel as they have high bioactivity and more flexibility that improve integration and mechanical fixation.4 Torsional properties of stainless steel screws are different from titanium screws. Stainless steel bone screws are easier to handle because the surgeon can feel the onset of plastic deformation and this provides adequate pre-warning to avoid over-torquing the screw while titanium screws break suddenly.4
Thread designs of orthodontic mini-screws have evolved over the years. Selftapping designs, otherwise known as “non-drill-free” screws, require pilot-hole preparation prior to
insertion. Today, most manufacturers are promoting the advancement of self-drilling or “drillfree designs where mini-implants are placed in a one step procedure eliminating the
need for pre-drilling.
Mini-screw diameters fall within 1.0-2.3mm, and lengths range from 4mm-20mm. Currently, titanium alloy mini-implants of 1.3-1.8mm in diameter and 6-10mm in length, are most popular in everyday clinical orthodontics.6
Bone quality also plays a major role when deciding on a mini-implant placement site as it is among the most important factors for achieving good primary stability.7 It is important for a clinician to understand that bone density and cortical bone thickness varies throughout the oral cavity. Bone density in general is higher in all regions of the mandible than in the maxilla. It has been reported that the placement site should have a cortical bone thickness of more than 1.0mm in order to attain adequate primary stability for mini-implant success.8
Bone density is classified into 4 groups based on microscopic cortical and trabecular bone characteristics:
D1 - Primarily dense cortical bone
D2 - Dense to thick porous cortical bone on the crest and coarse trabecular bone
D3 - Thin porous cortical crest and fine trabecular bone
D4 - Minimal to no crestal cortical bone
Regions of D1- D3 bone have been found to be adequate for temporary anchorage device (TAD) insertion. TADs placed in D1 and D2 bone exhibit lower stress at the screw-bone interface and may provide greater stationary anchorage during loading. Placement in D4 bone is not recommended owing to the high failure rate associated with it (35-50 percent).12
Insertion torque is the result of frictional resistance between screw threads and bone and is reported to determine primary stability. Insertion and removal should be done at a slow steady rate with a continuous force so that the load on both the screw and bone will be low. All mini screws are susceptible to breakage upon reaching a certain torque level. However there is a range of safety between recommended insertion torque and maximum insertion torque. McManus et al13 reported that the mean maximum placement torque in the maxilla was 4.6 Newton centimetres [Ncm] and in the mandible it was 8.64 Ncm. Friberg et al14 described a positive correlation between mini-implant insertion torque and bone density values.
Mini implant failure can involve factors related to the clinician, the patient and the screw itself. According to Kuroda et al 15, root proximity is one of the major risk factors for failure of mini implants. Placement of a mini screw too close to a root can also result in insufficient bone remodelling around the screw and transmission of occlusal forces through the teeth to the screws leading to implant failure. Considering that majority of the mini implants for orthodontic usage are placed in inter-dental areas, a slight deflection from the intended path can thus affect their success.
AIM :
The aim of this in vitro study is to radiographically evaluate the deflection of titanium alloy self-drilling mini implants from the intended path that occurs during placement.
OBJECTIVES:
(1) To determine the deflection changes of the mini implants from its intended path of insertion.
Gainsforth and Highley (1945) introduced the concept of skeletal anchorage with their animal study. In each of five dogs in their experiment, a screw of vitallium was placed in the anterior border of the ramus of the mandible, one side on each dog. Traction was applied to the screw by means of orthodontic elastics connected to a maxillary appliance. Examination of the bones from sacrificed animals showed a wide destructive process after implantation of either the screws or rings in the rami. Tooth movement was accomplished using basal bone anchorage, but an effective force could not be maintained for more than thirty one days in any case. All of the screws came out in sixteen to thirty one days.
Misch et al (1988)17 proposed the following four bone density groups based on microscopic cortical and trabecular bone characteristics: D1, primarily dense cortical bone; D2, dense to thick porous cortical bone on the crest and coarse trabecular bone; D3, thin porous cortical crest and fine trabecular bone; and D4, minimal to no crestal cortical bone. Suggested implant designs, surgical protocols, healing processes, treatment plans, and progressive loading time spans should be modified for the individual bone density types.
Melsen et al (1998)18 investigated the Aarhus Mini-implant by inserting them in the infra-zygomatic crest and the mandibular symphysis of Macaca monkeys and immediately loading the implants with a force ranging between 0.25-0.50 N in 1 to 6 months period of time. Histologically the screws exhibited a degree of osseointegration varying from 10 to 50 % which was time dependent, but independent of the type of bone and the amount of applied force.
Tehemar et al (1999)19 evaluated factors affecting heat generation during implant site preparation and stated that heat generation increases during drilling in dense bone. Therefore, when placing the mini implants into high density areas such as retromolar and posterior areas in the mandible, clinicians must be careful not to generate heat. Heat generation can be prevented by irrigating abundantly with saline solution, not applying too much pressure on the bone and not using a worn drill. Also, large diameter drill can be used instead of a small diameter drill.
Masumoto et al (2001)20 experimentedusing 31 dry skulls in a group of Japanese males, and measured buccal cortical bone thickness at the mandibular first molar. An observed range of 2.27 mm to 3.82 mm was found for bone thickness at the mandibular first molar. Each skull was categorized into three groups: short, average, and long facial type. These categorizes were based upon Frankfort-mandibular-plane angle and correlated to buccal cortical bone thickness. The short facial type and small mandibular plane angle had significantly increased buccal cortical bone thickness.
Tadas et al (2003) performed a 3- dimensional finite element analysis to evaluate the influence of implant length as well as that of bone quality, on the stress/strain in bone and implant. The results of this study suggest that bone of higher rather than lower density might ensure a better biomechanical environment for implants. Moreover, longer screw-type implants could be a better choice in a jaw with bone of low density.
Kim et al (2005)23evaluated the effects of drilling procedure on the stability of the screws under early orthodontic loading. 32 screws were inserted into the jaw of 2 beagles. Screws in drilling group were inserted into the site that had been drilled with a pilot drilling bur, and those in the drill free group were inserted without drilling. A force of 200 -300g was applied using nickel- titanium coil springs 1 week after insertion. Twelve weeks after insertion, mobility was tested and the screws with the surrounding bone were prepared for histomorphic evaluation. Less mobility and more bone - to – metal contact was seen in drill free group.
Deguchi et al (2006)25 investigated maxillary and mandibular cortical bone thickness mesial and distal to the first molars, distal of the second molars, and in the premaxillary region of ten patients. Cone beam CT scans with slice thickness of 0.5mm were taken in high-resolution mode and measurements of cortical bone thickness were made at various angles (30°, 45°, and 90°) relative to a line parallel to the long axis of the adjacent teeth in the maxilla and mandible. A significant difference between maxillary and mandibular measurements mesial and distal to the first molar and distal to the second molar was observed. Reported measurements of lingual cortical bone thickness were similar to those at the corresponding buccal positions, except at the distopalatal aspect of the second molars where significantly thicker cortical bone was present. In the premaxilla, mean cortical bone thickness at A-point was significantly less than at the anterior nasal spine.
Park et al (2006) examined the success rates and find factors affecting the clinical success of screw implants used as orthodontic anchorage. Mobility, jaw (maxilla or
mandible), and side of placement (right or left), and inflammation showed significant
differences in success rates. To minimize the failure of screw implants, inflammation around
the implant must be controlled, especially for screws placed in the right side of the mandible
Poggio et al (2006)28 provided clinical indications for a safe application of the miniscrews. Volumetric tomographic images of 25 maxillae and 25 mandibles were examined. For each interradicular space, the mesiodistal and the buccolingual distances were measured at two, five, eight, and eleven mm from the alveolar crest. In the maxilla, the greatest amount of mesiodistal bone was on the palatal side between the second premolar and the first molar. The least amount of bone was in the tuberosity. The greatest thickness of bone in the buccopalatal dimension was between the first and second molars, whereas the least was found in the tuberosity. In the mandible, the greatest amount of mesiodistal dimension was between first and second premolar. The least amount of bone was between the first premolar and the canine. In the buccolingual dimension, the greatest thickness was between first and second molars. The least amount of bone was between first premolar and the canine.
Song et al (2007)29 evaluated the effect of cortical bone thickness on the maximum insertion and removal torque of different types of self-drilling mini-screws and to determine if torque depends on the screw design. Differences in the cortical bone thickness had little effect on the maximum insertion and removal torque in cylindrical type. There were significant relationships between cortical bone thickness, maximum insertion and removal torque, and implantation time in each type of self-drilling mini-screw. Since different screw designs showed different insertion torques with increases in cortical bone thickness, the suitable screw design should be selected according to the cortical thickness at the implant site.
Chaddad et al (2008)30 examined the role of surface characteristics on primary stability and survival rates of orthodontic mini screws. Seventeen machined smooth titanium Dual-Top orthodontic mini screws (1.4mm, 1.6mm, and 2.0mm diameters; 6.0mm, 8.0mm, and 10.0mm lengths) and fifteen sandblasted, acid-etched surface treated mini screws with a 2mm polished collar (1.8mm diameter; 8.5mm, 9.5mm, and 10.5mm lengths) were placed in ten patients. Pre-drilling of the cortical bone was done prior to insertion for all mini screws, and a torque ratchet was used in placement to determine insertion torque values. Immediate loading of all mini-screws was performed with a 50- 100g force (NiTi coil-spring or elastic chain), which was increased to 250g of applied force after two weeks. There were no statistically significant differences in primary stability or survival rates over the 150-day study period between those mini screws with and without surface treatment to enhance osseointegration.
Cheol Hyun Moon et al (2008) determined the factors related to success rate of orthodontic miniscrew implants placed at the attached gingiva of the posterior buccal region. They concluded placement site could be considered as one of the important factors to get better result as bone quality is known to be one of the major factors in the stability of mini screws.
Ilser et al(2008)32 compared the parameters associated with implant insertion using two different methods of enhancing implant primary stability and to identify any relationship between these parameters at implant insertion. A total of 60 implants were placed in the maxillary posterior regions of 22 patients. The bone densities at the implant sites were recorded using a computerized tomography machine in Hounsfield unit (HU). The maximum insertion torque data were recorded. Strong correlations were observed between the bone density and insertion torque, and implant stability values at implant placement. The results of this study suggest that using thinner drills for implant placement in the maxillary posterior region where bone quality is poor may improve the primary implant stability, which helps clinicians to obtain higher implant survival rates.
Kim et al (2008)33 compared the stability of cylindrical miniscrews, 7 mm in length, with that of tapered mini screws 5 mm in length, using torque values to determine if the healing time before loading affects the stability of the mini screw and if the insertion torque is assosciated with the removal torque measured after a few weeks of healing in tibias of twelve rabbits.
shape is more advantageous than the cylindrical shape. Removal torque did not increase significantly over time. They recommended immediate loading of miniscrew.
Ono et al (2008)11 investigated cortical bone thickness in the posterior alveolar regions of the maxilla and mandible in forty-three orthodontic patients. Cortical bone thickness was measured at 1.0mm intervals in a plane parallel to the occlusal plane of each tooth from 1mm to 15mm below the level of the alveolar crest. Overall, average cortical bone thickness ranged from 1.09mm to 2.12mm in the maxilla, and from 1.59mm to 3.03mm in the mandible, with maxillary cortical bone thickness significantly thinner than that observed in the mandible. More specifically, mesial to the first molar, average cortical bone thickness ranged from 1.09mm to 1.62mm in the maxilla, and 1.59mm to 2.66mm in the mandible.
Rubelisa et al (2008)34 evaluated the assosciation between trabecular bone density measurements of implant sites. Differences in the bone densities of the 4 anatomical regions in the mouth were significant, with the mandible yielding a higher mean density value, followed by the anterior maxilla, posterior mandible and posterior maxilla. This confirms the importance of a site specific bone tissue evaluation prior to implant installation.
Turkyilmaz et al (2008) presented clinical study to determine the local bone density in dental implant recipient sites using computerized tomography (CT) and to investigate the influence of local bone density on implant stability parameters and implant success. Insertion torque and resonance frequency analysis were used as implant stability parameters. The peak insertion torque values were recorded with OsseoCare machine. CT is a useful tool to determine the bone density in the implant recipient sites, and the local bone density has a prevailing influence on primary implant stability, which is an important determinant for implant success.
Chun et al (2009)37 evaluated bone density differences between interradicular sites. Bone densities in most areas were higher than 850 HU. Bone densities in both maxilla and mandible significantly increased from the alveolar crest toward basal bone in posterior areas, while the opposite was observed in anterior areas. Bone densities progressively increased from anterior to posterior areas in the mandible. The results suggest that mini-implants for orthodontic anchorage may be effective when placed in most areas with equivalent bone density up to 6 mm apical to the alveolar crest. Site selection should be adjusted according to bone density assessment.
Jan D’haese et al (2009)38 in their study of prosthetic implants observed the
Jin Hugh Choi et al (2009)39 determined bone density at various orthodontic implant sites and compare them according to depth and area. Bone density tended to decrease with increasing depth, particularly in the posterior area. Mean bone density showed a progressive increase from posterior to anterior region. The mean bone densities between the maxilla and the mandible showed higher values in the mandible, and these differences were more significant on the buccal side of the posterior. The differences in bone densities according to depth and area should be considered when selecting and placing miniscrew implants.
Motoyoshi et al (2009)40 evaluated Cortical bone thickness at mini-implant placement sites in 65 orthodontic patients and was found to be directly proportional to the success rate of the mini-implant. To examine the biomechanical effects of cortical bone thickness, finite element models were made for cortical bone thickness from 0.5 to 1.5 mm, at 0.25-mm intervals. Cortical bone models without cancellous bone were constructed to examine the biomechanical influence on cortical bone after cancellous bone resorption. Cortical bone thickness influenced the stresses in the cancellous bone, but could not directly influence the stresses in the cortical bone. For Cortical bone thickness < 1 mm, the cancellous bone models exhibited von Mises stresses exceeding 6 MPa, and the cortical bone models without cancellous bone showed von Mises stresses exceeding 28 MPa.
Noble et al (2009)41 recommended that as long as root damage can be avoided, mini implants should be placed as perpendicular to the bone as possible (90˚ angulation). Also concluded that placement of mini implants at 90˚ to the cortical plate is the most retentive
Stahl et al (2009) evaluated the effect of various Deflections of the implants varied between 2 μm and 20 μm. The deflections of the implant increased as Young’s modulus of
the cancellous bone dropped with a cortical thickness of 1 mm. When the load direction was tilted in a buccal direction, the stresses and amount of strain were reduced by as much as 35%.parameters in regard to various implant types, sizes, and load directions using the finite element method.
Zhao et al (2009)43 in his study of different healing times before loading found that 3 weeks is an important time point for implant-bone units to gain biomechanical strength and integration. Osseointegration found after CT scans and maximum force during pullout testing were significantly correlated with healing time.
Borges et al (2010)44 assessed maxillary and mandibular alveolar and basal bone density in Hounsfield units In the maxilla, the greatest bone density was found between the
premolars in the buccal cortical bone of the alveolar region. The maxillary tuberosity was the
region with the lowest bone density. Bone density in the mandible was higher than in the
maxilla, and there was a progressive increase from anterior to posterior and from alveolar to
basal bone.
screws under 8 mm in length and 1.2 mm in diameter should be avoided. Immediate or early loading up to 200 cN was adequate and showed no significant influence on screw stability.
Florvaag et al (2010)46 examined five self-drilling and self-tapping mini-screw types with variable diameters ranging from 1.6mm to 2.0mm, and minimum lengths of 8mm. Overall, one hundred and ninety six mini screws were placed, with and without pilot hole preparation in thirty bovine femoral heads, utilized for the striking similarity in cortical bone thickness relative to human maxillary and mandibular alveolar cortices. All mini screws were inserted perpendicular to the bony surface, but pull-out testing was performed at three inclinations relative to the long axis of the mini screw: axially, 20°, and 40°. The three cylindrical mini screw designs placed with drill-free insertion achieved the highest axial pull-out values. The cylindrical mini screws also exhibited the greatest mean values for pull-pull-out tests performed at 20° angulations. However, it was the cylindrical mini screws that showed the most significant decrease in pull-out resistance.
Li et al (2010)47 studied the prosthetic implants under finite element analysis. The results indicated that in the posterior mandible, implant diameter plays more significant roles than length in reducing cortical bone stress and enhancing implant stability. However, implant length is more effective than diameter in reducing cancellous bone stress under loading.
success in the posterior maxilla, rather than implant selection, careful preoperative evaluation of the cortical bone at the planned implant site is recommended. If this cortical bone is very thin or even lacking, implant treatment should be carried on with caution by progressive loading in the range of functional loads.
Yan Chen et al (2010)49 measured insertion and removal torque of 360 self drilling micro implants inserted in three types of artificial bone. They concluded that IT is an important indicator for insertion resistance and holding power. The ideal mechanical IT is dependent on the diameter of the implants. Using a self-drilling technique, micro-implants with a diameter of less than 1.3 mm are unsuitable for insertion into a bone with a density greater than 40 pcf mechanically.
Barros et al (2011)50 evaluated the effect of mini-implant diameter on fracture risk and selfdrilling efficacy. 405 mini-implants with 9 diameters from 1.2 to 2.0 mm were used. The fracture resistance index was remarkably greater for each 0.1 mm added in diameter. The placement torque increased significantly, whereas the axial placement load was progressively reduced during placement. Increases in mini-implant diameters significantly influenced the increases of placement torque and fracture torque on quantities that progressively reduced the fracture risk. The self-drilling efficacy was not strongly influenced by diameter.
showed a high correlation with the primary stability of the implants. Hence, preoperative density value estimations by CBCT may allow clinicians to predict implant stability.
Marquezan et al (2011)52 evaluated bone density in two bovine pelvic regions and verify the primary stability of miniscrews inserted into them. However, the miniscrew primary stability was not different when varying the bone type. Insertion torque and pull out strength were not influenced by these differences in bone density when cortical thickness was about 1 mm thick.
Oguz Ozan et al (2011)53 evaluated the correlation between the density of bone where implants were placed and the angular deviations that occur between the virtually planned and actually placed implants. They concluded that the lower bone density values have resulted in the greater angular deviations in the group. This deviation might have been derived from the free hand placement of implants and poor quality of bone.
Wilmes et al (2011) quantitatively analysed the impact of bone quality and predrilling diameter on the insertion torque of five different mini implants. Twenty pig iliac bone segments were discussed and embedded in resin. The insertion torques of mini implant of sixes 1.6x8mm, 1.6x10mm, and 2.0x10mm of two different manufacturers were measured. The pilot drilling was performed using a bench drilling machine at 915 rpm with pilot drills 1.1, 1.2 and 1.3 mm. During rotation, insertion and removal torques are measured. Insertion torques increased with smaller pre-drilling diameters in all mini-implant types. The results clearly showed that bone quality, the design and size of the mini- implants and the preparation of the implantation site influence insertion torques, and therefore on primary stability.
Woodall et al (2011)55 found that the anchorage resistance of an implant placed at 90˚ to the alveolar bone was dramatically greater than that of an implant placed at either 60˚ or 30˚. The cortical bone stress created by loading 90˚ placed implants was less than the bone
stress created by loading screws at either 60˚ or 30˚.
Abhishek et al (2012)56 evaluated maximum equivalent stress distribution and maximum deflection assosciated with mini implants placed in 2 different cortical bone thickness. Greater stress and deflection were observed with 1.5 rather than 2mm cortical bone thickness. Greater cortical bone thickness gives better initial stability.
2.0-mm outer diameters showed significantly higher insertion torque than the 3-2.0-mm MSIs with 1.75-mm outer diameters. The IT was significantly greater for the mini-implant placed in thicker and denser cortical bone. Both outer diameter and length affect the stability of mini-implants. Increases in cortical bone thickness and cortical bone density increase the primary stability of the mini-implants.
Cho et al (2012)58 investigated the effects of orthodontic mini-implant shape and predrilling depth on the mechanical properties of mini-implant during the insertion procedure. In the same predrilling depth, no differences were observed in maximum insertion torque between cylindrical and tapered groups. In cases of thick cortical bone, predrilling might be an effective tool for reducing microdamage without compromising mini-implant stability.
Lindsy Holm et al (2012)59 evaluated the effects of mini-implant features (length, design, core diameter), insertion technique (insertion angle, cortical punch), and cortical bone depth and density on mini implant primary stability. Mini-implants achieved greater primary stability in higher-density cortical bone, and the 1.5 mm diameter tapered and 2.0 mm cylindrical designs offered greater primary stability than the 1.5 mm cylindrical design.
resonance frequency of the mini-implants in the artificial bone was detected. Resonance frequency was not influenced by the implant materials titanium alloy or stainless steel. Therefore, the primary stability of a mini-implant is influenced by insertion depth and not by implant material. Insertion depth is extremely important for primary implant stability and is critical for treatment success.
Singh et al (2012)61 analyzed the stress distribution and displacement patterns that develop in a mini implant and its surrounding osseous structures under loading with finite element analysis. Increased stress values were located at the necks of the implants and the surrounding cortical bone.
Te-Chun Liu et al (2012)62 investigated the roles of bone quality, loading conditions, screw effects, and implanted depth on the biomechanics of an orthodontic miniscrew system by using finite element analysis. Both stress and displacement increased with decreasing cortex thickness, whereas cancellous bone density played a minor role in the mechanical response. The screw diameter was the dominant factor for minscrew mechanical responses. Bone stress and screw displacement decreased with increasing screw diameter and cortex thickness, and decreasing exposed length of the screw, force magnitude, and oblique loading direction.
and density between age, gender, sites and sides were found. Adults show a thicker alveolar cortical bone than adolescents. Alveolar cortical bone thickness and density were greater in males than in females, in mandible than in maxilla, in the posterior region than the anterior, in oral than buccal side. There is an increase of thickness and density from crest to base of alveolar crest.
Cho et al (2013)64 determined the effects of insertion angle and thread type on the fracture properties of orthodontic mini-implants during insertion. When mini implants contacts artificial root at a critical contact angle, the deformation or fracture of mini-implants can occur at lower maximum insertion torque values than those of penetration.
Chugh et al (2013)65 quantitatively evaluated the bone density at the interradicular areas of the alveolar and basal bones of maxilla and mandible by computed tomography. The
highest cortical bone density was observed between the second premolar and first molar at
the alveolar bone level and between the first and second molars at the basal bone level in the
maxilla. Maxillary tuberosity showed the least bone density. The density of the cortical bone
was greater in the mandible than in the maxilla and showed a progressive increase from the
incisor to the retromolar area. The basal bone showed a higher density than the alveolar bone.
Different qualities of the bone were found in the anatomic regions studied, which confirms
the importance of knowledge of site-specific bone tissue density to correlate with various
clinical findings.
Lin et al (2013) determined the biomechanical effects of exposure lengths of mini
implants, the insertion angle and the direction of orthodontic force. Increased exposure
lengths resulted in higher bone stresses adjacent to mini implant. The direction of orthodontic
force had no effect on cortical bone stress.
Pithon et al (2013)67 evaluated the influence of the length of the mini-implant on its mechanical properties. The insertion torque increased with increasing screw length and increasing cortical bone thickness. Increasing the length of the screw does not increase its mechanical strength, but can efficiently reinforce the initial stability of mini-implants.
Serra et al (2013)68 compared the fracture surface characteristics commercially pure titanium, Ti-6Al-4V alloy, and nano structured, plastically deformed titanium mini-implants by torque test. Torque test results showed significant increase in the maximum torque resistance of nano titanium mini-implants when compared to commercially pure titanium implants, and no statistical difference between Ti-6Al-4V alloy and nano titanium mini-implants. Since nanostructured titanium mini-implants have mechanical properties comparable to titanium alloy mini-implants, and biocompatibility comparable to commercially pure titanium mini-implants, it was suggestive that nano structured titanium could replace Ti-6Al-4V alloy as the material base for mini-implants.
lowest bone density. Cancellous bone had almost comparable densities between the mandible and the maxilla and its density was less than those of cortical sites. When mini implants are indicated, no gender and side differences affect the success rate regarding bone density; while age and area should be considered when selecting and placing mini implants for orthodontic anchorage.
Tina et al (2013)12 reviewed endeavours to compile the research of bone density in maxilla and mandible. They concluded that Knowledge of low density sites prior to implant placement allows clinician to use longer implant in these areas to improve retention. In areas of high bone density, use of pre-drilling method avoids the breakage of implant. Sufficient irrigation should be done to prevent overheating of bone in that area. Immediate loading of mini-implants is possible because of higher bone density in all the areas of cortical bone.
Alrbata et al (2014)70 determined the appropriate range of cortical bone thickness for supporting an orthodontic mini implant using finite element model. Titanium alloy implant 1.4mm x 7mm was used in cylindrical one models of varying cortical bone thickness and a 2N horizontal force was applied to the mini implant. It was seen that the highest stress occurred near fulcrum where the implant tips and presses into the cortical bone in the direction of the force. Increase in cortical bone thickness resulted in decrease in peak stress but only till a maximum thickness of 2mm.
between stainless steel and titanium alloy miniscrew implants in microdamage burden and bone-to-implant contact regardless of loading status. Stainless steel and titanium alloy miniscrew implants provide the same mechanical stability and similar histologic responses, suggesting that both are suitable for immediate orthodontic clinical loads.
Di Lello et al (2014)72 evaluated the insertion and removal torque for mini implants inserted in different inclinations. Insertion torque was lower than the removal one in both insertion degrees. They concluded that 60˚ angulation does not offer any advantages to the
primary stability for orthodontic mini implants.
Fulya Ozdemir et al (2014)73 quantitatively evaluated the cortical bone densities of the maxillary and mandibular alveolar processes in adults with different vertical facial types using cone-beam computed tomography. They concluded that patients with the hyperdivergent facial type tend to have less-dense buccal cortical bone in the maxillary and mandibular alveolar processes than those patients with other facial types. Women tend to have denser palatal cortical bone in the alveolar process than men. Clinicians should be aware of the variability in the cortical bone density at mini-implant placement sites and take this into consideration to avoid loss of mini-implants due to insufficient initial stability or breakage during placement.
Raghavendra et al (2014)75 in their review article studied safe zones for miniscrews in orthodontics. The safe zone for mini-implant placement in the anterior region is between the central and lateral incisors in the maxilla and between the lateral incisor and the canine in the mandible at the 6-mm level from the CEJ. At the buccal aspect of the posterior region for all skeletal patterns, the safest zone in the interradicular space of the posterior maxilla was the space between the second premolar and the first molar. In the posterior mandible, the safer zones were located between the first and second premolars and between the first and second molars. Palatally, the optimal site is between the first and second premolars as it has the advantage of the highest cortical thickness.
Renata de Faria Santos et al (2014)76 measured insertion torque, tip mechanical resistance to fracture and transmucosal neck of mini-implants, as well as to analyze surface morphology. Mechanical tests were carried out to measure the insertion torque of MIs in different cortical thicknesses, and tip mechanical resistance to fracture as well as transmucosal neck of mini implants. Surface morphology was assessed by scanning electron microscopy before and after the mechanical tests. All mini-implants tested presented adequate surface morphology. The resistance of mini-implants to fracture safely allows placement in 1 and 2-mm cortical thickness. However, in 3-mm cortical thickness and dense bones, pre-drilling with a bur is recommended before insertion.
addition, to minimize fracture risk it is proposed that of the mini implant size should be selected according to the insertion site.
Kang et al (2015)78 investigated the biomechanical properties and bone-implant intersurface response of machined and laser surface-treated stainless steel mini-screw implants. There were no significant differences in fracture resistance and bone-implant contact between the two groups. Laser treatment increased surface roughness without compromising fracture resistance. Despite increasing surface roughness, laser treatment did not improve bone-implant contact. Overall, it appears that medical grade SS has the potential to be substituted for titanium alloy mini-screw implants.
Gautham et al (2016)79 evaluated the stress patterns produced in mini implants and alveolar bone, for various implant dimensions using three dimensional finite element method. The results showed that 1mm diameter mini implants are not safe to be used clinically for orthodontic anchorage. The 1.3 X 6 mm mini implants are recommended for use during anterior segment intrusion and retraction and 1.3 X 8 mm mini implants are recommended for use during molar intrusion.
Rafael Ribeiro Maya et al (2016)80 conducted the ex vivo study to evaluate the effect of vertical placement angle of mini implants on primary stability by analyzing maximum insertion torque. The maximum insertion torque was higher for both mini implant types when they were placed at a 90˚angle (14.40Ncm) compared with those placed at a 60˚
MATERIALS AND METHODS
MATERIALS USED IN THE STUDY:
1. Sixty three Absoanchor Ti-6Al-4V alloy mini implants by Dentos®, Korea 2. Long handle implant driver, Dentos®, Korea
3. Sixty three Solid rigid polyurethane foam(saw bones)with homogenous density 4. Spirit level
5. Customized stand for implant placement
6. Discovery XR656 digital radiographic machine by G.E.® 7. G.E. Media Viewer software for image analysis
METHODOLOGY:
The present study was undertaken at the Department of Orthodontics and Dentofacial Orthopedics, Sri Ramakrishna Dental College and Hospital, Coimbatore
[image:44.595.112.554.402.687.2]
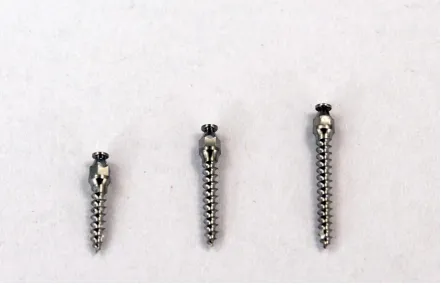
Sixty three Absoanchor self-drilling, mini implants made of Titanium- 6Aluminium-4Vanadium [Ti-6Al-4V] alloy implants from Dentos® Korea, of varying lengths were used for the experiment. Mini implants were conical in shape and the head of the implant was hexagonal with a small hole for passing threads and ligature wires through it. [fig 1]
Mini implants used in this study are categorized as shown in table below:
Titanium mini implants
Length 6mm with diameter 1.3mm
21 nos
Length 8mm with diameter 1.3mm
21 nos
Length 10mm with diameter 1.3mm
21 nos
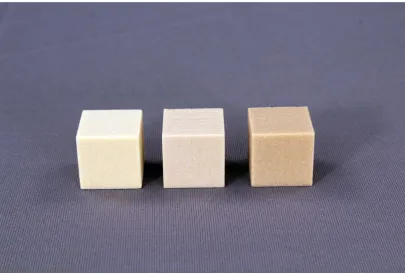
[image:45.595.110.516.477.752.2]Sixty three homogenous Solid rigid polyurethane foam (saw bone) with varying bone density [fig 2] were used in this study to simulate anatomic sites for clinical insertion of mini implants in maxilla and mandible. Following densities were used in the study
Artificial bone blocks used in this study are categorized as shown in table below: Homogenous Solid rigid
polyurethane foam (saw bone) 2" X 2" X 2"
20 pcf 21 nos
30 pcf 21 nos
40 pcf 21 nos
Bone blocks were segregated for implant insertion such that one block had one mini screw. Saw bones have the biological properties similar to those of natural bone. Artificial bone, which is composed of synthetic, homogeneous materials, has been shown to be a good substitute for jaw bone.49
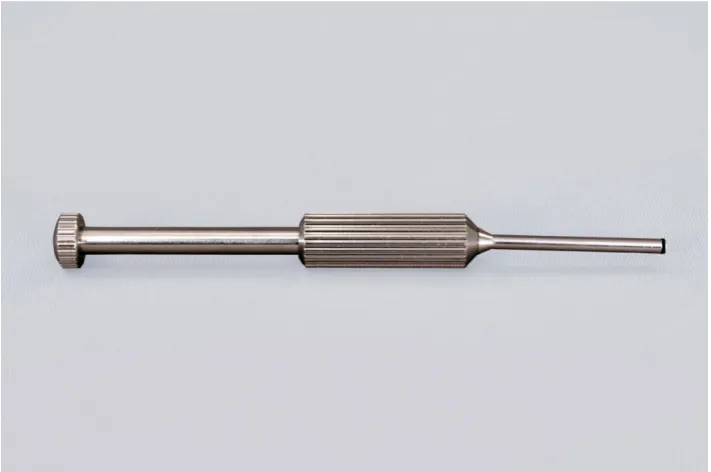
Insertion of mini implants:
FIGURE 3: LONG HANDLE IMPLANT DRIVER
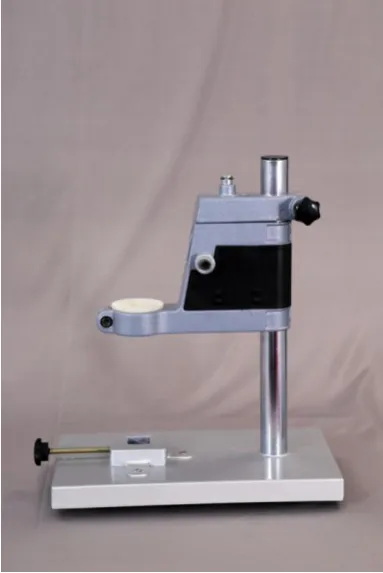
FIGURE 5: CUSTOM MADE STAND - LATERAL VIEW
FIGURE 7: SPIRIT LEVEL TO CHECK THE BONE SURFACE
Radiographic imaging of the bone block:
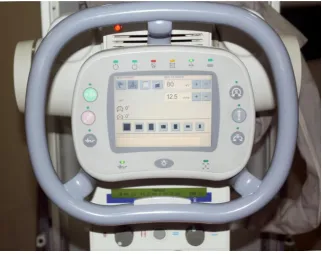
FIGURE 8: G.E DISCOVERY XR656 DIGITAL RADIOGRAPHIC MACHINE
Image analysis for deflection measurement:
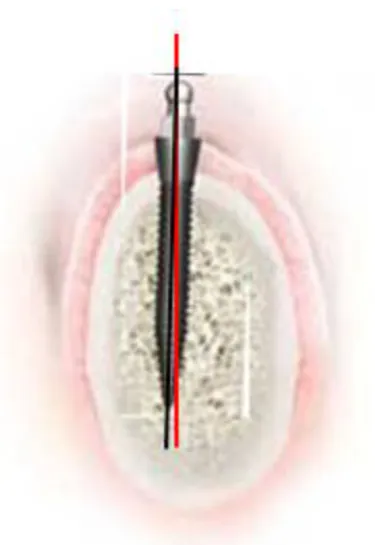
[image:51.595.224.412.360.633.2]The radiographic image obtained was adjusted for optimum contrast and magnification prior to obtaining the mini implant deflection values. A pictorial representation of the image analysis is shown in Figure 10. In the image, the red line represents the true horizontal line passing through the centre of point of insertion of the implant. The black line represents the long axis of the mini implant passing through its apex and tip. The angle between the two lines represents the degree of deflection of the mini implant.
FIGURE 10: PICTORIAL REPRESENTATION
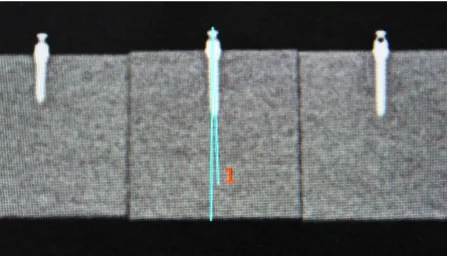
Image analysis was done using the G.E. Media Viewer software as the tool for measuring the implant deflection. The long axis of the mini implant was considered as a line joining the apex and the tip of the implant. A true vertical line passing through the centre of point of insertion of the mini implant was used to obtain the degree of deviation of its long axis upon insertion into the bone [fig 11]. The procedure was thus repeated for all the mini implants.
The study involved the placement of 63 mini implants of 3 different lengths (6mm, 8mm, and 10mm) into three bone densities (20 pcf, 30 pcf, and 40 pcf). Among the 63 mini implants, 60 were placed successfully without mini implant breakage and artificial bone fracture, except for 3 mini implants of dimension 10mm X 1.3mm which fractured at the neck of the implant in the 40pcf block.
STATISTICAL ANALYSIS
The sample size of 63 was decided for the study using power analysis by GPower3.0.5 software. Descriptive statistics, including the mean value and standard deviation of the deflection value for different implant lengths and bone densities were calculated. This is shown in Table1. Initially the dependent variable is tested (Table 2, Graph 1) for Gaussian (normal) distribution and proved to be normality which is the basic assumption of applying parametric tests (ANOVA family). For significant differences, the data were evaluated using a one-way analysis of variance (ANOVA) test, followed by the post hoc test. SPSS 17.0 was used to find estimates and significance. The mean difference is significant at 0.05 level. Response surface methodology (RSM) explores the relationships between several explanatory variables and one or more response variables. RSM use a sequence of designed experiments to obtain an optimal response. Statistical approaches such as RSM can be employed to maximize the production of a special substance by optimization of operational factors. MiniTab 17.0 was used to fit quadratic regression and to draw RSM from which optimality has been identified.
TABLE 1: DESCRIPTIVE STATISTICS OF OBSERVED DEFLECTION
Implant length Bone Density Mean Std. Deviation Number of subjects
6mm
20pcf .8186 .03934 7
30pcf .8000 .04509 7
40pcf .6143 .05442 7
Total .7443 .10438 21
8mm
20pcf .9186 .04220 7
30pcf .8829 .02628 7
40pcf .6671 .03988 7
Total .8229 .11904 21
10mm
20pcf 1.0714 .17468 7
30pcf .9257 .05740 7
40pcf 1.2300 .48111 7
Total 1.0757 .30951 21
Total
20pcf .9362 .14665 21
30pcf .8695 .06830 21
40pcf .8371 .39028 21
TABLE 2: ONE-SAMPLE KOLMOGOROV-SMIRNOV TEST
Deflection
N 60
Normal Parametersa,,b Mean .8385 Std. Deviation .15117 Most Extreme
Differences
Absolute .095
Positive .095
Negative -.091
Kolmogorov-Smirnov Z .735
Asymp. Sig. (2-tailed) .652
a. Test distribution is Normal. b. b. Calculated from data.
c. The KS Test result shows that normality assumption is retained and suggests to apply parametric tests.
GRAPH 1
All mini implants underwent deflection upon insertion with a maximum mean deflection of 1.1 degrees and a minimum of 0.6 degrees. ‘A test of between subjects’ effects was done to assess the influence of length and density and also the combined effects of length and density on deflection. The influence of length and density was found to be statistically significant. The influence of combined effects of length and density was found to be non significant (Table 3).
TABLE 3: TWO-WAY ANOVA TEST ON EFFECTS OF LENGHT and DENSITY on DEFLECTION
Source
Type III Sum of Squares
Df Mean Square F Sig.
Corrected Model 1.063a 8 .133 23.787 .000
Intercept 40.964 1 40.964 7330.696 .000
Length .400 2 .200 35.797 .000
Density .483 2 .242 43.230 .000
Length * Density .048 4 .012 2.168 .086
Error .285 51 .006
Total 43.533 60
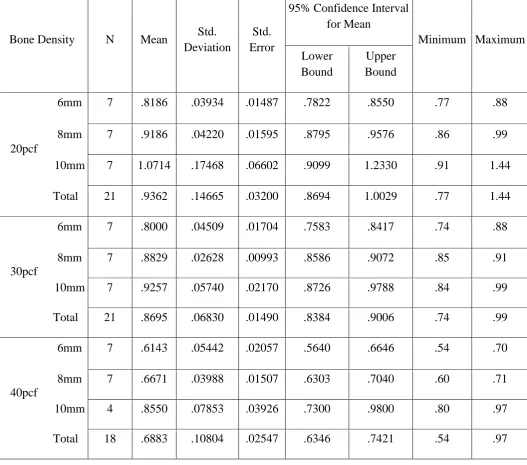
Mean values of deflection of the implants with varying densities were calculated with their respective standard deviation. The values are shown in Table 4. Mean values of deflection of the implants with varying lengths were calculated with their respective standard deviation. The values are shown in Table 5.
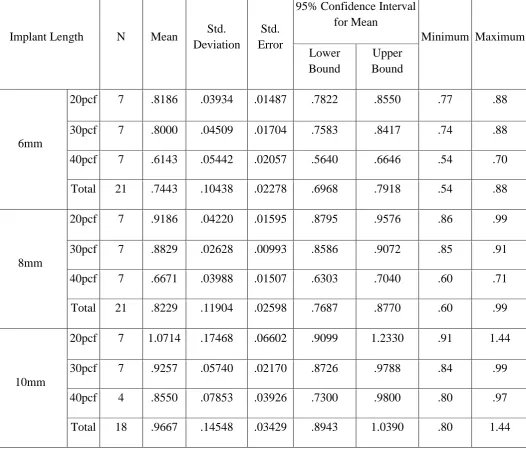
TABLE 4: Descriptive statistics for EFFECT OF DENSITY ON DEFLECTION Implant lengthwise
Implant Length N Mean Std. Deviation
Std. Error
95% Confidence Interval for Mean
Minimum Maximum Lower
Bound
Upper Bound
6mm
20pcf 7 .8186 .03934 .01487 .7822 .8550 .77 .88
30pcf 7 .8000 .04509 .01704 .7583 .8417 .74 .88
40pcf 7 .6143 .05442 .02057 .5640 .6646 .54 .70
Total 21 .7443 .10438 .02278 .6968 .7918 .54 .88
8mm
20pcf 7 .9186 .04220 .01595 .8795 .9576 .86 .99
30pcf 7 .8829 .02628 .00993 .8586 .9072 .85 .91
40pcf 7 .6671 .03988 .01507 .6303 .7040 .60 .71
Total 21 .8229 .11904 .02598 .7687 .8770 .60 .99
10mm
20pcf 7 1.0714 .17468 .06602 .9099 1.2330 .91 1.44
30pcf 7 .9257 .05740 .02170 .8726 .9788 .84 .99
40pcf 4 .8550 .07853 .03926 .7300 .9800 .80 .97
[image:58.595.43.570.255.707.2]TABLE 5: Descriptive statistics for EFFECT OF LENGHT ON DEFLECTION bone density wise
Bone Density N Mean Std. Deviation
Std. Error
95% Confidence Interval for Mean
Minimum Maximum Lower
Bound
Upper Bound
20pcf
6mm 7 .8186 .03934 .01487 .7822 .8550 .77 .88
8mm 7 .9186 .04220 .01595 .8795 .9576 .86 .99
10mm 7 1.0714 .17468 .06602 .9099 1.2330 .91 1.44
Total 21 .9362 .14665 .03200 .8694 1.0029 .77 1.44
30pcf
6mm 7 .8000 .04509 .01704 .7583 .8417 .74 .88
8mm 7 .8829 .02628 .00993 .8586 .9072 .85 .91
10mm 7 .9257 .05740 .02170 .8726 .9788 .84 .99
Total 21 .8695 .06830 .01490 .8384 .9006 .74 .99
40pcf
6mm 7 .6143 .05442 .02057 .5640 .6646 .54 .70
8mm 7 .6671 .03988 .01507 .6303 .7040 .60 .71
10mm 4 .8550 .07853 .03926 .7300 .9800 .80 .97
PARAMETERS ASSESSED
1) Deflection of mini implant with varying bone density
a) Deflection of mini implant of dimension 6mmX 1.3mm in 20pcf, 30pcf, 40pcf.
b) Deflection of mini implant of dimension 8mmX 1.3mm in 20pcf, 30pcf, 40pcf.
c) Deflection of mini implant of dimension 10mmX 1.3mm in 20pcf, 30pcf, 40pcf.
2) Deflection of mini implant with varying lengths
a) Deflection of mini implant of lengths 6mm, 8mm, 10mm in 20pcf. b) Deflection of mini implant of lengths 6mm, 8mm, 10mm in 30pcf. c) Deflection of mini implant of lengths 6mm, 8mm, 10mm in 40pcf.
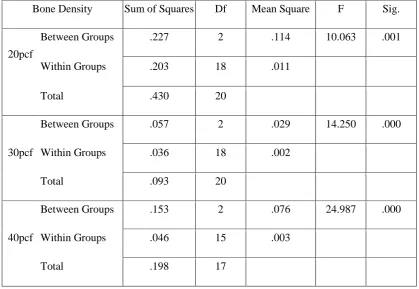
DEFLECTION OF MINI IMPLANT WITH VARYING BONE DENSITY
There is a constant decrease in deflection with increase in density. 20pcf showed maximum deflection followed by 30pcf and the least was seen in 40 pcf . Similar results were obtained for implants of all dimensions. The P values have been showed in Table 8.
TABLE 6:ANOVA TEST FOR VARYING BONE DENSITIES
Bone Density Sum of Squares Df Mean Square F Sig.
20pcf
Between Groups .227 2 .114 10.063 .001 Within Groups .203 18 .011
Total .430 20
30pcf
Between Groups .057 2 .029 14.250 .000 Within Groups .036 18 .002
Total .093 20
40pcf
Between Groups .153 2 .076 24.987 .000 Within Groups .046 15 .003
[image:61.595.88.508.114.403.2]Total .198 17
TABLE 7: ANOVA TEST FOR VARYING IMPLANT LENGTHS
Implant Length Sum of Squares Df Mean Square F Sig.
6mm
Between Groups .179 2 .089 40.959 .000 Within Groups .039 18 .002
Total .218 20
8mm
Between Groups .259 2 .130 95.666 .000 Within Groups .024 18 .001
Total .283 20
10mm
Between Groups .138 2 .069 4.691 .026 Within Groups .221 15 .015
TABLE 8: POST HOC TESTS Implant Length (I) Bone Density (J) Bone Density Mean
Difference (I-J) Std. Error Sig.
95% Confidence Interval
Lower Bound Upper Bound
6mm
20pcf 30pcf .01857 .02496 1.000 -.0473 .0845
40pcf .20429* .02496 .000 .1384 .2702
30pcf 20pcf -.01857 .02496 1.000 -.0845 .0473
40pcf .18571* .02496 .000 .1198 .2516
40pcf 20pcf -.20429* .02496 .000 -.2702 -.1384
30pcf -.18571* .02496 .000 -.2516 -.1198
8mm
20pcf
30pcf .03571 .01967 .258 -.0162 .0876
40pcf .25143* .01967 .000 .1995 .3033
30pcf
20pcf -.03571 .01967 .258 -.0876 .0162
40pcf .21571* .01967 .000 .1638 .2676
40pcf
20pcf -.25143* .01967 .000 -.3033 -.1995
30pcf -.21571* .01967 .000 -.2676 -.1638
10mm
20pcf
30pcf .14571 .06493 .121 -.0292 .3206
40pcf .21643* .07614 .037 .0113 .4215
30pcf
20pcf -.14571 .06493 .121 -.3206 .0292
40pcf .07071 .07614 1.000 -.1344 .2758
40pcf
20pcf -.21643* .07614 .037 -.4215 -.0113
a) Deflection of mini implant of dimension 6mm X 1.3mm in 20pcf, 30pcf, 40pcf.
Statistically significant difference was seen between 20pcf and 40pcf , 30pcf and 40pcf. The mean deflection is represented in Graph 2.
GRAPH 2: DEFLECTION OF MINI IMPLANT OF LENGTH 6mm
b) Deflection of mini implant of dimension 8mmX 1.3mm in 20pcf, 30pcf, 40pcf.
Statistically significant difference was seen between 20pcf and 40pcf , 30pcf and 40pcf. The mean deflection is represented in Graph 3
c) Deflection of mini implant of dimension 10mmX 1.3mm in 20pcf, 30pcf, 40pcf.
Statistically significant difference was seen between 20pcf and 40pcf. The mean deflection is represented in Graph 4.
GRAPH 4: DEFLECTION OF MINI IMPLANT OF LENGTH 10mm
DEFLECTION OF MINI IMPLANT WITH VARYING LENGTHS
TABLE 9: POST HOC TESTS Bone Density (I) Implant Length (J) Implant Length Mean
Difference (I-J) Std. Error Sig.
95% Confidence Interval
Lower Bound Upper Bound
20pcf
6mm
8mm -.10000 .05677 .285 -.2498 .0498
10mm -.25286* .05677 .001 -.4027 -.1030
8mm
6mm .10000 .05677 .285 -.0498 .2498
10mm -.15286* .05677 .045 -.3027 -.0030
10mm
6mm .25286* .05677 .001 .1030 .4027
8mm .15286* .05677 .045 .0030 .3027
30pcf
6mm
8mm -.08286* .02394 .008 -.1460 -.0197
10mm -.12571* .02394 .000 -.1889 -.0625
8mm
6mm .08286* .02394 .008 .0197 .1460
10mm -.04286 .02394 .271 -.1060 .0203
10mm
6mm .12571* .02394 .000 .0625 .1889
8mm .04286 .02394 .271 -.0203 .1060
40pcf
6mm
8mm -.05286 .02954 .281 -.1324 .0267
10mm -.24071* .03464 .000 -.3340 -.1474
8mm
6mm .05286 .02954 .281 -.0267 .1324
10mm -.18786* .03464 .000 -.2812 -.0945
10mm
6mm .24071* .03464 .000 .1474 .3340
a) DEFLECTION OF MINI IMPLANT OF LENGTHS 6mm, 8mm, 10mm in 20pcf.
Statistically significant difference was seen between 10mm and 6mm , 10mm and 8mm. The mean deflection is represented in Graph 5.
GRAPH 5: DEFLECTION OF MINI IMPLANT ON 20pcf BONE DENSITY
b) DEFLECTION OF MINI IMPLANT OF LENGTHS 6mm, 8mm, 10mm in 30pcf
Statistically significant difference was seen between 10mm and 6mm , 8mm and 6mm. The mean deflection is represented in Graph 6.
c) DEFLECTION OF MINI IMPLANT OF LENGTHS 6mm, 8mm, 10mm in 40pcf
Statistically significant difference was seen between 10mm and 6mm , 10mm and 8mm. The mean deflection is represented in Graph 7.
GRAPH 7: DEFLECTION OF MINI IMPLANT ON 40pcf BONE DENSITY
OVERALL DEFLECTION OF MINI IMPLANT ON VARYING DENSITY
The mean deflection of a mini implant that can occur in each bone density irrespective of length of the mini implant are as follows:
Minimum deflection of 0.8˚ and maximum of 1.0˚ was seen in 20pcf
Minimum deflection of 0.7˚ and maximum of 0.9˚ was seen in 30pcf
Minimum deflection of 0.6˚ and maximum of 0.8˚ was seen in 40pcf
TABLE 10: ESTIMATED MARGINAL MEANS OF DEFLECTION ON DENSITY
Bone
Density Mean Std. Error
95% Confidence Interval
Lower Bound Upper Bound
20pcf .936 .038 .860 1.013
30pcf .870 .038 .793 .946
40pcf .712 .038 .676 .814
OVERALL DEFLECTION OF MINI IMPLANTS ON VARYING LENGTH
The mean deflection of mini implants of varying lengths irrespective of the bone density it is inserted are as follows:
6mm mini implant deflected to a maximum of 0.8˚ and minimum of 0.6˚
8mm mini implant deflected to a maximum of 0.9˚ and minimum of 0.7˚
10mm mini implant deflected to a maximum of 1.0˚ and minimum of 0.9˚
[image:68.595.128.471.116.274.2]The mean values have been showed in Table 11.
TABLE 11: ESTIMATED MARGINAL MEANS OF DEFLECTION ON LENGTH
Implant
length Mean Std. Error
95% Confidence Interval
Lower Bound Upper Bound
6mm .744 .038 .668 .821
8mm .823 .038 .746 .899
10mm 1.076 .038 .999 1.152
Correlating the lengths and densities maximum and minimum deflection was determined using Response Surface Method analysis. This is shown in Graph 8.
GRAPH 8:
Response Surface Method analysis provided the following quadratic equation to find optimum solution.
The following graphs are generated for the optimization:
Deflection = 0.593 - 0.0208 Length + 0.0214 Density + 0.00522 Length*Length - 0.000491 Density*Density - 0.000434 Length*Density
Length D en si ty 1 0 9 8 7 6 40 35 30 25 20 > – – – < 0.7 0.7 0.8 0.8 0.9 0.9 1 .0 1 .0 Deflection
Contour Plot of Deflection vs Density, Length
0 . 6
7 5. 9.0 0 6 . 0 5 7 . 0 0 9 . 0 30 0 2 10.5 30 0 4 5 . 1 0 n o i t c e l f e D y t i s n e D h t g n e L urface Plo
Correlating the lengths and densities the maximum deflection was seen in 10mm mini implant in 20pcf was about 1.05˚. This is represented in Graph 9.
GRAPH 9: MAXIMIZATION OF DEFLECTION
Correlating the lengths and densities the minimum deflection was seen in 6mm mini implant in 40pcf was about 0.6˚. This is represented in Graph 10.
Temporary anchorage devices have added a whole new dimension to orthodontic treatment, allowing tooth movements to be carried out which were previously thought difficult or impossible82. Mini implants have influenced orthodontic treatment plans by providing possible management of complicated discrepancies than those treatable by conventional biomechanics. By the help of mini implants, force can be applied directly to the bone-borne unit. Therefore, mini implants not only eliminated concerns about anchorage – demanding cases, but they also have enabled clinicians to overcome tooth movement in 3 dimensions. Furthermore, adjunctive orthodontic treatments in adults, and treatment for impacted teeth are the other indications of mini implant treatment83.
Most commonly mini screws are made of stainless steel and commercially pure titanium and its alloys. Titanium screws have the advantage over the stainless steel as they have high bioactivity and more flexibility that improve integration and mechanical fixation. The titanium alloy [Ti-6Al-4V] is used instead of pure titanium because of its superior strength, which allows it to overcome problems such as fractures or distorsions84. Roberts et al in their study have shown titanium implants developed osseous contact, and continuously loaded implants remained stable. The results indicated that titanium implants provided firm osseous anchorage for orthodontics. Hence Grade 5 titanium (Ti-6Al-4V) implant material was chosen for the present study.
Mini implants are available in different lengths (5 - 12mm) and diameters (1.2 – 2mm) to accommodate placement at different sites in both jaws. Studies have shown in the mandible where the bone is generally denser, a 6 – 8mm length is optimal while in maxilla 8 – 10mm length is preferred. Deguchi et al31
placed safely when less than 3.5mm of interradicular space is available. Thinner implants lead to risks of fracture while thicker implants makes root contact more probable85. Hence in this study commonly used dimensions of implants have been used for evaluation and comparison of deflection.
As widely known, osseointegration is not assumed for mini-implants as only the mechanical contact between bone and implant interface is necessary to provide stability. This is the reason of immediate loading ability of mini-implants, since no healing period is awaited. However, osseointegration in mini-implants was found to be present in many studies
and these investigators recommend a waiting period prior to force application.86 Complete osseointegration of mini-implants used in orthodontic therapy is not wanted due to
the complications during removal, most of them are manufactured with a smooth surface which impairs the development of bone formation. Despite the amount of osseointegration that may occur it is thought that removal is not difficult since coherence is relatively low as active remodelling and less mineralized bone formation takes place in the bone around the loaded screw part.87