CHILDREN, EDUCATION AND SKILLS
research
social
Consequences, risk factors and
geography of young people
Consequences, risk factors, and geography of young
people not in education, employment or training
(NEET
)
Contents
Acknowledgements ... 3
Executive summary ... 4
Objectives ... 4
Who are NEET? ... 4
Who was studied? ... 4
Key findings - Consequences ... 4
Key findings – Risk factors ... 6
Chapter 1 Introduction ... 7
Policy background ... 7
What we know about the NEET group? ... 7
Study aims and objectives ... 11
Chapter 2 Methods ... 12
Data sources ... 12
NEET definition ... 12
Sample specifications ... 13
Statistical Methods ... 14
Chapter 3 Results ... 18
Consequences of NEET status... 18
Risk factors of becoming NEET ... 35
Geographies of NEET ... 46
Chapter 4 Conclusions ... 51
Key Research findings ... 51
Policy implications ... 53
Future research ... 53
1 List of Tables
Table 1 Gender and age profiles of the 16-19 cohorts in 1991 and 2001
Table 2 Economic activity for Cohorts 1 and 2
Table 3 Qualification level in 2011 by NEET status 2001 and 1991
Table 4 Qualification level in 2011 by extended categories of NEET, 2001 and 1991
Table 5 Economic activity in 2011 by 2001 and 1991 NEET status
Table 6 Economic activity in 2011 by 2001 and 1991 extended categories of NEET
Table 7 Economic activity in 2001 and 2011 by 1991 NEET status
Table 8 Odds ratios of economic inactivity in 2011 from logistic regression
Table 9 2011 National Statistics-Socio-Economic Classification categories by 2001 and 1991 NEET status
Table 10 Odds ratios of low status occupations in 2011 from logistic regression
Table 11 Limiting long-term illness in 2011 by 2001 and 1991 NEET status
Table 12 Limiting long-term illness in 2011 by extended categories of NEET in 2001 and 1991
Table 13 Odds ratios of having limiting long-term illness in 2011 from logistic regression
Table 14 Admitted to hospital following an accident & emergency (A&E) visit between 2001 and 2010 by 2001 and 1991 NEET status
Table 15 Odds ratios of hospital admission following a visit to accident and emergency between 2001 and 2010 from logistic regression
Table 16 Odds ratios of hospital admission following a visit to accident and emergency due to self-harm between 2001 and 2010 from logistic regression
Table 17 Prescription of antidepressant and antianxiety drugs between 2009 and 2011 by 2001 and 1991 NEET status
Table 18 Odds ratios of being prescribed with antidepressant or antianxiety drugs between 2009 and 2012 from logistic regression
Table 19 Drug misuse between 2006 and 2012 by NEET status in 2001 and 1991
Table 20 Odds ratios of drug misuse between 2006 and 2012 from logistic regression
Table 21 NEET status 2001 by gender and age for Cohort 3
Table 22 Odds ratios of being NEET in 2001 from logistic regression for males
Table 23 Odds ratios of being NEET in 2001 from logistic regression for females
Table 24 Proportion NEET for school census analysis by gender and age for Cohort 4
2
Table 26 Odds ratios of being NEET in 2011 from logistic regression for females
Table 27 Distribution of NEET and non-NEET by risk score group
List of Figures
Figure 1 Proportion NEET by local authority, 1991, 2001 and 2011 Census
Figure 2 Proportion NEET by gender and Carstairs deprivation quintile
3
Acknowledgements
The authors gratefully acknowledge the support of the Scottish Longitudinal Study team at the Longitudinal Studies Centre Scotland (LSCS), the electronic Data Research and Innovation Service (eDRIS) and the National Records of Scotland. The LSCS is supported by the ESRC/JISC, the Scottish Funding Council, the Chief Scientist Office and the Scottish Government.
4
Executive summary
Objectives
This report presents findings from a study which investigated the consequences, risk factors and geographies of young people not in education, employment or training (NEET) over the past two decades. The study used the Scottish
Longitudinal Study (SLS) which links anonymised individual records from the 1991, 2001 and 2011 censuses and a wide range of data from different sources to allow an effective assessment of risk factors and consequences. Scotland’s censuses were also used to examine the geographies of NEETs.
This research will be used to inform policies aimed at assisting the Scottish
Government to achieve its objectives around supporting young people into post-16 education, training and employment. The research provides new longitudinal
evidence which may help to understand past and current policy impacts (such as ‘More Choices, More Chances’ and ‘Opportunities for All’) as well as informing future policy development.
Who are NEET?
NEET individuals were defined by the economic activity variables asked in the national census. A NEET individual is thus defined as one who, at the time of the census, is aged between 16 and 19, either unemployed, seeking work and ready to start within 2 weeks, or economically inactive due to looking after home/family, permanently sick/disabled, or other reasons.
Who was studied?
In order to understand the long-term consequences of being a NEET, two cohorts (groups of people within a certain age range followed up over a period of time) were followed over 10 and 20 years:
Cohort 1: SLS members who were aged 16-19 in 2001 and followed up to 2011 when they were aged 26-29;
Cohort 2: SLS members who were aged 16-19 in 1991 and followed up to 2011 when they were aged 36-39.
In order to help understand what factors might lead to a young person being NEET, two further cohorts were examined, one born in the 1980s and the other in the 1990s:
Cohort 3: SLS members aged 6-9 in 1991 followed up to 2001 when they were aged 16-19;
Cohort 4: SLS members aged 6-9 in 2001 followed up to 2011 when they were aged 16-19.
Key findings - Consequences
5
• The NEET group remains disadvantaged in their educational attainment 10 and 20 years later. More than one in five of NEET young people in 2001 had no qualifications by 2011 compared with only one in twenty five of
non-NEETs.
• There is a scarring effect in economic activity. In comparison with their non-NEET peers non-NEET young people in 2001 were 2.8 times as likely to be unemployed or economically inactive 10 years later.
• The scarring effect is also evident in the occupational positions that NEET young people entered. For example, NEET young people in 2001 were 2.5 times as likely as their non-NEET peers to work in a low status occupation in 2011.
• NEET experiences are associated with a higher risk of poor physical health after 10 and 20 years. The risk for the NEET group was 1.6 – 2.5 times that for the non-NEET group varying with different health outcomes.
• NEET experiences are associated with a higher risk of poor mental health after 10 and 20 years. The risk of depression and anxiety prescription for the NEET group is over 50% higher than that for the non-NEET group.
• Young people who were NEET in 1991 and remained economically inactive in 2001 consistently demonstrated significantly poorer outcomes by 2011 than those who were non-NEET in 1991 and economically active in 2001 and those who were engaged with employment or education in either 1991 or 2001. This suggests that there is a cumulative effect of being out of
employment or education on later life chances and this group is the most disadvantaged that need continuing support.
• Young people who changed from NEET status in 1991 to employment or education in 2001 have lower risks of poor life outcomes compared with those who were consistently in disadvantaged positions. However, the negative effect of NEET status in 1991 was not fully discounted by the later engagement of employment or education, indicating the long-lasting
detrimental effect of NEET experiences.
• Young people who changed from being non-NEET in 1991 to being
6 Key findings – Risk factors
There is strong evidence that being NEET is associated with several demographic and socioeconomic factors. These risk factors seemed to be similar for young people growing-up in the 1990’s compared to the 2000’s.
Key findings
• Risk factors are consistent across two cohorts and between males and females.
• Educational qualification is the most important factor. No qualifications increased the risk of being NEET by 6 times for males and 8 times for
females in Cohort 3. No qualifications at SCQF level 5 or higher obtained by school stage S4 increase the risk of being NEET by 10 times for males and 7 times for females in Cohort 4.
• Other school factors are important including the proportion of time absent from school and the number of exclusions.
• Two factors are especially important for females: being an unpaid carer for more than 20 hours per week and teenage pregnancy.
• Household factors are also important. Living in a social renting household, living in a family that is not headed by a married couple, living in a household with no employed adults, having a large number of siblings all increased the risk of becoming NEET.
• Local NEET rate is an important factor for both cohorts and genders, with the risk of NEET increasing with local NEET rate.
• A risk score derived from the statistical modelling has potential to identify young people who are at risk of becoming NEET.
Key findings – Geographies
Finally, there is geographical patterning to the proportion of NEETs across
7
Chapter 1 Introduction
This report investigates the consequences, risk factors and geographies of young people not in education, employment or training (NEET) over the past two decades. The research used the Scottish Longitudinal Study (SLS) which links a sample of individual records from the 1991, 2001 and 2011 censuses and a wide range of data from different sources to allow an effective assessment of risk factors and outcomes. Scotland’s censuses were also used to examine the geographies of NEETs.
Policy background
This research will be used to inform policies aimed at assisting the Scottish Government achieve its objectives around supporting young people into post-16 education, training and employment. The research provides a longitudinal evidence base which will help policy makers understand past and current policy impacts (such as ‘More Choices, More Chances’ and ‘Opportunities for All’) as well as informing future policy development.
The proportion of 16-19 year olds who are NEET is a key measure which feeds into the Scottish Government’s 'Opportunities for All' policy, which is the Scottish
Government’s commitment to an offer of a place in learning or training for every 16-19 year old (up to their 20th birthday), with a specific focus on young people not in education, employment or training. It brings together a range of existing national and local policies and strategies, including More Choices More Chances and 16+ Learning Choices, as a single focus to improve young people’s participation in post-16 learning or training.
What we know about the NEET group? The size of NEETs in Scotland
The emergence of the NEET group as a focus of social concern can be traced to the publication of the Social Exclusion Unit’s (SEU) report “Bridging the Gap” (SEU, 1999).
In Scotland, as in the rest of the UK, the Annual Population Survey (APS, formerly the Labour Force Survey) has been used to monitor the size of the NEET group at the national level. Based on the APS, the size of NEETs was consistently around 30,000 in Scotland between 1996 and 2013, accounting for 11%-15% of young people aged 16-19 (Scottish Executive 2006; Scottish Government 2015). The latest statistics, however, show that the number of NEETs in 2014 has dropped to around 21,000 young people, accounting for only 8% of young people (Scottish Government, 2015). A proportion of the NEET group choose to be NEET such as those on a gap year, and this subgroup is less likely to experience negative
8 Factors associated with NEET status
To prevent individuals becoming, or remaining, part of the NEET group, it is essential to understand why young people become NEET. Low educational attainment at age 16 is the most powerful predictor of being NEET (Payne, 1998; Croxford and Raffe, 2003). Disaffection with school is also an important predictor. Studies using the Scottish School Leavers Survey (SSLS) and Youth Cohort Study (YCS) reported that those who have been regular truants or expelled by school were more likely to be NEET (Furlong, 2006; Croxford and Raffe, 2003; Coles et al, 2002).
Additionally, low socioeconomic status of parents (Bynner and Parsons, 2002), living in a household where neither parents worked full-time (Robson, 2008), teenage pregnancy (Yates et al, 2010), having a health problem or disability (Robson, 2008), being a carer (Scottish Government, 2006; Audit Commission, 2010), having a record of substance abuse (Audit Commission, 2010), being an offender (Audit Commission, 2010) have all been mentioned as factors leading to NEET status. Bynner and Parsons (2002) also found that low birth weight is a significant predictor of NEET status at age 16-18.
Young people from Caribbean, Pakistani and Bangladeshi minority ethnic groups were found to be over-represented in the NEET group in England (Coles et al 2010). Not all ethnic minorities show a higher risk of becoming NEET. ‘Other Asian’ and Indian are two ethnic groups who outperform other ethnic groups in terms of engagement with education or employment (DfE, 2011).
However there is not a consensus, in the literature, on what factors may increase a younger person’s risk of becoming NEET. For example, some studies have found no relationship between family disadvantage and poverty and the risk of being a NEET (Croxford and Raffe, 2003).
The proportion of young people who are NEET differs from one region of the country to another and the composition of the NEET group also varies between localities (Sachdev et al., 2006). In Scotland, the government has identified local authority NEET ‘hotspots’ that were defined as such because they have a high NEET rate and scored highly on geographical measures which are known to relate to a high NEET rate (Scottish Executive 2006).
Area deprivation is identified as a potential risk factor in Bynner and Parsons (2002) where they found that the young who lived in inner cities were at high risk of being NEET. In contrast, Croxford and Raffe (2000) did not find that living in a deprived area or in an area of high unemployment is related to higher risks of becoming NEET.
9
showed that the rate of NEETs was higher for males and increased with age. The NEET group was described by gender, age, economic status, long-term illness, and distribution among local authorities.
The effects of being NEET
So far most research cited has examined the effects of youth unemployment while a small number of works have looked at the effects of being NEET. The majority of studies focus on labour market prospects while a small number look at the effects on health and well-being, social life, and the public spending.
Some research on the effects of being NEET or unemployed has demonstrated that there is a scarring effect on labour market prospects. Bynner and Parson (2002) found that NEET experiences between ages 16 and 18 were associated with
disengagement from employment and education at age 21, the most consistent and significant finding from their research using the 1970 British Cohort Study (BCS). The impact of NEET experiences however varied with gender. Those that had been NEET for a spell of six months between ages 16 and 18 were over four and seven times as likely to become NEET at age 21 for men and women respectively (Bynner and Parson, 2002). Youth unemployment is found to be associated with between a 8% and 15% lower income in mid-career for previously NEET individuals (Gregg and Tominey, 2005).
Furlong et al (2003) used the West of Scotland Twenty-07 study to investigate transitions from school to work for the young. The sample of 15 year olds in 1987 in the Glasgow area was followed-up at ages 16, 18, 21, and 23. Non-linear
transitions were defined as sequences that did not involve straightforward routes through education or training to employment. They showed that, for young people, non-linear transitions were associated with a significant reduction in the chances of stable employment by age 23.
Although many studies support the negative impact of NEET on employment prospects at a later stage, not all research supports this conclusion. Gardecki and Neumark (1997) used the Longitudinal Survey of Youth in the US examining the consequences of ‘churning’ or ‘floundering about’ in the labour market for the young age group to assess whether faster transitions to stable labour market relationships would lead to improved adult labour market outcomes. They concluded that
outcomes at the ages of late twenties and early thirties were largely unrelated to early labour market experiences for both males and females.
A few studies have examined the impact of being NEET on health. Bynner and Parson (2002) investigated the impact of NEET status on general health and
10
Research by the Prince’s Trust (2012) found that the emotional health of young people can suffer if they are unemployed, compared to those who are in work or education. For example, their survey results revealed that individuals who are NEET are more likely to report feeling “always” or “often” stressed, down and depressed and less likely to “always” or “often” feel loved and hopeful. In addition, they are less happy with all areas of their lives and less confident about their future.
Bell and Blanchflower (2010) examined four well-being outcomes: life satisfaction, health status, depression and job satisfaction using the 1958 National Child
Development Study (NCDS). They found that spells of unemployment while young were strong predictors of lower happiness, poorer self-reported general health, higher level of depression, and a lower level of job satisfaction, more than two decades later.
Being outside education, employment or training is also associated with early motherhood for women. It has been shown that the group of women who were mothers in their teens were over-represented among the NEET population at age 16-19. At age 21 nearly 40 per cent of women who had been NEET at age 16-18 had two or more children compared with less than five per cent of those in
education, employment or training at that age (Coles et al 2002).
Being NEET may have impacts on the next generation. Educational qualifications, social status or earnings of a generation have long lasting influences on the next generation. Analysis of the NCDS showed that during the 1980s, young men (aged between 23 and 33) were twice as likely to be unemployed for at least one year if their father had been unemployed at age 16 (SEU, 1999).
NEET experiences may be costly for NEET individuals because of their exclusion from employment, low earnings and poor health in later life. Furthermore, it is also costly for the whole society. Research undertaken by York University (Coles et al, 2010) found that a young person who was NEET in 2008 would incur an average of £56,000 in public finance costs before retirement age. This reflects the public
finance costs of welfare payments, health and justice-related costs and lower tax and national insurance revenue. On the basis of this estimate, the Scottish
Government (2012) estimated the lifetime cost of a single cohort of young people failing to make the transition into regular employment to be in the region of £2 billion.
Although there have been studies on the NEET group, few studies so far have incorporated individual, family and geographical factors in a single analytical framework. Indeed, the majority of studies are descriptive and qualitative.
11
to explore the NEET phenomenon, to provide evidence for policy making and also to evaluate the effectiveness of policy interventions.
Relatively little research has taken the quantitative route and used longitudinal data. Studies using the 1958 NCDS and the 1970 BCS were prominent in
examining life course factors and the subsequent impact of NEET experiences. However, the experience of young people in the past decade is likely to be significantly different from that of the 1958 and 1970 birth cohorts because economic, social and policy circumstances have changed considerably. Studies using BCS 70 and SSLS only follow young people up to their early 20s and thus are only able to demonstrate the effect of NEET status in the short term rather than the longer term. In previous studies on the health effects of NEET experiences, self-reported indicators were often used instead of objective measures.
Study aims and objectives
This study aims to comprehensively examine the consequences, risk factors and geographies of being NEET for the young generation in the past two decades in Scotland. Our objectives are to address three key questions:
1. To what extent does NEET status affect outcomes in later life?
2. What individual, family, educational and geographical factors are related to risks of becoming NEET?
3. Are there geographic patterns of NEETs? And, have these patterns changed over time?
12
Chapter 2 Methods
Data sources Scotland's Census
Scotland's Census is carried out every ten years and is designed to cover every resident in the country. A large number of demographic, social and economic questions are included in the census form. A count of NEET young people can be obtained via the derived variable ‘economic activity’. The publication of census data at the local area level also permits investigation of NEET prevalence by area deprivation and urban rural categories.
The Scottish Longitudinal Study
The Scottish Longitudinal Study (SLS) is an anonymous dataset. It links information from the 1991, 2001, and 2011 censuses. Anyone whose birthdate falls on one of the 20 birthdates chosen by SLS is included in the sample. The sample members are updated through birth and migration. The SLS covers just over a 5% sample of the Scottish population, and includes about 14,000 members aged 16-19 years old.
One unique feature of SLS is that it links to a wide range of administrative data such as vital events (e.g. birth, death), hospital discharges, and prescribing data. Hospital discharge data include information on inpatients and day cases from NHS hospitals, as well as people admitted to specialist mental health facilities. The prescribing data include information on prescription of antidepressants or
antianxiety medications. In addition, the SLS includes school census data which include information on free school meals, exclusions, absences and educational attainment.
NEET definition
The census requires respondents aged 16 and over to answer questions on
economic activity in the week before the census. The responses to these questions are used to derive the variable ‘economic activity’ which we have used to identify NEET individuals. This provides a snapshot definition of NEETs. A NEET individual is thus defined as one who, at the time of the census, is aged between 16 and 19, either unemployed, seeking work and ready to start within 2 weeks, or economically inactive due to looking after home/family, permanently sick/disabled, or other
reasons.
13 Sample specifications
Question 1: To what extent does NEET status affect outcomes in later life?
There are two samples available to answer this question:
Cohort 1: SLS members who were aged 16-19 in 2001 and followed up to 2011 when they were 26-29;
Cohort 2: SLS members who were aged 16-19 in 1991 and followed up to 2011 when they were 36-39.
Cohort 1 was used to explore whether being NEET in 2001 was related to higher risks of negative labour market outcomes and poor health in the 10 years period up to 2011 (age 26-29).
Cohort 2 was used to examine the same outcomes in the 20 year follow-up period from 1991 to 2011. Both cohorts were linked to hospital records and prescribing data.
There were 13,218 SLS members who were aged 16-19 in 2001. Between the 2001 census day and the 2011 census day 1,181 people moved out of Scotland and 74 people died. The 1991 16-19 cohort included 14,567 SLS members. 1,234 people left Scotland and 213 died between 1991 and 2001 censuses. About 1,285 people who were present in 2001 were not present at the 2011 census due to unknown reasons. Similarly 1,397 SLS members in 1991 were not present in 2011 for unknown reasons. There are also missing values for some census variables thus the analytical sample is smaller than the full sample.
In reporting the consequences of NEET status we first present and discuss results from Cohort 1 and then results from Cohort 2.
Question 2: What individual, family, educational and geographical factors are related to the risk of becoming NEET?
There are two samples available to answer this question:
Cohort 3: SLS members aged 6-9 in 1991 followed up to 2001 when they were 16-19;
Cohort 4: SLS members aged 6-9 in 2001 followed up to 2011 when they were 16-19.
In total there were 10,206 SLS members in 1991 who were aged 6-9 and present in the 2001 census (Cohort 3). Of these 10,195 lived in residential properties and 11 in communal establishments. These 11 have been excluded as they may be dissimilar to the rest of the cohort and they have no data for some variables being investigated such as tenure.
14
attendance and exclusion records. More details on the school census data are given in Appendix 3. Of this cohort, 10,445 (90%) cases had 2001 census data, 9,732 (84%) cases had school census data and 8,815 (76%) cases had both
sources of data. A small number had neither 2001 census nor school census data. The small number resident in communal establishments were again excluded.
Question 3: Are there geographical patterns of NEETs? And, have these patterns changed over time?
1991, 2001 and 2011 censuses were used to describe the geographical distribution of NEET over two decades. Geographies included local government authorities, area deprivation and urban rural categories.
Statistical Methods
Logistic regression was used to explore whether NEET status is independently associated with future economic and health outcomes, and also to explore what individual, household and area level factors are associated with the risk of becoming NEET.
Logistic regression is a statistical technique that allows you to investigate the relationship between an outcome variable (e.g. being NEET or not) and various explanatory variables. The analysis identifies which of the explanatory variables is significantly and independently related to the outcome variable. For example, it could be that the chance of becoming NEET (the binary outcome variable) increases with poor health (explanatory variable). Any other variable that also affects the chance of being NEET and is related to poor health, such as family background, should be included in the analysis. Only when poor health and family background are considered together can the independent effect of poor health (or family background) be isolated.
A range of negative outcomes such as unemployment, low status occupation, physical illness, mental illness, or drug misuse in later life were examined for Cohorts 1 and 2 in the study.
In order to assess whether NEET status had an impact that is independent of other socio-economic factors, a range of explanatory variables was included in the
model. Explanatory variables were selected on the basis of the literature review. Previous research was used to identify which factors might influence subsequent outcomes. For example, including gender allowed us to explore whether there was a difference between men and women in their probability of experiencing a negative outcome.
15
outcomes in 2011 over and above these demographic and socio-economic characteristics.
For the analyses of Cohort 2 (1991 cohort) we adjusted for the demographic and socio-economic factors mentioned above. In place of the binary NEET/not NEET variable, we included a variable indicating changes between NEET status in 1991 and subsequent economic activity in 2001 to predict the probability of the outcome by 2011. Thus we are able to examine whether being disengaged from employment and education in both 1991 and 2001 had a cumulative, negative effect on future employment or health. We are also able to explore whether moving from 1991 NEET status into employment in 2001, or moving from non-NEET status in 1991 into economically inactive status in 2001, had any effect on later life chances, by 2011.
In the risk factor analysis, we explored the extent to which personal attributes, family background, neighbourhood deprivation and local labour market
characteristics are related to NEET status.
Potential risk factors considered for Cohort 3 include individual and family variables from the 1991 Census, Carstairs 1991 quintile, teenage pregnancy, local NEET rate in 2001, and unpaid carer and highest educational qualification from the 2001
Census (see Appendix 4). Potential risk factors for Cohort 4 include birth weight, individual and family variables from the 2001 Census, Carstairs 2001 quintile, teenage birth, school census variables, prescription data, local NEET rate in 2011 and unpaid carer from the 2011 Census (see Appendix 5). Explanatory variables included whether an individual had a limiting long-term illness, as well as household factors including the economic activity and health status of household members and housing tenure. These variables were considered on the basis of previous literature or theory.
The main analysis for Cohort 4 concentrated on school census data. This choice was driven by the fact that this information is known to teachers and careers guidance officers and can therefore be used to identify at risk young people, whereas information relating to an individual's childhood experiences may be unknown. We used the examination results obtained by stage S4 because young people are aged 15-16 at this time and we wish to predict becoming NEET at ages 16-19 (see Appendix 3 for details). A second analysis which included data derived from the 2001 Census was therefore carried out in order to assess whether the census variables were important predictors of being NEET in addition to school census variables.
The model for Cohort 4 was used to develop a risk score to identify the group of young at high risk of becoming NEET.
16
All potential explanatory variables were tested using a manual stepwise procedure, and in the final model only those variables that were significant at the level of 0.05 were included.
Statistical analysis was conducted separately for males and females because of expected differences. For example, it might be expected that teenage birth is likely to be a far more important risk factor for females than for males.
Presentation of results
Model results are presented as odds ratios. An odds ratio is a measure of effect size, measuring the strength of association between two variables. An odds ratio above 1 indicates a positive relationship where an increase in the independent variable is associated with an increased likelihood of the outcome. An odds ratio below 1 indicates a negative relationship where a decrease in the likelihood of the outcome is associated with an increase in the independent variable. Odds ratios and significance levels are presented for the NEET status groups in the
consequences analyses and for each significant variable in the risk factor analyses in the tables of this report.
More detail is available in Appendix 2, which contains tables reporting odds ratios and their confidence intervals.
Strengths and Limitations of the analysis
There are at least four advantages of using the SLS:
The SLS is a rich data source which allows research on various outcomes, including those from census and other administrative sources. The sample size and design mean that we can repeat analyses on multiple cohorts and compare results over cohorts.
The prospective, longitudinal design of the SLS enables the analysis of the temporal sequence of lifetime factors before the occurrence of outcomes and ensures the direction of influence from factors to the outcome. For example using the SLS allowed us to identify risk factors leading to NEET status.
Also longitudinal data allows analysis of changes over time and how these changes are related to other factors.
Furthermore, the SLS includes data from 1991 to 2011 and we can analyse long-term effects of NEET experiences.
17
The census definition of NEET is a snapshot measure. However, because many young people take temporary jobs and change their status frequently, some commentators have argued that it is better to define NEETs as those who have been out of education and employment for three or six months continuously (Bynner and Parsons 2002). This information is not available in the census. Moreover, some studies have shown that there was no significant difference between the snap-shot definition and the definition using the continuous measure because these two types of NEET are more similar to each other in their
18
Chapter 3 Results
This chapter will present analytical results separately for consequences, risk factors and geographies of NEET.
Consequences of NEET status
This section describes the long-term (10 and 20 year) consequences of being NEET for Cohorts 1 and 2. Since these consequences might be attributed to other factors such as deprivation that precede the period of the outcomes being
investigated, such factors (limiting long-term illness, educational qualifications and living in a council area known as a NEET ‘hotspot’) were adjusted for. Thus the effect of NEET status on this range of outcomes from these models can be attributed to the long-term effect of having been NEET.
A number of socioeconomic and health outcomes have been examined in relation to NEET experiences. They include economic inactivity, low status occupations, limiting long-term illness, hospital admission following an A&E visit, hospital admission following an A&E visit due to self-harm, depression and anxiety prescription and drug misuse.
Key findings – Consequences
There is robust evidence that there is a scarring effect of NEET status in relation to long-term socioeconomic and health outcomes in the 20 years’ follow-up.
• The NEET group remains disadvantaged in their educational attainment 10 and 20 years later. More than one in five of NEET young people in 2001 had no qualifications by 2011 compared with only one in twenty five of
non-NEETs.
• There is a scarring effect in economic activity. In comparison with their non-NEET peers non-NEET young people in 2001 were 2.8 times as likely to be unemployed or economically inactive 10 years later.
• The scarring effect is also evident in the occupational positions that NEET young people entered. For example, NEET young people in 2001 were 2.5 times as likely as their non-NEET peers to work in a low status occupation in 2011.
• NEET experiences are associated with a higher risk of poor physical health after 10 and 20 years. The risk for the NEET group was 1.6 – 2.5 times that for the non-NEET group varying with different health outcomes.
19
NEET group is over 50% higher than that for the non-NEET group.
• Young people who were NEET in 1991 and remained economically inactive in 2001 consistently demonstrated significantly poorer outcomes by 2011 than those who were non-NEET in 1991 and economically active in 2001 and those who were engaged with employment or education in either 1991 or 2001. This suggests that there is a cumulative effect of being out of
employment or education on later life chances and this group is the most disadvantaged that need continuing support.
• Young people who changed from NEET status in 1991 to employment or education in 2001 have lower risks of poor life outcomes compared with those who were consistently in disadvantaged positions. However, the negative effect of NEET status in 1991 was not fully discounted by the later engagement of employment or education, indicating the long-lasting
detrimental effect of NEET experiences.
• Young people who changed from being non-NEET in 1991 to being
economically inactive or unemployed in 2001 have higher risks of poor life outcomes compared with those who were consistently in employment or education. This suggests that economic activity in 2001 is also predictive of later labour market and health outcomes regardless of NEET status in 1991.
Profiles of samples
This section provides summary statistics on NEETs in terms of gender, age and economic activity.
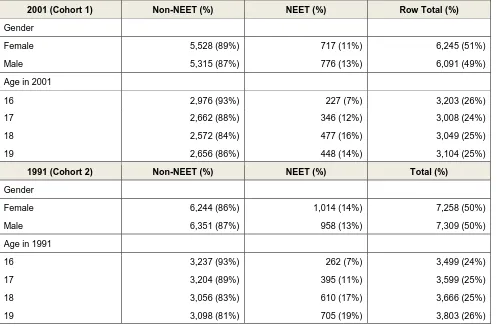
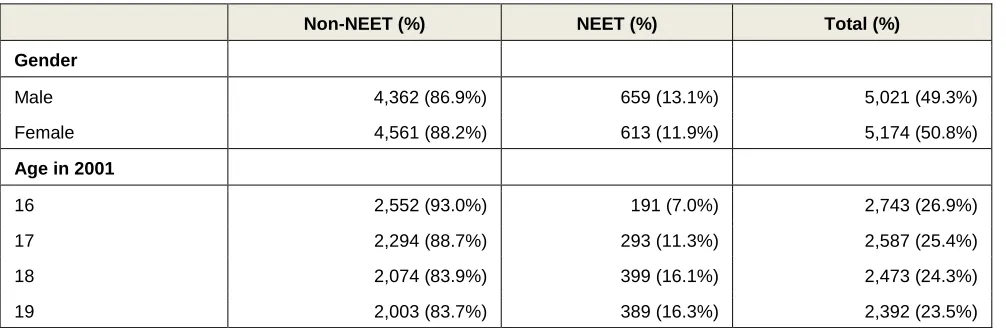
From Table 1 we can see that there were 717 female and 776 male NEETs in 2001 and similarly 1014 female and 958 male NEETs in 1991. Extrapolating to the whole population, this implies that the numbers of female NEET and male NEETs were separately 14340 and 15520 in 2001, and 20280 and 19160 in 1991. Both cohorts are relatively evenly distributed with respect to age. The gender distribution for both cohorts is also fairly even.
20
Table 1 Gender and age profiles of the 16-19 cohorts in 1991 and 2001
2001 (Cohort 1) Non-NEET (%) NEET (%) Row Total (%)
Gender
Female 5,528 (89%) 717 (11%) 6,245 (51%)
Male 5,315 (87%) 776 (13%) 6,091 (49%)
Age in 2001
16 2,976 (93%) 227 (7%) 3,203 (26%)
17 2,662 (88%) 346 (12%) 3,008 (24%)
18 2,572 (84%) 477 (16%) 3,049 (25%)
19 2,656 (86%) 448 (14%) 3,104 (25%)
1991 (Cohort 2) Non-NEET (%) NEET (%) Total (%)
Gender
Female 6,244 (86%) 1,014 (14%) 7,258 (50%)
Male 6,351 (87%) 958 (13%) 7,309 (50%)
Age in 1991
16 3,237 (93%) 262 (7%) 3,499 (24%)
17 3,204 (89%) 395 (11%) 3,599 (25%)
18 3,056 (83%) 610 (17%) 3,666 (25%)
19 3,098 (81%) 705 (19%) 3,803 (26%)
Source: SLS
The summary for economic activity for both cohorts is presented in Table 2. In 2001, 25% of females and 32% males were employed or self-employed, and 64% of females and 56% of males were studying. For females, 5% were unemployed and an equivalent percentage of them were economically inactive due to looking after home or family, or other reasons. For males, 9% reported being unemployed while only 3% reported being economically inactive due to looking after home or other reasons.
The distribution of economic activity categories for ages 16-19 in 1991 was quite different from that of 2001. The most notable change is that from being working in 1991 to being a student in 2001. The overall proportion working in 2001 was approximately half that in 1991, with this change being slightly higher for females. This trend reflects the increasing level of participation in post-compulsory education since the 1990s, and changes in labour market structure in the 1990s. However, the overall level of NEET was similar at 12-13%.
21 Table 2 Economic activity for Cohorts 1 and 2
Economic activity
2001 (Cohort 1) 1991 (Cohort 2)
female (%) male (%) female (%) male (%)
Working 1,553 (25) 1,931 (32) 3,717 (51) 3,911 (54)
Student 3,975 (64) 3,384 (56) 2,527 (35) 2,440 (33)
Unemployed 333 (5) 558 (9) 646 (9) 889 (12)
look after home 341 (5) 168 (3) 319 (4) 16 (0)
Sick 43 (1) 50 (1) 49 (1) 53 (1)
Total 6,245 (100) 6,091 (100) 7,258 (100) 7,309 (100)
Source: SLS
Educational attainment
This section examines whether NEETs remained disadvantaged 10 and 20 years later in terms of educational attainment.
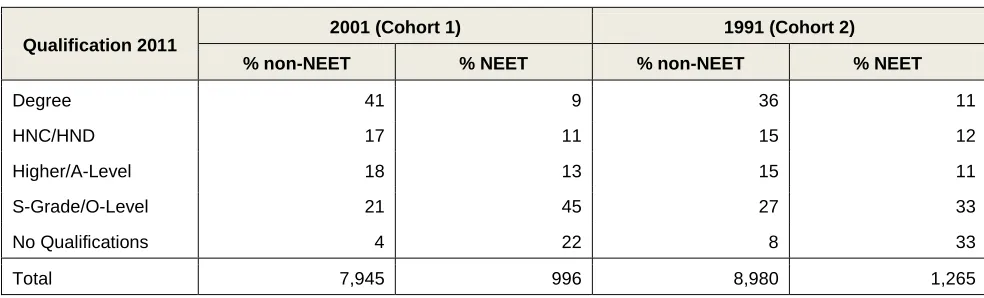
[image:24.595.51.543.509.658.2]Table 3 breaks down the level of qualification in 2011 by NEET status in 2001 and 1991. It can be seen that two thirds of those who were NEET were in the bottom two categories (Standard Grades and no qualifications) while only one third of non-NEET were in the same groups. For those non-non-NEET young people in 2001, 41% of them obtained degree level qualifications by 2011 compared with only 9% of NEETs in 2001. For the 2001 cohort, 22% of NEETs did not have any qualifications by 2011, over five times that of non-NEETs. Similarly 33% of 1991 NEETs did not have qualifications compared with 8% of non-NEETs by 2011.
Table 3 Qualification level in 2011 by NEET status 2001 and 1991
Qualification 2011
2001 (Cohort 1) 1991 (Cohort 2)
% non-NEET % NEET % non-NEET % NEET
Degree 41 9 36 11
HNC/HND 17 11 15 12
Higher/A-Level 18 13 15 11
S-Grade/O-Level 21 45 27 33
No Qualifications 4 22 8 33
Total 7,945 996 8,980 1,265
Source: SLS
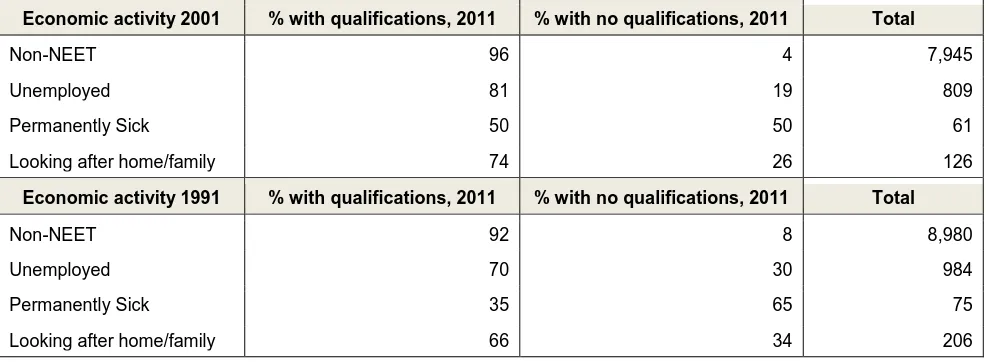
Table 4 highlights the 2011 educational qualification variable dichotomised between those with no qualifications and the rest broken down by the extended NEET
22
Permanent sickness here is a category from the census question asked in the context of economic activity. It relates to being out of work due to permanent sickness/disability.
In summary, there was little catch up in educational attainment over the life course for the NEET group (any gap year effect appeared small). In addition, education is a gateway to the labour market and is a protective factor for health. Lack of
[image:25.595.52.545.237.418.2]education qualifications 10 and 20 years later for those who were NEET implies their continued disadvantage in later life.
Table 4 Qualification level in 2011 by extended categories of NEET, 2001 and 1991
Economic activity 2001 % with qualifications, 2011 % with no qualifications, 2011 Total
Non-NEET 96 4 7,945
Unemployed 81 19 809
Permanently Sick 50 50 61
Looking after home/family 74 26 126
Economic activity 1991 % with qualifications, 2011 % with no qualifications, 2011 Total
Non-NEET 92 8 8,980
Unemployed 70 30 984
Permanently Sick 35 65 75
Looking after home/family 66 34 206
Source: SLS
Factors included in the models to control for their effects
Before we describe the analysis results of long-term effects of NEET experiences on life chances in detail we summarise the relationships between the variables which were adjusted for: gender, age, educational attainment, Carstairs deprivation, limiting long-term illness and living in a council area NEET ‘hotspot’ (see Statistical Methods and Appendix 1 for further details) and the outcome measures.
It should be noted that areas of residence for many young people may have changed over the follow-up period due to migration. For all outcomes there was a noticeable trend for outcomes to improve with a higher level of educational
23
several poorer outcomes. This suggests that both individual factors and contextual factors at these aggregated levels were important in influencing outcomes.
Economic inactivity
In this section we examine labour market outcomes in 2011 for those from the 2001 cohort and the 1991 cohort. The labour market outcome in 2011 was derived from the 2011 census. The economic activity variable was used to classify people into those who were unemployed or economically inactive and the rest, consistent with the division between NEET and non-NEET young people. For simplicity, we use the term ‘inactive’ to refer to people who were either unemployed or economically inactive and the term ‘active’ to refer to people who were working or studying.
People from both cohorts were predominantly either involved in economic activity or were inactive due to non-educational reasons when they were aged 26-29 or 36-39. Only around 2% of the cohorts were in education or training in 2011.
It can be seen for both the 1991 and 2001 cohorts that those who were NEET were more likely to be economically inactive by 2011 (Table 5). For example, those who were NEET in 2001 were more likely to report subsequent economic inactivity in 2011. About 43% of those who were NEET in 2001 did not engage in employment or study in 2011, compared with 11% of those who were non-NEET (Table 5). Similarly 28% of 1991 NEET young people were out of employment or education when they were aged 36-39, close to three times the rate for non-NEET young individuals.
Table 5 Economic activity in 2011 by 2001 and 1991 NEET status
NEET status, 2001 % Economically active % Not active Total
Non-NEET 89 11 7,945
NEET 57 43 996
NEET status 1991 % Economically active % Not active Total
non-NEET 90 10 8,980
NEET 72 28 1,265
Source: SLS
24
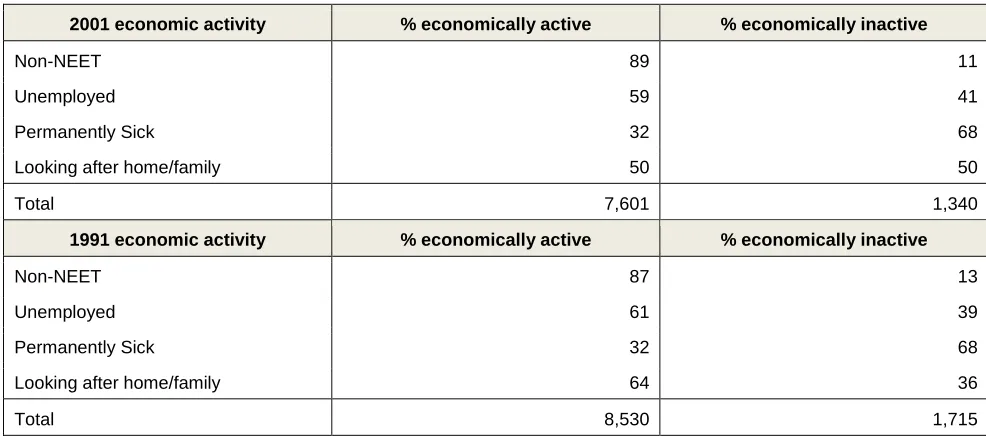
[image:27.595.50.543.148.368.2]would be that mothers in the 2001 cohort would be aged 26-29 in 2011 and still likely to be looking after children whereas mothers in the 1991 cohort would be more likely to have returned to work when aged 36-39 in 2011.
Table 6 Economic activity in 2011 by 2001 and 1991 extended categories of NEET
2001 economic activity % economically active % economically inactive
Non-NEET 89 11
Unemployed 59 41
Permanently Sick 32 68
Looking after home/family 50 50
Total 7,601 1,340
1991 economic activity % economically active % economically inactive
Non-NEET 87 13
Unemployed 61 39
Permanently Sick 32 68
Looking after home/family 64 36
Total 8,530 1,715
Source: SLS
Linking 1991, 2001 and 2011 records allowed us to examine the dynamics of
movement into and out of employment or education in the 20 years follow-up. Table 7 shows that those who were NEET in 1991 were more likely to report subsequent economic inactivity in 2001 and/or 2011. Over 50% of those who were NEET in 1991 were not economically active at either or both subsequent censuses,
compared with 21% of those who were non-NEET in 1991 (Table 7). Nearly 30% of 1991 NEETs were economically inactive in both 2001 and 2011, compared to only 6% of their non-NEET counterparts. This suggests that this group was the most disadvantaged and would need most assistance to gain employment.
If the estimate is extended to the Scotland population, this indicates that, in total, more than 5,500 (5% SLS sample, 958*29%*20) young people who were NEET in 1991 remained out of employment or education in both 2001 and 2011. Making up only 12% of the 1991 cohort, NEET young people accounted for over 38% of those who remained out of employment or education in both years. Although some of them may be out of employment for family reasons or due to illness, the impact on the size of the workforce was substantial as this group was aged between 16 and 39 in the follow-up period when most could be expected to contribute to the
25
Table 7 Economic activity in 2001 and 2011 by 1991 NEET status
Economic activity, 2001 & 2011 % non-NEET 1991 % NEET 1991
Active both 2001 and 2011 79 44
Active 2001, not active 2011 7 10
Not Active 2001, active 2011 8 17
Inactive both 2001 and 2011 6 29
Total 7,306 958
Source: SLS
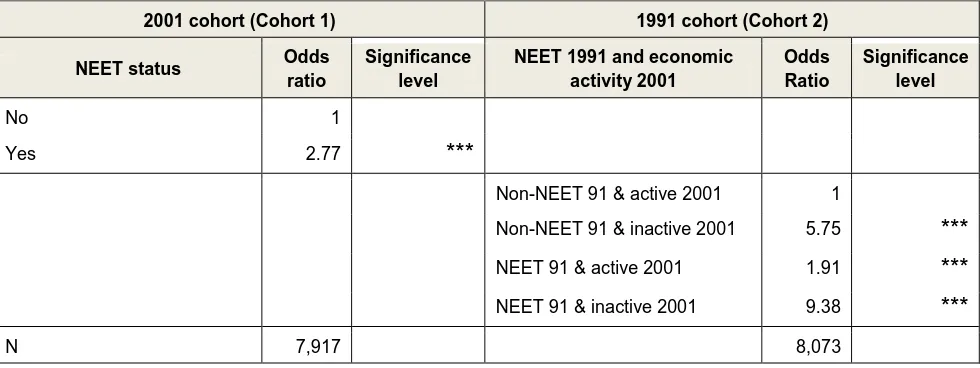
Table 8 shows the results from models of being economically inactive versus being active at Census 2011. The results in Table 8 show a substantial NEET effect, independent of the other factors in the model. Young people who were NEET in 2001 were nearly three times as likely as their non-NEET counterparts to be out of employment or education in 2011.
[image:28.595.54.544.416.600.2]The last column in Table 8 shows results from the model for the 1991 cohort of being economically inactive versus economically active in 2011. We used a variable indicating the NEET status in 1991 and economic activity in 2001 as described in the Statistical Methods.
Table 8 Odds ratios of economic inactivity in 2011 from logistic regression
2001 cohort (Cohort 1) 1991 cohort (Cohort 2) NEET status Odds
ratio
Significance level
NEET 1991 and economic activity 2001
Odds Ratio
Significance level
No 1
Yes 2.77 ***
Non-NEET 91 & active 2001 1
Non-NEET 91 & inactive 2001 5.75 ***
NEET 91 & active 2001 1.91 ***
NEET 91 & inactive 2001 9.38 ***
N 7,917 8,073
*P<0.10 **p<0.05 ***p<0.01, Source: SLS
26 Low status occupations
The occupational position of those in work is examined in this section. The
occupational positions in 2011 and 2001 by 1991 NEET status are shown in Table 9. The outcome variable was based on National Statistics Socio-Economic
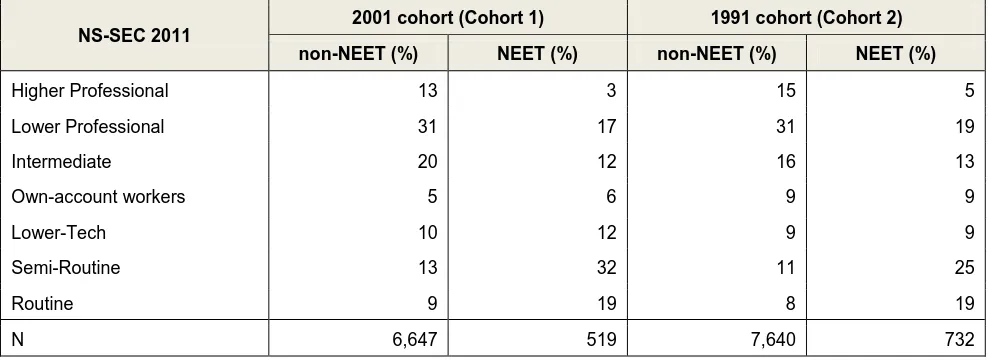
Classification (NS-SEC), a derived variable from the census (see Appendix 3). It can be seen that 44% of people who were non-NEET in 2001 were in the Higher Professional and Lower Professional categories by 2011, compared to 20% of those who were NEET. Over half of NEET young people in 2001 were in the Semi-Routine or Semi-Routine occupational category by 2011 in contrast to only about one fifth of their non-NEET peers.
[image:29.595.51.546.348.528.2]The distribution of occupation categories in 2011 by 1991 NEET status is similar to that by 2001 NEET status, which again shows the persistence of a negative effect of NEET status after a 20 year period. Ending up in low status occupations is another indicator of a scarring effect associated with NEETs.
Table 9 2011 National Statistics-Socio-Economic Classification categories by 2001 and 1991 NEET status
NS-SEC 2011
2001 cohort (Cohort 1) 1991 cohort (Cohort 2) non-NEET (%) NEET (%) non-NEET (%) NEET (%)
Higher Professional 13 3 15 5
Lower Professional 31 17 31 19
Intermediate 20 12 16 13
Own-account workers 5 6 9 9
Lower-Tech 10 12 9 9
Semi-Routine 13 32 11 25
Routine 9 19 8 19
N 6,647 519 7,640 732
Source: SLS
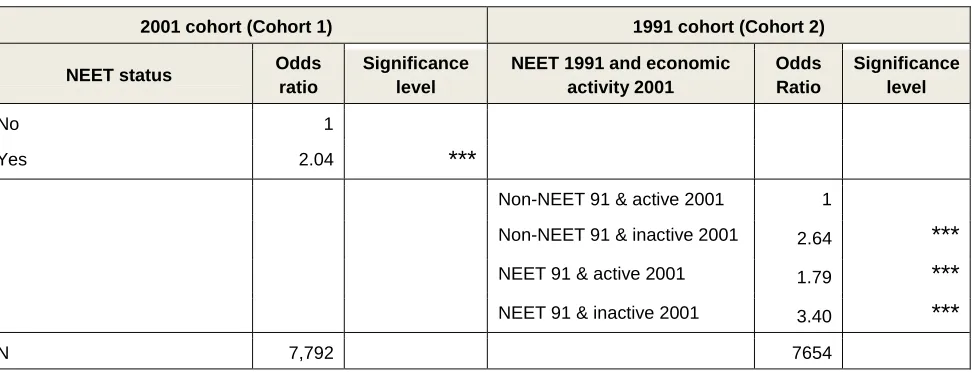
Models were fitted to examine the likelihood of working in low status occupations as defined by NS-SEC categories: Semi-Routine and Routine occupations (Rose and O’Reilly, 1997). As expected, being NEET in 2001 is associated with a higher (more than twice as likely) risk of working in low status occupations by 2011 (Table 10).
27
Table 10 Odds ratio of low status occupations in 2011 from logistic regression
2001 cohort (Cohort 1) 1991 cohort (Cohort 2) NEET status Odds
ratio
Significance level
NEET 1991 and economic activity 2001
Odds Ratio
Significance level
No 1
Yes 2.04 ***
Non-NEET 91 & active 2001 1
Non-NEET 91 & inactive 2001 2.64 ***
NEET 91 & active 2001 1.79 ***
NEET 91 & inactive 2001 3.40 ***
N 7,792 7654
*P<0.10 **p<0.05 ***p<0.01, Source: SLS
Limiting long-term illness
Whether an individual has a limiting long-term illness (LLTI) is a question that has been asked in the census since 1991. Table 11 shows LLTI status in 2011 by 2001 and 1991 NEET status. It is clear that being NEET in 2001 was associated with higher risks of reporting LLTI in 2011. About 18% of NEET people reported limiting long-term illness in 2011, while by contrast only 6% of non-NEET reported such a condition. There was an increase in the proportion of people who reported LLTI in 2011 for the 1991 cohort, which is likely associated with their older ages as this cohort was aged between 36 and 39 by 2011. Nevertheless, those who were NEET in 1991 were again more likely to report LLTI in 2011 than their non-NEET
counterparts, with a rate more than double that among non-NEETs.
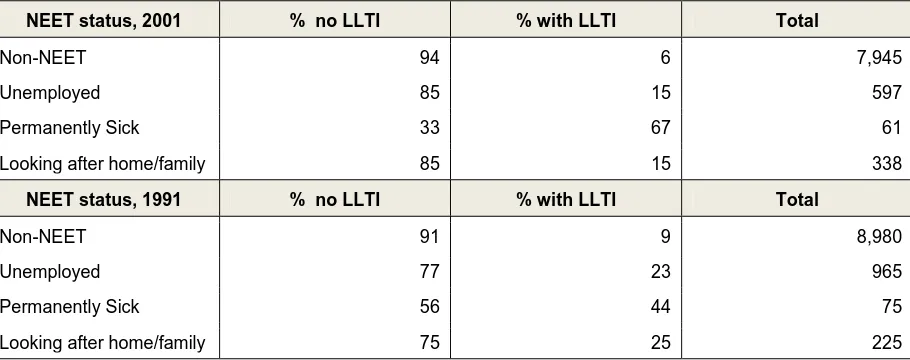
Proportions of people reporting LLTI in 2011 by extended NEET categories are presented in Table 12. As expected, the highest proportion reporting limiting long-term illness in 2011 were those who were permanently sick in 2001, the percentage being 67%. A similar proportion of those who were unemployed and those who were looking after family reported LLTI in 2011. Likewise, among people who reported being permanently sick in 1991, over 40% reported LLTI 20 years later.
28
Table 11 Limiting long-term illness in 2011 by 2001 and 1991 NEET status
NEET status, 2001 % no LLTI % with LLTI Total
Non-NEET 94 6 7,945
NEET 82 18 996
NEET status 1991 % no LLTI % with LLTI Total
non-NEET 91 9 8,980
NEET 76 24 1,265
[image:31.595.57.512.274.454.2]Source: SLS
Table 12 Limiting long-term illness in 2011 by extended categories of NEET in 2001 and 1991
NEET status, 2001 % no LLTI % with LLTI Total
Non-NEET 94 6 7,945
Unemployed 85 15 597
Permanently Sick 33 67 61
Looking after home/family 85 15 338
NEET status, 1991 % no LLTI % with LLTI Total
Non-NEET 91 9 8,980
Unemployed 77 23 965
Permanently Sick 56 44 75
Looking after home/family 75 25 225
Source: SLS
The model results for the LLTI are presented in Table 13. These show an
independent effect of being NEET in 2001 on the outcome, net of the other factors controlled in the model including having reported having LLTI in previous censuses. Young people who were NEET in 2001 were over 70% more likely than their non-NEET peers to report limiting long-term illness in 2011.
29
Table 13 Odds ratio of having limiting long-term illness in 2011 from logistic regression
2001 cohort (Cohort 1) 1991 cohort (Cohort 2) NEET status Odds
ratio
Significance level
NEET 1991 and economic activity 2001
Odds Ratio
Significance level
No 1
Yes 1.74 ***
Non-NEET 91 & active 2001 1
Non-NEET 91 & inactive 2001 3.73 ***
NEET 91 & active 2001 1.47 **
NEET 91 & inactive 2001 4.06 ***
N 7,917 8,073
*P<0.10 **p<0.05 ***p<0.01, Source: SLS
Hospital Admissions
This section looks at whether health outcomes measured as hospitalisation following an accident and emergency (A&E) visit are related to NEET status. The data were provided by Information Services Division (ISD). The outcomes reported in the analysis below identify whether an individual had at least one such hospital admission between 2001 and 2010.
An admission to hospital following a visit to A&E is a negative health outcome. A relationship between NEET status and subsequent hospital admission is therefore an indicator of a health disadvantage. A relationship of this variety might also be considered indicative of an attitude to risk or a lifestyle which includes greater risk. People who have more risky lifestyles are possibly more likely to end up in a
hospital A&E, and this is especially so for young people. It is also likely that those admitted to hospital following a visit to A&E were suffering from a more severe health condition than those who merely attended A&E.
The second health outcome is related to hospital admission following a visit to A & E due to deliberate self-harm. This subgroup distinguishes those who are subject to considerable psychological stress from those who have experienced an accident, for example.
Table 14 tabulates the hospital admissions following an A&E visit for the 2001 cohort and the 1991 cohort separately. As with the LLTI outcome it is evident that those who were NEET are disproportionately likely to experience hospital
30
Table 14 Admitted to hospital following an accident & emergency (A&E) visit between 2001 and 2010 by 2001 and 1991 NEET status
NEET status A & E A & E due to self-harm 2001 cohort
(Cohort 1) %no admission %any admission %no admission %any admission Total
non-NEET 77 23 98 2 7,445
NEET 64 36 93 7 964
1991 cohort
(Cohort 2) %no admission %any admission %no admission %any admission N
non-NEET 78 22 99 1 7,582
NEET 66 34 95 5 1,006
Source: SLS and ISD
If the statistics based on the 2001 cohort from Table 14 are applied to the Scotland population, around 6,900 NEET young people have been admitted to hospital
following an A&E visit at least once over 10 years between 2001 and 2010. If policy interventions were to be successful in eliminating NEET and its damaging
co-determinants among young people, the number of visits to hospital following an A&E visit might be reduced by over 2,500 (964*36%*20-964*23%*20), a 36% reduction.
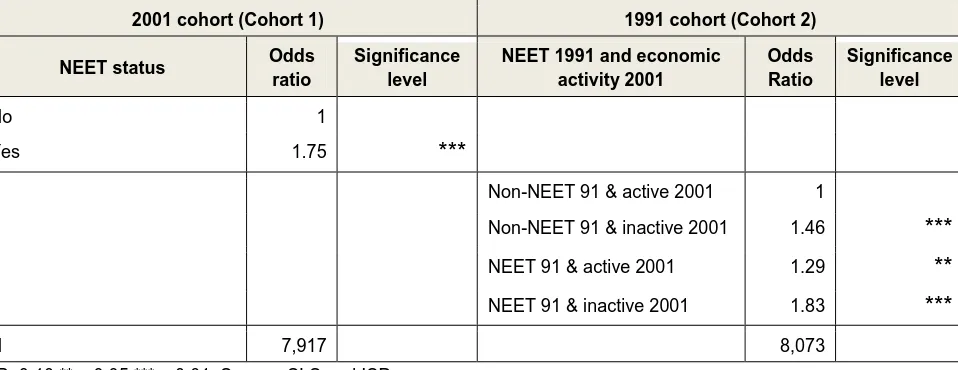
[image:33.595.62.541.543.728.2]Tables 15 and 16 show modelling results for the hospital admissions outcomes. Again there is a strong significant association between being NEET and each of the outcomes for the 2001 cohort. NEET young people were 75% more likely than their non-NEET peers to be admitted to hospital following a visit to A&E. Also NEET individuals were more likely to be admitted to hospital following an A&E visit due to deliberate self-harm, with the odds more than double the odds for non-NEETs.
Table 15 Odds ratio (OR) of hospital admission following a visit to accident and emergency between 2001 and 2010 from logistic regression
2001 cohort (Cohort 1) 1991 cohort (Cohort 2) NEET status Odds
ratio
Significance level
NEET 1991 and economic activity 2001
Odds Ratio
Significance level
No 1
Yes 1.75 ***
Non-NEET 91 & active 2001 1
Non-NEET 91 & inactive 2001 1.46 ***
NEET 91 & active 2001 1.29 **
NEET 91 & inactive 2001 1.83 ***
N 7,917 8,073
31
Table 16 Odds ratio of hospital admission following a visit to accident and emergency due to self-harm between 2001 and 2010 from logistic regression
2001 cohort (Cohort 1) 1991 cohort (Cohort 2) NEET status Odds
ratio
Significance level
NEET 1991 and economic activity 2001
Odds Ratio
Significance level
No 1
Yes 2.23 ***
Non-NEET 91 & active 2001 1
Non-NEET 91 & inactive 2001 2.92 ***
NEET 91 & active 2001 2.63 ***
NEET 91 & inactive 2001 8.23 ***
N 7,917 8050
*P<0.10 **p<0.05 ***p<0.01, Source: SLS and ISD
From the model for the 1991 cohort we can see that those who were consistently outside employment and education in 1991 and 2001 were nearly twice as likely as those who were engaged in employment or education at both time points to be admitted to hospital following a visit to A&E. The odds differential was much higher with respect to hospital admission due to deliberate self-harm, with those who were NEET in 1991 and economically inactive in 2001 being over 8 times as likely to be hospitalised compared with those who were in employment or education at both time points.
Young adults moving either from non-NEET status in 1991 into being economically inactive in 2001 or NEET status in 1991 into being economically active in 2001 were also at a higher risk of hospital admission following a visit to A&E, both in general and due to self-harm. For example, the odds among young people who moved from being non-NEET in 1991 to being economically inactive in 2001 were 3 times those of the reference group (non-NEET and economically active in 2001) to have a hospital admission following A&E due to self-harm. This is suggestive of the mitigating effect of being in employment or education at some stage but, again, the effect of having been NEET in 1991 was not fully discounted.
NEET status at least 11 years prior to hospital admission predicted a greater likelihood of having at least one hospitalisation following a visit to A&E, suggesting an ongoing or accumulating lifestyle of risk-taking and stress significantly above that of the general population.
Depression and anxiety
32
The prescription of antidepressant and antianxiety drugs between 2009 and 2012 by NEET status in 2001 and 1991 is presented in Table 17. Overall, nearly half of young people who were NEET in 2001 were treated for depression or anxiety, while slightly over a quarter of non-NEETs had the same experience.
The incidence of depression and anxiety was slightly higher for the older 1991 cohort than for the 2001 cohort. Over half of those who were NEET in 1991 were prescribed antidepressant or antianxiety medication compared with one third of non-NEETs.
The scale of the effect of being NEET on the prescription of medication for
depression and anxiety can be illustrated further based on the summary statistics of the 2001 cohort in Table 17. Overall more than 10,000 prescriptions (1102*48%*20) were dispensed to NEET young people between 2009 and 2012. If these NEET young people had the same level of depression or anxiety as their non-NEET peers, in total only about 6,000 (1102*27%*20) prescriptions would have been dispensed, a reduction of 40% for the NEET group. In other words, reducing the number in the NEET group and their higher mental health risk factors, would have a substantial impact on excess mental ill health in this young group.
Table 17 Prescription of antidepressant and antianxiety drugs between 2009 and 2012 by 2001 and 1991 NEET status
NEET status, 2001 % no % yes Total
Non-NEET 72 27 7,468
NEET 52 48 1,102
NEET status, 1991 % no % yes Total
Non-NEET 67 33 7,553
NEET 48 52 1,120
Source: SLS and ISD
Logistic regression models were fitted to investigate the relationships between NEET status and the risk of depression and anxiety.
Table 18 shows that being NEET in 2001 was associated with a higher risk of depression and anxiety around a decade later, indicating that this group was over 50% more likely to be treated for depression or anxiety than their counterparts who were non-NEET in 2001.
Having a limiting long-term illness in 2001 was also associated with a higher risk of depression and anxiety, and the size of the effect is similar to that of being NEET (see appendix 2). This is not unexpected as it reflects the long-term nature of some mental health problems, as well as the association between chronic physical
33
From the model for the 1991 cohort, we can see that young adults who were disadvantaged in both 1991 and 2001 (NEET and economically inactive
respectively) were 2.8 times as likely as their counterparts who were advantaged at both time points to be treated for depression or anxiety. Those who were non-NEET in 1991 but became economically inactive in 2001 also showed a higher risk of depression or anxiety compared with the reference group, with nearly double the odds of those who were non-NEET in 1991 and economically active in 2001. Young people who moved from NEET status in 1991 to become economically active in 2001 also had higher risks of depression or anxiety, again suggesting the long lasting negative effect of the NEET experience.
Overall, the results show that NEET experiences are associated with increased antidepressants and antianxiety treatment 10 years and 20 years later and that this effect is independent of a number of socio-economic factors at both individual and area levels.
Table 18 Odds ratio of being prescribed with antidepressant or antianxiety drugs between 2009 and 2012 from logistic regression
2001 cohort (Cohort 1) 1991 cohort (Cohort 2) NEET status Odds
ratio
Significance level
NEET 1991 and economic activity 2001
Odds Ratio
Significance level
No 1
Yes 1.56 ***
Non-NEET 91 & active 2001 1
Non-NEET 91 & inactive 2001 1.92 ***
NEET 91 & active 2001 1.56 ***
NEET 91 & inactive 2001 2.76 ***
N 7,917 8073
*P<0.10 **p<0.05 ***p<0.01, Source: SLS and ISD
Drug misuse
Drug misuse usually refers to the illicit use of any opiate or benzodiazepine. Drug misuse data were collected from the Scottish Drug Misuse Database held by ISD. This database contains anonymised data on individuals at the point of first contact with a range of drug services, including non-statutory agencies and general
practitioners. The data covers the period between 2006 and 2012. Drug misuse by 2001 and 1991 NEET status is presented in Table 19. Nearly one out of every twenty five of those who were NEET in 2001were recorded as users of illicit
34
Table 19 Drug misuse between 2006 and 2012 by NEET status in 2001 and 1991
NEET status, 2001 % no % yes Total
Non-NEET 99 1 7,945
NEET 96 4 996
NEET status, 1991 % no % yes Total
Non-NEET 99 1 8,980
NEET 96 4 1,265
Source: SLS and ISD
We used logistic regression to examine the relationship between NEET status and drug misuse (Table 20). Being NEET in 2001 is found to be associated with a higher risk of drug misuse between 2006 and 2012, with this NEET group being more than 2 times likely to use these drugs than their non-NEET counterparts.
For the 1991 cohort, analytical results showed that young adults who were
excluded from employment and education in both 1991 and 2001 were more than 9 times as likely as their counterparts who were advantaged at both time points to be involved in drug misuse. For those who were non-NEET in 1991 but moved to being economically inactive in 2001 the risk of drug misuse was four times that of the reference group who were non-NEET in 1991 and economically active in 2001. Young people who had moved from NEET status in 1991 to being economically active in 2001 did not show a higher risk of drug misuse. This suggests that while being NEET has long-term negative effects, moving into employment substantially mitigates the risk of drug misuse.
Table 20 Odds ratio of drug misuse between 2006 and 2012 from logistic regression
2001 cohort (Cohort 1) 1991 cohort (Cohort 2) NEET status Odds
ratio
Significance level
NEET 1991 and economic activity 2001
Odds Ratio
Significance level
No 1
Yes 2.47 ***
Non-NEET 91 & active 2001 1
Non-NEET 91 & inactive 2001 3.91 ***
NEET 91 & active 2001 0.35
NEET 91 & inactive 2001 9.18 ***
N 7,917 8,073
35 Risk factors of becoming NEET
This section describes the characteristics of Cohorts 3 and 4 and the results of modelling the risk of being NEET. Lists of the independent variables considered for Cohorts 3 and 4 are given in Appendices 5 and 6.
Key Findings – Risk Factors
There is strong evidence that being NEET is associated with the following
demographic and socioeconomic factors. These risk factors seemed to be similar for young people growing-up in the 1990’s compared to the 2000’s.
• Risk factors are consistent across two cohorts and between males and females.
• Educational qualification is the most important factor. No qualifications increased the risk of being NEET by 6 times for males and 8 times for
females in Cohort 3. No qualifications at SCQF level 5 or higher obtained by school stage S4 increase the risk of being NEET by 10 times for males and 7 times for females in Cohort 4.
• Other school factors are important including the proportion of time absent from school and the number of exclusions.
• Two factors are especially important for females: being an unpaid carer for more than 20 hours per week and teenage pregnancy.
• Household factors are also important. Living in a social renting household, living in a family that is not headed by a married couple, living in a household with no employed adults, having a large number of siblings all increased the risk of becoming NEET.
• Local NEET rate is an important factor for both cohorts and genders, with the risk of NEET increasing with local NEET rate.
• A risk score derived from the statistical modelling has potential to identify young people who are at risk of becoming NEET.
The 2001 NEETs
This sample consists of all SLS members aged 16-19 in 2001 who were also present in the 1991 census (Cohort 3).
There are slightly more females than males in the sample. The NEET rate is slightly higher for males than for females. The NEET rate is lowest for 16 year olds,